AI PPT Maker
Templates
PPT Bundles
Design Services
Business PPTs
Business Plan
Management
Strategy
Introduction PPT
Roadmap
Self Introduction
Timelines
Process
Marketing
Agenda
Technology
Medical
Startup Business Plan
Cyber Security
Dashboards
SWOT
Proposals
Education
Pitch Deck
Digital Marketing
KPIs
Project Management
Product Management
Artificial Intelligence
Target Market
Communication
Supply Chain
Google Slides
Research Services
 One Pagers
All Categories
Statistical analysis PowerPoint Presentation Templates and Google Slides
SHOW
- 60
- 120
- 180
DISPLAYING: 60 of 236 Item(s)
Page


Slide 1 of 24
Improve your presentation delivery using this Statistical Trend Analysis Ppt PowerPoint Presentation Complete With Slides. Support your business vision and objectives using this well-structured PPT deck. This template offers a great starting point for delivering beautifully designed presentations on the topic of your choice. Comprising twenty four this professionally designed template is all you need to host discussion and meetings with collaborators. Each slide is self-explanatory and equipped with high-quality graphics that can be adjusted to your needs. Therefore, you will face no difficulty in portraying your desired content using this PPT slideshow. This PowerPoint slideshow contains every important element that you need for a great pitch. It is not only editable but also available for immediate download and utilization. The color, font size, background, shapes everything can be modified to create your unique presentation layout. Therefore, download it now.


Slide 1 of 7
This is a statistics data analysis layout good ppt example. This is a three stage process. The stages in this process are data quality, data integration, master data management.


Slide 1 of 7
This is a business profit statistical analysis presentation background images. This is a five stage process. The stages in this process are collection of data, organization of data, interpretation of data, calculate results, analyze results.


Slide 1 of 7
This is a statistical analysis presentation powerpoint example. This is a seven stage process. The stages in this process are map results, external agents, statistical analysis, clean data, system boundary, analyze data, major function.


Slide 1 of 6
Presenting this set of slides with name business charts for statistical analysis ppt powerpoint presentation pictures gridlines. The topics discussed in these slides are education, growth, pencil bar graph. This is a completely editable PowerPoint presentation and is available for immediate download. Download now and impress your audience.


Slide 1 of 6
Presenting this set of slides with name content marketing statistics analysis ppt powerpoint presentation file slideshow. The topics discussed in these slides are finance, marketing, management, investment, analysis. This is a completely editable PowerPoint presentation and is available for immediate download. Download now and impress your audience.


Slide 1 of 6
This is a market size data chart statistical analysis ppt powerpoint presentation model format. The topics discussed in this diagram are market growth, market opportunity, market profitability. This is a completely editable PowerPoint presentation, and is available for immediate download.


Slide 1 of 6
This is a marketing performance statistical analysis customers and revenue report ppt powerpoint presentation outline shapes. This is a four stage process. The stages in this process are marketing analytics, marketing performance, marketing discovery.


Slide 1 of 6
This is a financial charts and graphs for statistical analysis ppt powerpoint presentation show layout. This is a four stage process. The stages in this process are business metrics, business kpi, business dashboard.
Slide 1 of 5
Presenting this set of slides with name statistical analysis vector icon ppt powerpoint presentation layouts tips. This is a one stage process. The stages in this process are market entry analysis, market attractiveness, strategic analysis. This is a completely editable PowerPoint presentation and is available for immediate download. Download now and impress your audience.


Slide 1 of 5
Statistical Tools For Data Analysis And Interpretation Ppt PowerPoint Presentation Portfolio Visuals
Presenting this set of slides with name Statistical Tools For Data Analysis And Interpretation Ppt PowerPoint Presentation Portfolio Visuals. This is a six process. The stages in this process are marketing, management, measuring results. This is a completely editable PowerPoint presentation and is available for immediate download. Download now and impress your audience.
Slide 1 of 5
Presenting this set of slides with name magnifying glass with arrow statistical analysis vector icon ppt powerpoint presentation show icon. This is a three stage process. The stages in this process are data icon, status icon, status symbol icon. This is a completely editable PowerPoint presentation and is available for immediate download. Download now and impress your audience.


Slide 1 of 5
Presenting this set of slides with name charts vector for statistical analysis ppt powerpoint presentation layouts professional. The topics discussed in these slides are data icon, status icon, status symbol icon. This is a completely editable PowerPoint presentation and is available for immediate download. Download now and impress your audience.


Slide 1 of 5
Presenting this set of slides with name web statistics analysis ppt powerpoint presentation outline infographics cpb. This is an editable Powerpoint three stages graphic that deals with topics like web statistics analysis to help convey your message better graphically. This product is a premium product available for immediate download and is 100 percent editable in Powerpoint. Download this now and use it in your presentations to impress your audience.


Slide 1 of 5
Presenting this set of slides with name statistics analysis ppt powerpoint presentation file slides cpb. This is an editable Powerpoint four stages graphic that deals with topics like statistics analysis to help convey your message better graphically. This product is a premium product available for immediate download and is 100 percent editable in Powerpoint. Download this now and use it in your presentations to impress your audience.


Slide 1 of 5
Presenting this set of slides with name statistical analysis ppt powerpoint presentation styles visual aids cpb. This is a four stage process. The stages in this process are statistical analysis. This is a completely editable PowerPoint presentation and is available for immediate download. Download now and impress your audience.
Slide 1 of 5
This is a market statistical analysis vector icon ppt powerpoint presentation file design inspiration. The topics discussed in this diagram are market growth, market opportunity, market profitability. This is a completely editable PowerPoint presentation, and is available for immediate download.
Slide 1 of 5
This is a centre of excellence statistical analysis and technological capabilities ppt powerpoint presentation icon templates. This is a three stage process. The stages in this process are competence center, integration center of excellence.


Slide 1 of 5
This is a statistical analysis ppt powerpoint presentation styles graphics design. This is a six stage process. The stages in this process are marketing, business, management, compare.


Slide 1 of 5
This is a statistical analysis slide ppt powerpoint presentation inspiration graphics. This is a four stage process. The stages in this process are marketing, business, management, compare.


Slide 1 of 5
This is a statistical analysis of business growth investment and target market ppt powerpoint presentation infographics professional. This is a four stage process. The stages in this process are year in review, yearly highlights, countdowns.


Slide 1 of 5
This is a statistical analysis of financial markets ppt powerpoint presentation model graphic images. This is a four stage process. The stages in this process are stock market, financial markets, bull market.


Slide 1 of 5
This is a mobile data and statistical analysis ppt powerpoint presentation slides portrait. This is a two stage process. The stages in this process are mobile analytics, mobile tracking, mobile web analytics.


Slide 1 of 5
This is a quantitative analysis statistics ppt powerpoint presentation layouts layouts cpb. This is a eight stage process. The stages in this process are quantitative analysis statistics.


Slide 1 of 5
This is a statistical analysis ppt powerpoint presentation inspiration information. This is a six stage process. The stages in this process are business, management, marketing.


Slide 1 of 5
This is a statistical analysis slide ppt powerpoint presentation slides templates. This is a four stage process. The stages in this process are business, management, marketing.


Slide 1 of 5
This is a statistical analysis ppt powerpoint presentation file background images. This is a six stage process. The stages in this process are business, management, marketing.


Slide 1 of 5
This is a statistical analysis slide ppt powerpoint presentation outline themes. This is a five stage process. The stages in this process are business, management, marketing.


Slide 1 of 5
This is a product life cycle key performance objectives statistical analysis ppt powerpoint presentation model example file. This is a four stage process. The stages in this process are product life cycle, key performance objectives, statistical analysis.


Slide 1 of 5
This is a leadership coaching statistical analysis quotative finance sales management ppt powerpoint presentation styles format ideas. This is a six stage process. The stages in this process are leadership coaching, statistical analysis, quotative finance, sales management.


Slide 1 of 5
This is a statistical analysis template 2 ppt powerpoint presentation layouts background image. This is a three stage process. The stages in this process are treatment, error, total, table, business.


Slide 1 of 5
This is a statistical analysis template 1 ppt powerpoint presentation styles inspiration. This is a three stage process. The stages in this process are control, condition, mean difference, lower bound, upper bound.


Slide 1 of 5
This is a statistical analysis template 2 ppt powerpoint presentation show infographic template. This is a six stage process. The stages in this process are statistical analysis, compere, business, marketing, strategy.


Slide 1 of 5
This is a statistical analysis template 1 ppt powerpoint presentation pictures aids. This is a four stage process. The stages in this process are statistical analysis, compere, business, marketing, strategy.


Slide 1 of 5
This is a statistical analysis template 2 ppt powerpoint presentation summary ideas. This is a two stage process. The stages in this process are business, table, analysis, management, success.


Slide 1 of 5
This is a statistical analysis template 1 ppt powerpoint presentation outline professional. This is a four stage process. The stages in this process are treatment, table, management, business, planning.


Slide 1 of 5
This is a statistical analysis template 2 ppt powerpoint presentation summary visuals. This is a three stage process. The stages in this process are treatment, error, total, business, table.


Slide 1 of 5
This is a statistical analysis template 1 ppt powerpoint presentation infographics show. This is a three stage process. The stages in this process are one dollar, control, condition, lower bound, upper bound.


Slide 1 of 5
This is a statistical analysis template 2 ppt powerpoint presentation file files. This is a four stage process. The stages in this process are error, total, treatment.


Slide 1 of 5
This is a statistical analysis template 1 ppt powerpoint presentation layouts summary. This is a four stage process. The stages in this process are mean difference, lower bound, confidence interval, lower bound, upper bound.


Slide 1 of 5
This is a statistical analysis template 2 ppt powerpoint presentation show templates. This is a two stage process. The stages in this process are control, one dollar, lower bound, upper bound.


Slide 1 of 5
This is a statistical analysis template 1 ppt powerpoint presentation outline show. This is a four stage process. The stages in this process are treatment, error, total.


Slide 1 of 5
This is a statistical analysis template 2 ppt powerpoint presentation infographics deck. This is a two stage process. The stages in this process are control, one dollar, twenty dollars, lower bound, upper bound.


Slide 1 of 5
This is a statistical analysis template 1 ppt powerpoint presentation portfolio layout ideas. This is a four stage process. The stages in this process are treatment, error, total.


Slide 1 of 5
This is a statistical analysis template 2 ppt powerpoint presentation gallery designs. This is a four stage process. The stages in this process are treatment, error, total, table, business.


Slide 1 of 5
This is a statistical analysis template 1 ppt powerpoint presentation layouts tips. This is a six stage process. The stages in this process are control, condition, mean difference, lower bound, upper bound.


Slide 1 of 4
This PowerPoint template contains diagram of bar graph with yearly percentage ratios. You may download this slide to display statistical analysis. You can easily customize this template to make it more unique as per your need.


Slide 1 of 4
This PowerPoint template has been designed with bar chart and percentage values. You may download this PPT slide to depict statistical analysis. Add this slide to your presentation and impress your superiors.


Slide 1 of 4
This business slide contains graphics of test tubes. This diagram helps to display statistical analysis for business. Visual effect this slide helps in maintaining the flow of the discussion and provides more clarity to the subject.


Slide 1 of 3
This slide focuses on the data analytics cost structure which covers different phases and costing incurred by each team member. Presenting you an exemplary Statistical Evaluation Of Research Discovery Statistical Analysis Cost Structure One Pager Sample Example Document. Our one pager comprises all the must have essentials of an inclusive document. You can edit it with ease, as its layout is completely editable. With such freedom, you can tweak its design and other elements to your requirements. Download this Statistical Evaluation Of Research Discovery Statistical Analysis Cost Structure One Pager Sample Example Document brilliant piece now.


Slide 1 of 3
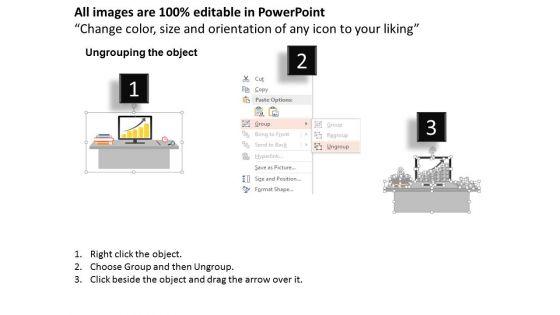
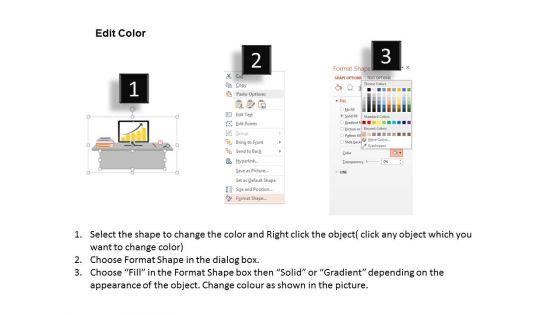
Our above PPT slide contains computer screen on a desk displaying bar graph. This PowerPoint template may be used to display statistical analysis. This template is designed to attract the attention of your audience.


Slide 1 of 3
This PowerPoint template has been designed with bar graph. This PowerPoint diagram is useful to exhibit yearly statistical analysis. This diagram slide can be used to make impressive presentations.


Slide 1 of 3
Download this exclusive business diagram to display statistical analysis. This PowerPoint template contains bar chart with percentage values. This diagram is useful for business presentations.


Slide 1 of 3
Draw It Out On Our PPT Slide statistical analysis with parallel arrows business diagrams Powerpoint Templates. Provide Inspiration To Your Colleagues. Motivate The Disheartened With Our Business Plan Powerpoint Templates. Inspire Them With The Goodness In You.


Slide 1 of 3
Our quantitative data analysis 3d pie chart for business statistics Powerpoint Templates Allow You To Do It With Ease. Just Like Picking The Low Hanging Fruit.


Slide 1 of 3
Land The Idea With Our quantitative data analysis 3d interpretation of statistical quality control Powerpoint Templates . Help It Grow With Your Thoughts.


Slide 1 of 3
Our marketing data analysis 3d statistical quality control chart Powerpoint Templates Abhor Doodling. They Never Let The Interest Flag.


Slide 1 of 3
Open Up Doors That Lead To Success. Our marketing data analysis 3d statistical process control chart Powerpoint Templates Provide The Handles.


Slide 1 of 3
Be A Donor Of Great Ideas. Display Your Charity On Our marketing data analysis 3d statistical process column chart Powerpoint Templates .


Slide 1 of 3
Financial Data Analysis Driven Demonstrate Statistics With Scatter Chart PowerPoint Slides Templates
Establish The Dominance Of Your Ideas. Our financial data analysis driven demonstrate statistics with scatter chart powerpoint slides Templates Will Put Them On Top.
SHOW
- 60
- 120
- 180
DISPLAYING: 60 of 236 Item(s)
Page
