AI PPT Maker
Templates
PPT Bundles
Design Services
Business PPTs
Business Plan
Management
Strategy
Introduction PPT
Roadmap
Self Introduction
Timelines
Process
Marketing
Agenda
Technology
Medical
Startup Business Plan
Cyber Security
Dashboards
SWOT
Proposals
Education
Pitch Deck
Digital Marketing
KPIs
Project Management
Product Management
Artificial Intelligence
Target Market
Communication
Supply Chain
Google Slides
Research Services
 One Pagers
All Categories
Showing Analytics PowerPoint Presentation Templates and Google Slides
SHOW
- 60
- 120
- 180
DISPLAYING: 60 of 90 Item(s)
Page


Slide 1 of 7
This is a marketing analytical tools diagram powerpoint slide show. This is a four stage process. The stages in this process are buyer power, strategy, supplier power, setup.


Slide 1 of 7
This is a customer journey analytics and data ppt powerpoint show. This is a seven stage process. The stages in this process are use, receive, buy, select, maintain, research, need, customer journey analytics.


Slide 1 of 7
This is a financial research and analytics services ppt powerpoint show. This is a five stage process. The stages in this process are survey result, mystery shops audits, inbound customer contacts, social and traditional media, employee feedback, thoughtful synthesis, analytical integration, data integration.


Slide 1 of 6
This is a enterprise decision analytics ppt powerpoint presentation file show cpb. This is a four stage process. The stages in this process are enterprise decision analytics.
Slide 1 of 5
Presenting this set of slides with name big data analytics vector icon ppt powerpoint presentation layouts show. This is a three stage process. The stages in this process are marketing, management, measuring results. This is a completely editable PowerPoint presentation and is available for immediate download. Download now and impress your audience.
Slide 1 of 5
Presenting this set of slides with name visual analytics vector icon ppt powerpoint presentation visual aids show. This is a three stage process. The stages in this process are data visualization icon, research analysis, business focus. This is a completely editable PowerPoint presentation and is available for immediate download. Download now and impress your audience.
Slide 1 of 5
Presenting this set of slides with name business research and analytics vector icon ppt powerpoint presentation professional show. This is a three stage process. The stages in this process are data visualization icon, research analysis, business focus. This is a completely editable PowerPoint presentation and is available for immediate download. Download now and impress your audience.



Slide 1 of 5
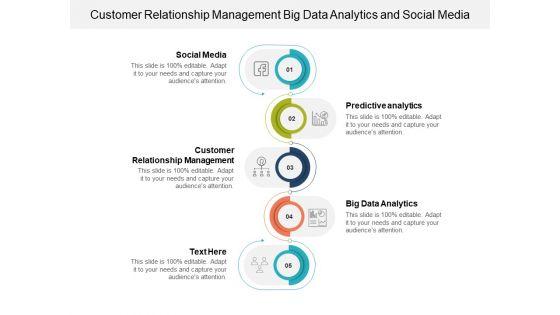
This is a customer relationship management big data analytics and social media ppt powerpoint presentation show ideas. This is a five stage process. The stages in this process are employee performance review, job evaluation, customer 360.


Slide 1 of 5
This is a demographic analytics ppt powerpoint presentation show visuals cpb. This is a five stage process. The stages in this process are demographic analytics.


Slide 1 of 5
This is a centre of excellence business analytical and it skills assessment ppt powerpoint presentation summary show. This is a three stage process. The stages in this process are competence center, integration center of excellence.


Slide 1 of 5
This is a portfolio risk performance analytics ppt powerpoint presentation file show cpb. This is a five stage process. The stages in this process are portfolio risk performance analytics.


Slide 1 of 5
This is a financial data analytics ppt powerpoint presentation show smartart cpb. This is a four stage process. The stages in this process are financial data analytics.


Slide 1 of 5
This is a benchmarking initiative business intelligence and analytics ppt powerpoint presentation show graphics pictures. This is a five stage process. The stages in this process are best practice, best technique, best procedure.
Slide 1 of 5
This is a visual analytics vector icon ppt powerpoint presentation infographics show. This is a three stage process. The stages in this process are data visualization icon, data management icon.


Slide 1 of 5
This is a stock trading advice news and analytics ppt powerpoint presentation show design inspiration. This is a three stage process. The stages in this process are stock market, financial market, bull market.


Slide 1 of 5
This is a business strategy framework monitoring analytics and reporting ppt powerpoint presentation show ideas. This is a four stage process. The stages in this process are digital strategy, digital plan, digital approach.


Slide 1 of 5
This is a marketing analytics examples ppt powerpoint presentation show guide. This is a ten stage process. The stages in this process are marketing analytics examples.


Slide 1 of 5
This is a predictive analytics customer retention ppt powerpoint presentation show format ideas cpb. This is a four stage process. The stages in this process are predictive analytics customer retention business, management, marketing.


Slide 1 of 5
This is a predictive analytics stages ppt powerpoint presentation layouts show. This is a five stage process. The stages in this process are stage, activating, analyzing, reporting, predicting.


Slide 1 of 5
This is a information technology in a supply chain analytical applications ppt powerpoint presentation show maker. This is a three stage process. The stages in this process are strategic, planning, operational, supplier apps.


Slide 1 of 5
This is a paid search analytics ppt powerpoint presentation show graphics tutorials. This is a four stage process. The stages in this process are impressions, clicks, conversions, budget.


Slide 1 of 5
This is a data analytics process ppt powerpoint presentation show example. This is a four stage process. The stages in this process are decision, insight, info, data, icons.


Slide 1 of 5
This is a paid search analytics ppt powerpoint presentation show slide. This is a two stage process. The stages in this process are budget, impressions, clicks, key stats, funnel.


Slide 1 of 5
This is a data analytics process ppt powerpoint presentation gallery show. This is a four stage process. The stages in this process are data, decision, insight, info, data analytics process.


Slide 1 of 5
This is a key driver analytics template 2 ppt powerpoint presentation show. This is a four stage process. The stages in this process are fact, business, strategy, management, marketing.


Slide 1 of 5
This is a website performance analytics ppt powerpoint presentation show. This is a three stage process. The stages in this process are conversion rate, visits, average visit value goal, return on investment ric, total visits, cost.


Slide 1 of 5
This is a big data analytics marketing impact ppt powerpoint presentation show. This is a four stage process. The stages in this process are healthcare, science, security, business.


Slide 1 of 3
Deliver an awe inspiring pitch with this creative Income Assessment Report Employees Analytics Dashboard Showing Low Salary Concerns Inspiration PDF bundle. Topics like Annual Salary, Total Bonus, Paid Employee can be discussed with this completely editable template. It is available for immediate download depending on the needs and requirements of the user.


Slide 1 of 2
This slide covers record of prospects visits and leads generated using different sources. It includes sources such as organic search, referrals, social media, email marketing, paid search, direct traffic, etc. along with total visits, conversion rates, contacts generated, customers count, conversion rates and graph depicting monthly visits using these sources. Showcasing this set of slides titled Inbound Leads Generation And Conversion Analytics Ppt Summary Show PDF. The topics addressed in these templates are Organic Search, Referrals, Social Media. All the content presented in this PPT design is completely editable. Download it and make adjustments in color, background, font etc. as per your unique business setting.


Slide 1 of 2
This slide shows the human resource metrics and its outcome during a year. This also highlights the issues faced by the company due to poor outcome obtained from these metrics. Deliver an awe inspiring pitch with this creative Income Assessment Document Employees Analytics Showing Low Salary Infographics PDF bundle. Topics like Metrics, Outcome, Employee can be discussed with this completely editable template. It is available for immediate download depending on the needs and requirements of the user.


Slide 1 of 2
This slide shows the human resource metrics and its outcome during a year. This also highlights the issues faced by the company due to poor outcome obtained from these metrics. Deliver an awe inspiring pitch with this creative Compensation Survey Sheet Employees Analytics Showing Low Salary Concerns Clipart PDF bundle. Topics like Metrics, Outcome, Average Managerial Salary can be discussed with this completely editable template. It is available for immediate download depending on the needs and requirements of the user.


Slide 1 of 2
This slide shows the digital marketing report showcasing social media analytics which provides metrics of Facebook, Twitter, Instagram and YouTube with actual, target and yet to target performance.Pitch your topic with ease and precision using this Online Marketing Report Showing Social Media Analytics Mockup PDF This layout presents information on Total Engagements, Marketing Report, Showing Analytics It is also available for immediate download and adjustment. So, changes can be made in the color, design, graphics or any other component to create a unique layout.


Slide 1 of 2
The purpose of this slide is to outline the various statistics of marketing analytics tool. The statistics are related to customer acquisition, customer retention, social media, segmentation, promotion strategy etc. Showcasing this set of slides titled Statistics Showing Impact Of Marketing Analytics Tool Background PDF. The topics addressed in these templates are Marketing, Organizations, Customers. All the content presented in this PPT design is completely editable. Download it and make adjustments in color, background, font etc. as per your unique business setting.


Slide 1 of 2
Mentioned slide outlines a comprehensive KPI dashboard highlighting web page results using XYZ analytics tool. The key performance indicators kpis mentioned in the slide are visits, page views, average visit duration, bounce rate, etc. Pitch your topic with ease and precision using this kpi dashboard showing web traffic results using analytical techniques inspiration pdf. This layout presents information on bounce rate, traffic sources, analytics. It is also available for immediate download and adjustment. So, changes can be made in the color, design, graphics or any other component to create a unique layout.


Slide 1 of 2
The following slide showcases a comprehensive analytical report highlighting the evolution of sales industry over the years. It provides information about sales cycle, state of the sales industry, etc. Showcasing this set of slides titled statistical analytics report showing evolution of sales industry diagrams pdf. The topics addressed in these templates are sales, technologies, system. All the content presented in this PPT design is completely editable. Download it and make adjustments in color, background, font etc. as per your unique business setting.


Slide 1 of 2
This slide shows DocSends real time analytics which includes visitors engagement. Deliver an awe inspiring pitch with this creative docsend capital fundraising real time analytics ppt styles show pdf bundle. Topics like real time analytics can be discussed with this completely editable template. It is available for immediate download depending on the needs and requirements of the user.


Slide 1 of 2
Deliver an awe inspiring pitch with this creative table of contents for data analytics business ppt show demonstration pdf bundle. Topics like business, data analytics, organization, implementation, dashboard can be discussed with this completely editable template. It is available for immediate download depending on the needs and requirements of the user.


Slide 1 of 2
This slide describes the data science in the logistic and transportation sector and how it will improve both sectors since both contain fragmented data. Deliver and pitch your topic in the best possible manner with this data analytics in logistics and transportation department ppt show slides pdf. Use them to share invaluable insights on performance, optimization, resource, productivity and impress your audience. This template can be altered and modified as per your expectations. So, grab it now.


Slide 1 of 2
This slide shows the roadmap to integrate data science in the business and what actions to be made at each stage after an interval of time. Presenting roadmap to integrate data analytics in the organization ppt show background images pdf to provide visual cues and insights. Share and navigate important information on four stages that need your due attention. This template can be used to pitch topics like data acquisition, analysis, data. In addtion, this PPT design contains high resolution images, graphics, etc, that are easily editable and available for immediate download.


Slide 1 of 2
This slide represents the data science application in business and its benefits, such as gaining customer insights, increased security, streamlining manufacturing, and predicting future market trends. This is a data analytics in business sector ppt show smartart pdf template with various stages. Focus and dispense information on five stages using this creative set, that comes with editable features. It contains large content boxes to add your information on topics like demographic, target, business services, management, financial. You can also showcase facts, figures, and other relevant content using this PPT layout. Grab it now.


Slide 1 of 2
This is a agenda for data analytics ppt show infographics pdf template with various stages. Focus and dispense information on four stages using this creative set, that comes with editable features. It contains large content boxes to add your information on topics like organization, implement data. You can also showcase facts, figures, and other relevant content using this PPT layout. Grab it now.


Slide 1 of 2
This slide shows the healthcare dashboard that presents analytical data such as occupancy, patient turnover, efficiency and costs, satisfaction and service indicators. Deliver an awe inspiring pitch with this creative iot digital twin technology post covid expenditure management healthcare dashboard showing analytical data brochure pdf bundle. Topics like service, indicators, cost, appointments, turnover can be discussed with this completely editable template. It is available for immediate download depending on the needs and requirements of the user.


Slide 1 of 2
This slide shows the healthcare dashboard that presents analytical data such as occupancy, patient turnover, efficiency and costs, satisfaction and service indicators. Deliver and pitch your topic in the best possible manner with this iot and digital twin to reduce costs post covid healthcare dashboard showing analytical data elements pdf. Use them to share invaluable insights on occupancy, patient turnover, efficiency and costs, satisfaction and service indicators and impress your audience. This template can be altered and modified as per your expectations. So, grab it now.


Slide 1 of 2
Presenting key marketing functional issues in big data analytics ppt powerpoint presentation show aids pdf to dispense important information. This template comprises three stages. It also presents valuable insights into the topics including data compilation and processing, aggregation and analysis, data allocation and application. This is a completely customizable PowerPoint theme that can be put to use immediately. So, download it and address the topic impactfully.
Slide 1 of 2
Persuade your audience using this data consumption analytics report vector icon ppt powerpoint presentation gallery show pdf. This PPT design covers three stages, thus making it a great tool to use. It also caters to a variety of topics including data consumption analytics report vector icon. Download this PPT design now to present a convincing pitch that not only emphasizes the topic but also showcases your presentation skills.
Slide 1 of 2
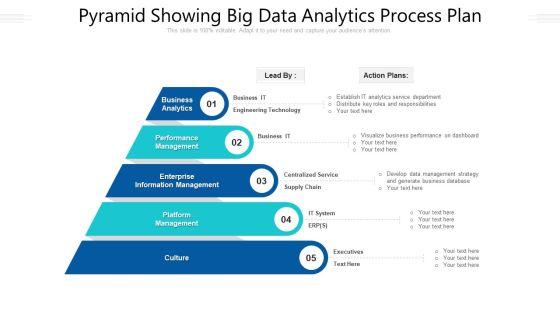
Presenting pyramid showing big data analytics process plan ppt powerpoint presentation file ideas pdf to dispense important information. This template comprises five stages. It also presents valuable insights into the topics including culture, management, performance. This is a completely customizable PowerPoint theme that can be put to use immediately. So, download it and address the topic impactfully.


Slide 1 of 2
Deliver an awe-inspiring pitch with this creative business data analytics report with lead to opportunity ratio ppt styles show pdf bundle. Topics like lead conversion ratio, sales team executives, average deal size can be discussed with this completely editable template. It is available for immediate download depending on the needs and requirements of the user.


Slide 1 of 2
The slide provides a case study of oil and gas company that wants to use a new analytical solution to track and analyse its oil and gas data. The case includes the challenge major point of concern, the solution key points to solve the issue, and the result outcome of the process. Deliver an awe inspiring pitch with this creative case study of using analytical solution to monitor gas data ppt show gridlines pdf bundle. Topics like solution, results, case study of using analytical solution to monitor gas data can be discussed with this completely editable template. It is available for immediate download depending on the needs and requirements of the user.
Slide 1 of 2
Presenting new business performance analytics vector icon ppt powerpoint presentation gallery show pdf to dispense important information. This template comprises three stages. It also presents valuable insights into the topics including new business performance analytics vector icon. This is a completely customizable PowerPoint theme that can be put to use immediately. So, download it and address the topic impactfully.


Slide 1 of 2
Pitch your topic with ease and precision using this chart showing business issues in big data analytics diagrams pdf. This layout presents information on data complexity, data volumes, performance, skills. It is also available for immediate download and adjustment. So, changes can be made in the color, design, graphics or any other component to create a unique layout.


Slide 1 of 2
Pitch your topic with ease and precision using this advanced analytics system report with key features ppt powerpoint presentation show vector pdf. This layout presents information on service call reporting, deployment, your budget. It is also available for immediate download and adjustment. So, changes can be made in the color, design, graphics or any other component to create a unique layout.


Slide 1 of 2
Showcasing this set of slides titled hr analytics report showing employee metrics ppt powerpoint presentation file backgrounds pdf. The topics addressed in these templates are gender distribution, female, male, ethnicity distribution. All the content presented in this PPT design is completely editable. Download it and make adjustments in color, background, font etc. as per your unique business setting.
Slide 1 of 2
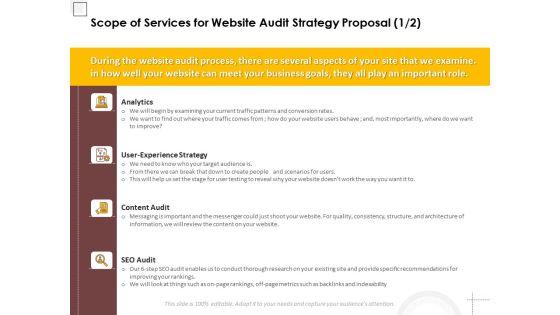
Deliver and pitch your topic in the best possible manner with this scope of services for website audit strategy proposal analytics ppt powerpoint presentation show influencers pdf. Use them to share invaluable insights on analytics, user experience strategy, content audit, seo audit and impress your audience. This template can be altered and modified as per your expectations. So, grab it now.


Slide 1 of 2
Presenting scope of services for site analytic and audit proposal email ppt show examples pdf to provide visual cues and insights. Share and navigate important information on five stages that need your due attention. This template can be used to pitch topics like social media strategy, email, branding, technology, governance. In addtion, this PPT design contains high resolution images, graphics, etc, that are easily editable and available for immediate download.


Slide 1 of 2
Presenting our offerings site analytic and audit proposal cont ppt show deck pdf to provide visual cues and insights. Share and navigate important information on two stages that need your due attention. This template can be used to pitch topics like ux analysis, optional seo report. In addtion, this PPT design contains high resolution images, graphics, etc, that are easily editable and available for immediate download.


Slide 1 of 2
Deliver and pitch your topic in the best possible manner with this it infrastructure governance performance scoring and analytics ppt show summary pdf. Use them to share invaluable insights on processes, skills, structure, services, technology, vendors, information, business and impress your audience. This template can be altered and modified as per your expectations. So, grab it now.


Slide 1 of 2
Presenting transforming big data analytics to knowledge content ppt show good pdf to provide visual cues and insights. Share and navigate important information on eight stages that need your due attention. This template can be used to pitch topics like techniques, implementation, organization, analyzing, roadmap. In addtion, this PPT design contains high resolution images, graphics, etc, that are easily editable and available for immediate download.
Slide 1 of 2
Presenting dashboard showing business analytics vector icon ppt powerpoint presentation model templates pdf to dispense important information. This template comprises three stages. It also presents valuable insights into the topics including dashboard showing business analytics vector icon. This is a completely customizable PowerPoint theme that can be put to use immediately. So, download it and address the topic impactfully.


Slide 1 of 2
Persuade your audience using this industrial data center with logistics analytics ppt powerpoint presentation show slideshow pdf. This PPT design covers six stages, thus making it a great tool to use. It also caters to a variety of topics including erp manufacturing, finance, human resources, analytics, logistics, e commerce. Download this PPT design now to present a convincing pitch that not only emphasizes the topic but also showcases your presentation skills
Slide 1 of 2
Presenting sales analytics for forecasting and planning icon ppt powerpoint presentation show pdf to dispense important information. This template comprises three stages. It also presents valuable insights into the topics including sales analytics for forecasting and planning icon. This is a completely customizable PowerPoint theme that can be put to use immediately. So, download it and address the topic impactfully.
SHOW
- 60
- 120
- 180
DISPLAYING: 60 of 90 Item(s)
Page
