 AI PPT Maker
 Templates
 PPT Bundles
 Design Services
 Business PPTs
 Business Plan
 Management
 Strategy
 Introduction PPT
 Roadmap
 Self Introduction
 Timelines
 Process
 Marketing
 Agenda
 Technology
 Medical
 Startup Business Plan
 Cyber Security
 Dashboards
 SWOT
SWOT Proposals
 Education
 Pitch Deck
 Digital Marketing
 KPIs
KPIs Project Management
 Product Management
 Artificial Intelligence
 Target Market
 Communication
 Supply Chain
 Google Slides
 Research Services
 One Pagers
 All Categories
Sales Kpi Dashboard PowerPoint Presentation Templates and Google Slides
SHOW
- 60
- 120
- 180
DISPLAYING: 60 of 134 Item(s)
Page


This slide shows dashboard which can be used by organizations to measure the results of sales plan. It includes metrics such as sales per product, actual vs target sales, sales by region, sales by channel, etc. Boost your pitch with our creative Boosting Yearly Business Revenue KPI Dashboard To Track Sales Plan Performance Topics PDF. Deliver an awe-inspiring pitch that will mesmerize everyone. Using these presentation templates you will surely catch everyones attention. You can browse the ppts collection on our website. We have researchers who are experts at creating the right content for the templates. So you dont have to invest time in any additional work. Just grab the template now and use them.


Mentioned slide shows the KPI dashboard that can be used to track win and lost sales opportunities. It includes metrics namely won opportunities, lost opportunities, pipeline by territory, total opportunities. Get a simple yet stunning designed Strategic Plan To Establish And Promote Brand Awareness Kpi Dashboard To Monitor Sales Opportunities Background PDF. It is the best one to establish the tone in your meetings. It is an excellent way to make your presentations highly effective. So, download this PPT today from Slidegeeks and see the positive impacts. Our easy to edit Strategic Plan To Establish And Promote Brand Awareness Kpi Dashboard To Monitor Sales Opportunities Background PDF can be your go to option for all upcoming conferences and meetings. So, what are you waiting for Grab this template today.


The following slide highlights some key performance indicators KPIs to measure the influence of executing sales risk management strategies on revenue performance. It includes elements such as target attainment rate, gross profit, annual growth rate etc. Presenting this PowerPoint presentation, titled Assessing Impact Of Sales Risk Management With KPI Dashboard Ideas PDF, with topics curated by our researchers after extensive research. This editable presentation is available for immediate download and provides attractive features when used. Download now and captivate your audience. Presenting this Assessing Impact Of Sales Risk Management With KPI Dashboard Ideas PDF. Our researchers have carefully researched and created these slides with all aspects taken into consideration. This is a completely customizable Assessing Impact Of Sales Risk Management With KPI Dashboard Ideas PDF that is available for immediate downloading. Download now and make an impact on your audience. Highlight the attractive features available with our PPTs.


This slide showcases KPI dashboard which can help sales team managers display and review performance rankings. It provides details about weekly sales score, target percentage, total target, sales team members, etc. Unleash your creativity with our How Leaders Can Improve Team Effectiveness Sales Team Performance Management KPI Dashboard Infographics PDF single-slide PPT template. Whether you are a seasoned presenter or a newbie, our editable and visually-stunning template will make your presentations shine. This template is versatile and easy to use. Make your presentations unforgettable with our premium template and leave a lasting impression on your audience.
Following slide demonstrates key performance indicator dashboard for tracking monthly sales to monitor business performance. It includes components such as monthly execution cost, sales, state wise events, Brand market, and programs. Showcasing this set of slides titled Monthly Sales KPI Dashboard For Tracking Brand Recommendation Progress Background PDF. The topics addressed in these templates are Products Sold, Engagements, Events, Active Markets, Sampled, Attendance. All the content presented in this PPT design is completely editable. Download it and make adjustments in color, background, font etc. as per your unique business setting.


Following slide demonstrates KPI dashboard to monitor performance of sales executives to determine best performing employee. It includes key components such as monthly performance, targets achieved, sales by executives, lead funnel, total daily and monthly profits. Pitch your topic with ease and precision using this KPI Dashboard To Monitor Operational Sales Executive Performance Portrait PDF. This layout presents information on Revenue, Profit, Sales, Customers. It is also available for immediate download and adjustment. So, changes can be made in the color, design, graphics or any other component to create a unique layout.


The purpose of this slide is to showcase metrics dashboard which can be used to effectively monitor the sales of SaaS company. The metrics covered in the slide are total sales, average impressions, average CTR, impressions breakdown, etc. Showcasing this set of slides titled KPI Dashboard To Measure Sales Performance Of Saas Company Summary PDF. The topics addressed in these templates are Total Sales, Average Sale, Count Of Sales, Average Impressions, Average Ctr. All the content presented in this PPT design is completely editable. Download it and make adjustments in color, background, font etc. as per your unique business setting.
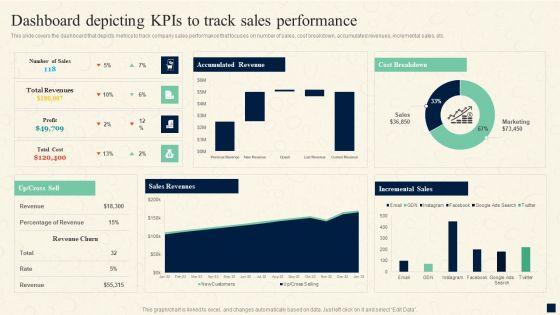
This slide covers the dashboard that depicts metrics to track company sales performance that focuses on number of sales, cost breakdown, accumulated revenues, incremental sales, etc. From laying roadmaps to briefing everything in detail, our templates are perfect for you. You can set the stage with your presentation slides. All you have to do is download these easy-to-edit and customizable templates. Change Management Process Dashboard Depicting Kpis To Track Sales Performance Introduction PDF will help you deliver an outstanding performance that everyone would remember and praise you for. Do download this presentation today.

This slide covers the dashboard that depicts metrics to track company sales performance that focuses on number of sales, cost breakdown, accumulated revenues, incremental sales, etc. Are you in need of a template that can accommodate all of your creative concepts This one is crafted professionally and can be altered to fit any style. Use it with Google Slides or PowerPoint. Include striking photographs, symbols, depictions, and other visuals. Fill, move around, or remove text boxes as desired. Test out color palettes and font mixtures. Edit and save your work, or work with colleagues. Download Digital Transition Plan For Managing Business Dashboard Depicting Kpis To Track Sales Performance Guidelines PDF and observe how to make your presentation outstanding. Give an impeccable presentation to your group and make your presentation unforgettable.


This slide brings forth and e commerce KPI dashboard to track the process of placed orders and sales during the month. The key performing indicators are total sales, net sales, sales break down, total orders, item sold, etc. Showcasing this set of slides titled E Commerce KPI Dashboard To Track Order Request And Sales Introduction PDF. The topics addressed in these templates are Total Sales, Net Sales, Sales Break Down. All the content presented in this PPT design is completely editable. Download it and make adjustments in color, background, font etc. as per your unique business setting.


This slide provides glimpse about dashboard analysis that can help the business to track the performance of the sales team. It includes KPIs such as sales, sales target, target achievement, sales last year, sales by channel, etc. Explore a selection of the finest Planning Sales Campaign To Improve Measure Sales Performance With Kpi Dashboard Topics PDF here. With a plethora of professionally designed and pre-made slide templates, you can quickly and easily find the right one for your upcoming presentation. You can use our Planning Sales Campaign To Improve Measure Sales Performance With Kpi Dashboard Topics PDF to effectively convey your message to a wider audience. Slidegeeks has done a lot of research before preparing these presentation templates. The content can be personalized and the slides are highly editable. Grab templates today from Slidegeeks.


Planning Sales Campaign To Improve KPI Dashboard To Analyze New Strategic Sales Plan Information PDF
This slide showcases the KPIs that would help a business organization to evaluate improvements in the new strategic sales plan. It includes KPIs such as market share by region, plan sales vs. actual sales by month, gross margin by region, etc. Welcome to our selection of the Planning Sales Campaign To Improve KPI Dashboard To Analyze New Strategic Sales Plan Information PDF. These are designed to help you showcase your creativity and bring your sphere to life. Planning and Innovation are essential for any business that is just starting out. This collection contains the designs that you need for your everyday presentations. All of our PowerPoints are 100 percent editable, so you can customize them to suit your needs. This multi-purpose template can be used in various situations. Grab these presentation templates today.


This slide showcases support service dashboard to track relevant performance metrics. Major KPIs covered are customer satisfaction, average time to resolve problem, cost per support, customer retention, request volume, etc. Slidegeeks is here to make your presentations a breeze with Enhance Customer Engagement Through After Sales Activities Customer Service Dashboard To Monitor Kpis Introduction PDF With our easy to use and customizable templates, you can focus on delivering your ideas rather than worrying about formatting. With a variety of designs to choose from, you are sure to find one that suits your needs. And with animations and unique photos, illustrations, and fonts, you can make your presentation pop. So whether you are giving a sales pitch or presenting to the board, make sure to check out Slidegeeks first.


Mentioned slide shows the KPI dashboard that can be used to track win and lost sales opportunities. It includes metrics namely won opportunities, lost opportunities, pipeline by territory, total opportunities. Are you searching for a Comprehensive Guide To Enhance Kpi Dashboard To Monitor Sales Opportunities Information PDF that is uncluttered, straightforward, and original Its easy to edit, and you can change the colors to suit your personal or business branding. For a presentation that expresses how much effort youve put in, this template is ideal With all of its features, including tables, diagrams, statistics, and lists, its perfect for a business plan presentation. Make your ideas more appealing with these professional slides. Download Comprehensive Guide To Enhance Kpi Dashboard To Monitor Sales Opportunities Information PDF from Slidegeeks today.


This slide covers the dashboard that depicts metrics to track company sales performance that focuses on number of sales, cost breakdown, accumulated revenues, incremental sales, etc. From laying roadmaps to briefing everything in detail, our templates are perfect for you. You can set the stage with your presentation slides. All you have to do is download these easy-to-edit and customizable templates. Transition Plan For Business Management Dashboard Depicting Kpis To Track Sales Performance Template PDF will help you deliver an outstanding performance that everyone would remember and praise you for. Do download this presentation today.


The following slide highlights some key performance indicators KPIs to measure the influence of executing sales risk management strategies on revenue performance. It includes elements such as target attainment rate, gross profit, annual growth rate etc. Find a pre designed and impeccable Sales Risk Assessment For Profit Maximization Assessing Impact Of Sales Risk Management With Kpi Dashboard Inspiration PDF. The templates can ace your presentation without additional effort. You can download these easy to edit presentation templates to make your presentation stand out from others. So, what are you waiting for Download the template from Slidegeeks today and give a unique touch to your presentation.


Following slide displays sales and orders performance monitoring dashboard. Key performance indicators covered in the slide are return reasons, perfect order rate, total orders, top seller by orders. Crafting an eye-catching presentation has never been more straightforward. Let your presentation shine with this tasteful yet straightforward Strategic Guide For Positioning Expanded Brand KPI Dashboard To Monitor Sales And Orders Performance Diagrams PDF template. It offers a minimalistic and classy look that is great for making a statement. The colors have been employed intelligently to add a bit of playfulness while still remaining professional. Construct the ideal Strategic Guide For Positioning Expanded Brand KPI Dashboard To Monitor Sales And Orders Performance Diagrams PDF that effortlessly grabs the attention of your audience Begin now and be certain to wow your customers.


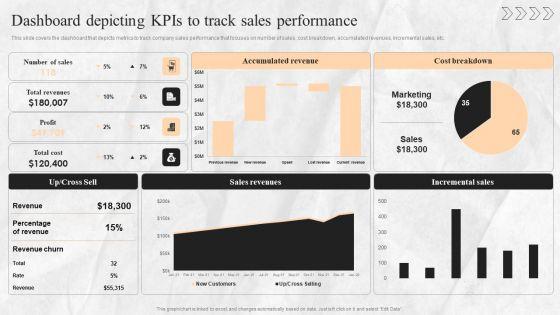
This slide covers the dashboard that depicts metrics to track company sales performance that focuses on number of sales, cost breakdown, accumulated revenues, incremental sales, etc.If you are looking for a format to display your unique thoughts, then the professionally designed Dashboard Depicting Kpis To Track Sales Performance Integrating Technology To Transform Change Portrait PDF is the one for you. You can use it as a Google Slides template or a PowerPoint template. Incorporate impressive visuals, symbols, images, and other charts. Modify or reorganize the text boxes as you desire. Experiment with shade schemes and font pairings. Alter, share or cooperate with other people on your work. Download Dashboard Depicting Kpis To Track Sales Performance Integrating Technology To Transform Change Portrait PDF and find out how to give a successful presentation. Present a perfect display to your team and make your presentation unforgettable.


This slide shows KPI dashboard which can be used by organizations to monitor sales performance of various channels. It includes various metrics such as total revenue, total profit, monthly sales revenue, cost breakup, etc. Showcasing this set of slides titled KPI Dashboard To Track Corporate Sales From Various Channels Information PDF. The topics addressed in these templates are Track Corporate Sales, Various Channels. All the content presented in this PPT design is completely editable. Download it and make adjustments in color, background, font etc. as per your unique business setting.


Pitch your topic with ease and precision using this KPI Dashboard To Track Corporate Sales From Various Channels Inspiration PDF. This layout presents information on Track Corporate Sales, Various Channels. It is also available for immediate download and adjustment. So, changes can be made in the color, design, graphics or any other component to create a unique layout.


This slide contains KPI dashboard which can be used by company to track e-commerce sales. It includes kpis such as total orders, order quantity, sales quantity, sales by location, etc. Pitch your topic with ease and precision using this KPI Dashboard To Evaluate Corporate Sales Introduction PDF. This layout presents information on KPI Dashboard, Evaluate Corporate Sales. It is also available for immediate download and adjustment. So, changes can be made in the color, design, graphics or any other component to create a unique layout.


This slide covers the dashboard that depicts metrics to track company sales performance that focuses on number of sales, cost breakdown, accumulated revenues, incremental sales, etc. From laying roadmaps to briefing everything in detail, our templates are perfect for you. You can set the stage with your presentation slides. All you have to do is download these easy-to-edit and customizable templates. Change Management Strategy Dashboard Depicting Kpis To Track Sales Performance Ideas PDF will help you deliver an outstanding performance that everyone would remember and praise you for. Do download this presentation today.


Following slide displays sales and orders performance monitoring dashboard. Key performance indicators covered in the slide are return reasons, perfect order rate, total orders, top seller by orders. Do you have an important presentation coming up Are you looking for something that will make your presentation stand out from the rest Look no further than Guide For Brand Kpi Dashboard To Monitor Sales And Orders Performance Brochure PDF. With our professional designs, you can trust that your presentation will pop and make delivering it a smooth process. And with Slidegeeks, you can trust that your presentation will be unique and memorable. So why wait Grab Guide For Brand Kpi Dashboard To Monitor Sales And Orders Performance Brochure PDF today and make your presentation stand out from the rest.


This slide depicts a dashboard to track the key performance metrics in sales and operations process of a manufacturing enterprise to analyze deviations in the actual and planned output. The key performing indicators are percentage deviation, dollar deviation, inventory in hand etc.Pitch your topic with ease and precision using this KPI Dashboard To Track Sales And Operations Process Of Manufacturing Enterprise Brochure PDF. This layout presents information on Planned Output, Yearly Growth, Inventory Hand. It is also available for immediate download and adjustment. So, changes can be made in the color, design, graphics or any other component to create a unique layout.


This slide depicts a dashboard for business managers to keep the track of performance order to cash process for effective decision making. The key elements are orders received, cash receivables, order to cash key performance indicators, days of inventory outstanding etc. Showcasing this set of slides titled KPI Dashboard To Track Performance Of Sales To Cash Process Download PDF. The topics addressed in these templates are Orders Received, Cash Receivables, Days Inventory Outstanding. All the content presented in this PPT design is completely editable. Download it and make adjustments in color, background, font etc. as per your unique business setting.


The following slide exhibits dashboard to maintain revenue and management under control. It presents information related to profits, cross selling, costs, etc. Pitch your topic with ease and precision using this Weekly Sales Performance KPI Dashboard For Revenue Generation Brochure PDF. This layout presents information on Total Sales, Revenue, Profit, Cost. It is also available for immediate download and adjustment. So, changes can be made in the color, design, graphics or any other component to create a unique layout.


Following slide displays sales and orders performance monitoring dashboard. Key performance indicators covered in the slide are return reasons, perfect order rate, total orders, top seller by orders. From laying roadmaps to briefing everything in detail, our templates are perfect for you. You can set the stage with your presentation slides. All you have to do is download these easy-to-edit and customizable templates. Tactical Brand Extension Launching Kpi Dashboard To Monitor Sales And Orders Formats PDF will help you deliver an outstanding performance that everyone would remember and praise you for. Do download this presentation today.


This slide signifies the KPIs dashboard on sales pipeline reporting. It includes business by companies, total amount invested in sales pipeline stages, sales type. Showcasing this set of slides titled KPI Dashboard To Measure Sales Funnel Reporting Template PDF. The topics addressed in these templates are Sales Pipeline, Companies Category, Sales Sold. All the content presented in this PPT design is completely editable. Download it and make adjustments in color, background, font etc. as per your unique business setting.


This slide represents the KPI dashboard to measure sales pipeline reporting for increasing customer conversion rate. It includes activity by representative, forecast by month and monthly growth. Pitch your topic with ease and precision using this KPI Dashboard To Evaluate Growth In Sales Funnel Reporting Topics PDF. This layout presents information on Pipeline Requirement, Key Activities, Pipeline Closed Date. It is also available for immediate download and adjustment. So, changes can be made in the color, design, graphics or any other component to create a unique layout.


This slide contains KPI dashboard which can be used by company to track online sales. It includes KPIs such as total orders, order quantity, sales quantity, sales by location, etc. Pitch your topic with ease and precision using this KPI Dashboard To Track Online Sales Structure PDF. This layout presents information on Net Profit, Sales, Orders Quantity. It is also available for immediate download and adjustment. So, changes can be made in the color, design, graphics or any other component to create a unique layout.


This slide shows the KPI dashboard of business sale through online. It includes KPIs such as new customers, average order value, conversion rate, revenue by location, etc. Showcasing this set of slides titled KPI Dashboard Of Online Business Sales Microsoft PDF. The topics addressed in these templates are Marketing Channels, Revenue, Location. All the content presented in this PPT design is completely editable. Download it and make adjustments in color, background, font etc. as per your unique business setting.


This slide covers a dashboard that organizations can use to track the paid social media plan results. The template provides information about key metrics such as social media status, engaged users, page impressions, page likes, etc. Here you can discover an assortment of the finest PowerPoint and Google Slides templates. With these templates, you can create presentations for a variety of purposes while simultaneously providing your audience with an eye catching visual experience. Download Paid Advertising Techniques To Enhance Business Sales KPI Dashboard To Track Paid Social Media Microsoft PDF to deliver an impeccable presentation. These templates will make your job of preparing presentations much quicker, yet still, maintain a high level of quality. Slidegeeks has experienced researchers who prepare these templates and write high quality content for you. Later on, you can personalize the content by editing the Paid Advertising Techniques To Enhance Business Sales KPI Dashboard To Track Paid Social Media Microsoft PDF.


This slide shows the KPI dashboard of client and product sales comparison. It also includes sales by location and total sales. Pitch your topic with ease and precision using this KPI Dashboard Of Customer And Product Sales Performance Comparison Information PDF. This layout presents information on Product Sales, Client Sales, Tim Santana. It is also available for immediate download and adjustment. So, changes can be made in the color, design, graphics or any other component to create a unique layout.
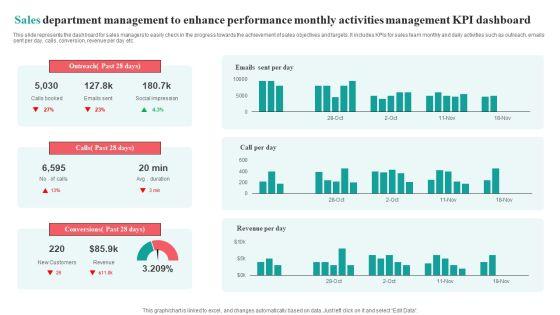

This slide represents the dashboard for sales managers to easily check in the progress towards the achievement of sales objectives and targets. It includes KPIs for sales team monthly and daily activities such as outreach, emails sent per day, calls, conversion, revenue per day etc.Pitch your topic with ease and precision using this Sales Department Management To Enhance Performance Monthly Activities Management KPI Dashboard Brochure PDF. This layout presents information on Social Impression, Conversions Past, Outreach Past. It is also available for immediate download and adjustment. So, changes can be made in the color, design, graphics or any other component to create a unique layout.


Mentioned slide shows the KPI dashboard that can be used to track win and lost sales opportunities. It includes metrics namely won opportunities, lost opportunities, pipeline by territory, total opportunities.Explore a selection of the finest Kpi Dashboard To Monitor Sales Opportunities Strategic Promotion Plan To Improve Product Diagrams PDF here. With a plethora of professionally designed and pre-made slide templates, you can quickly and easily find the right one for your upcoming presentation. You can use our Kpi Dashboard To Monitor Sales Opportunities Strategic Promotion Plan To Improve Product Diagrams PDF to effectively convey your message to a wider audience. Slidegeeks has done a lot of research before preparing these presentation templates. The content can be personalized and the slides are highly editable. Grab templates today from Slidegeeks.


Following slide showcases performance KPI dashboard used to measure the ecommerce marketing project results. The Key performance indicators mentioned in the slide are new customers, repeat purchase rate, average order value, conversion rate, etc. Pitch your topic with ease and precision using this KPI Dashboard To Measure Ecommerce Sales And Marketing Project Performance Portrait PDF. This layout presents information on Purchase Rate, Average Order Value, Ecommerce Conversion Rate. It is also available for immediate download and adjustment. So, changes can be made in the color, design, graphics or any other component to create a unique layout.


Following slide showcases performance KPI dashboard used to evaluate marketing project campaign results. The dashboard provides overview of key metrics such as total revenue, marketing spend, profit and cost per acquisition, leads etc. Showcasing this set of slides titled KPI Dashboard Showing Results Of Sales And Marketing Project Campaign Formats PDF. The topics addressed in these templates are Marketing Spend, Revenue, Profit Per Acquisition. All the content presented in this PPT design is completely editable. Download it and make adjustments in color, background, font etc. as per your unique business setting.


This slide shows the key performance indicators dashboard which can be used to analyze current financial position of cosmetic business. It includes metrics such as sales, expenses, profit, cash in hand, etc. Showcasing this set of slides titled KPI Dashboard To Track Beauty Care Products Sales Performance Ppt Outline Pictures PDF. The topics addressed in these templates are Sales Number, Total Sales, Total Profit, Cost. All the content presented in this PPT design is completely editable. Download it and make adjustments in color, background, font etc. as per your unique business setting.


This slide shows the key performance indicators dashboard which can be used to analyze current financial position of cosmetic business. It includes metrics such as sales, expenses, profit, cash in hand, etc. Showcasing this set of slides titled KPI Dashboard To Monitor Beauty Care Products Sales Performance Ppt Outline Example Topics PDF. The topics addressed in these templates are Accounts Receivable, Profit Margin, Expense. All the content presented in this PPT design is completely editable. Download it and make adjustments in color, background, font etc. as per your unique business setting.


This slide shows sales performance monitoring dashboard. Metrics included in the dashboard are sales revenue, sales growth, average revenue per unit, customer lifetime value and customer acquisition cost. This modern and well arranged Creating New Product Launch Campaign Strategy Kpi Dashboard To Monitor Sales Performance Introduction PDF provides lots of creative possibilities. It is very simple to customize and edit with the Powerpoint Software. Just drag and drop your pictures into the shapes. All facets of this template can be edited with Powerpoint no extra software is necessary. Add your own material, put your images in the places assigned for them, adjust the colors, and then you can show your slides to the world, with an animated slide included.


This slide portrays property management dashboard with KPIs namely, average days on market, properties for sale, properties for rent, sales vs. target and sales by region. Deliver and pitch your topic in the best possible manner with this Marketing Strategy To Enhance Real Estate Sales Property Management Kpi Dashboard Slides PDF. Use them to share invaluable insights on Average, Market, Sales and impress your audience. This template can be altered and modified as per your expectations. So, grab it now.


Mentioned slide showcases merchandising dashboard which can be used to analyze sales performance of various products. It covers metrics such as different types of product sold, revenue earned, payment methods used, sales in different years etc.Showcasing this set of slides titled Retail KPI Dashboard To Evaluate Merchandising Sales Plan Performance Rules PDF. The topics addressed in these templates are Clothing Apparel, Trend Merchandise, Items Sold. All the content presented in this PPT design is completely editable. Download it and make adjustments in color, background, font etc. as per your unique business setting.
SHOW
- 60
- 120
- 180
DISPLAYING: 60 of 134 Item(s)
Page