AI PPT Maker
Templates
PPT Bundles
Design Services
Business PPTs
Business Plan
Management
Strategy
Introduction PPT
Roadmap
Self Introduction
Timelines
Process
Marketing
Agenda
Technology
Medical
Startup Business Plan
Cyber Security
Dashboards
SWOT
Proposals
Education
Pitch Deck
Digital Marketing
KPIs
Project Management
Product Management
Artificial Intelligence
Target Market
Communication
Supply Chain
Google Slides
Research Services
One Pagers
All Categories
Sales Graph PowerPoint Presentation Templates and Google Slides
SHOW
- 60
- 120
- 180
DISPLAYING: 60 of 862 Item(s)
Page


Slide 1 of 20
This is a on demand software sales ppt powerpoint presentation inspiration graphics template. This is a one stage process. The stages in this process are business, planning, strategy, marketing, management.


Slide 1 of 11
Improve your presentation delivery using this Circle Graph Sales Ppt PowerPoint Presentation Complete Deck With Slides. Support your business vision and objectives using this well-structured PPT deck. This template offers a great starting point for delivering beautifully designed presentations on the topic of your choice. Comprising eleven this professionally designed template is all you need to host discussion and meetings with collaborators. Each slide is self-explanatory and equipped with high-quality graphics that can be adjusted to your needs. Therefore, you will face no difficulty in portraying your desired content using this PPT slideshow. This PowerPoint slideshow contains every important element that you need for a great pitch. It is not only editable but also available for immediate download and utilization. The color, font size, background, shapes everything can be modified to create your unique presentation layout. Therefore, download it now.


Slide 1 of 9
This is a saas coverage sales model ppt powerpoint presentation infographic template graphics template. This is a three stage process. The stages in this process are contract renewal, customer expansion, business, marketing.


Slide 1 of 7
This is a sales and marketing plan for revenue analysis powerpoint slide graphics. This is a three stage process. The stages in this process are online, advertising, market research, blog, website, mobile app, mobile alerts, online, print, outdoor, radio, television, surveys, impact studies.


Slide 1 of 7
This is a geographic segmentation for sales lead generation powerpoint slide graphics. This is a five stage process. The stages in this process are city, density, climate, counties, region.


Slide 1 of 7
This is a sales summary review chart with icons ppt background graphics. This is a four stage process. The stages in this process are business, presentation, analysis, process.


Slide 1 of 7
This is a partner sales cloud infographic chart powerpoint graphics. This is a six stage process. The stages in this process are news and events, marketing literature, sales tools, channel incentives, product promotions, deal registration.


Slide 1 of 7
This is a sales and marketing plan template powerpoint slides graphics. This is a six stage process. The stages in this process are sales process and strategy, market knowledge, science metrics, sales excellence and performance, sales skills, customer knowledge.


Slide 1 of 7
This is a marketing and sales coordination template powerpoint graphics. This is a five stage process. The stages in this process are marketing platform, prospecting platform, product orientation, sales platform, customer orientation.


Slide 1 of 7
This is a strategic sales plan template powerpoint graphics. This is a six stage process. The stages in this process are sales operation, earning, advertisement, progress, growth, sales planning.


Slide 1 of 7
This is a sales channel development template powerpoint slide graphics. This is a six stage process. The stages in this process are company strategy, trade interviews, strategy development, channel strategy, field audits, market landscape.


Slide 1 of 7
This is a sales management learning outcomes ppt powerpoint graphics. This is a five stage process. The stages in this process are analyze pipeline, review opportunity, diagnose, identify skill issue, identify opp issue, coach, coach skill issue, coach opp issue, update crm, follow up.


Slide 1 of 7
This is a sales process improvement diagram powerpoint graphics. This is a six stage process. The stages in this process are sign off, understand your specific needs, review, agree improvements, implement improvements, assess current competencies.


Slide 1 of 7
This is a wom marketing for loyal sales diagram powerpoint graphics. This is a seven stage process. The stages in this process are face to face, twitter, email, referral, your customer, facebook, linkedin.


Slide 1 of 7
This is a sales performance wheel diagram powerpoint graphics. This is a six stage process. The stages in this process are strategy and operations, accountability, motivation, staffing, capability, execution enablement.


Slide 1 of 7
This is a technical sales development presentation graphics. This is a seven stage process. The stages in this process are agent sales support, communications, year plan, contact actions, contact plan, contact strategy, identify customers.


Slide 1 of 7
This is a target audiences for sales promotion diagram presentation graphics. This is a three stage process. The stages in this process are trade promotion, sales promotion, sales force promotion, customer promotion.


Slide 1 of 7
This is a sales funnel stages powerpoint graphics. This is a six stage process. The stages in this process are awareness, discover, reach, act, convert, engage.


Slide 1 of 7
This is a consumer sales promotion strategy ppt presentation graphics. This is a eight stage process. The stages in this process are advertising specialties, price deals, sampling, premiums, contests, game, cross promotions, rebates, coupons.\n\n\n


Slide 1 of 7
This is a sales funnel graphic template ppt info graphics. This is a four stage process. The stages in this process are suspects, prospects, customers, leads.


Slide 1 of 7
This is a conversion in sales analysis ppt powerpoint graphics. This is a five stage process. The stages in this process are aware, consider, convert, become loyal, advocate.


Slide 1 of 7
This is a merits of sales promotion strategy ppt presentation graphics. This is a one stage process. The stages in this process are rebate, discounts, refunds, gifts, quantity deal, samples, contest, instant draws, lucky draw, usable benefits, full finance, packaged premium, container premium, sales promotion techniques.


Slide 1 of 7
This is a sales team management diagram powerpoint graphics. This is a six stage process. The stages in this process are lead by example, teamwork, win, vision, mentor, motivate.


Slide 1 of 7
This is a Strategic Account Sales Skills Diagram Presentation Graphics. This is a five stage process. The stages in this process are strategy, research, action plan, execution, review.


Slide 1 of 7
This is a sales strategy services diagram powerpoint graphics. This is a six stage process. The stages in this process are sales management, sales talent management, sales force structure and size, account segmentation, lead generation, sales process.


Slide 1 of 7
This is a sales tool for monitoring presentation graphics. This is a four stage process. The stages in this process are customer retention, lead generation, up to date information, salesforce integration.


Slide 1 of 7
This is a sales account plan diagram presentation graphics. This is a six stage process. The stages in this process are mission, strategy, competition analysis, timeline, marketing plan, swot analysis, business plan.


Slide 1 of 7
This is a sales funnel model new diagram presentation graphics. This is a six stage process. The stages in this process are awareness, consideration, purchase, interest, evaluation, intent.


Slide 1 of 7
This is a sales forecasting templates powerpoint graphics. This is a six stage process. The stages in this process are setting goals for forecasting, gathering data, analysis of data, evaluation of forecasting outcomes, forecasting, choosing the best model for forecasting.


Slide 1 of 7
This is a sales cycle stages ppt presentation graphics. This is a seven stage process. The stages in this process are follow up, closing, handling objections, presentation, approach, planning and preparation, prospecting.


Slide 1 of 7
This is a sales graph template presentation background images. This is a five stage process. The stages in this process are pre purchase, awareness, interest, consideration, decision.


Slide 1 of 6
Presenting this set of slides with name sales planning forecasting ppt powerpoint presentation ideas graphic tips cpb. This is an editable Powerpoint six stages graphic that deals with topics like sales planning forecasting to help convey your message better graphically. This product is a premium product available for immediate download and is 100 percent editable in Powerpoint. Download this now and use it in your presentations to impress your audience.


Slide 1 of 6
Presenting this set of slides with name actual vs target sales slide financial ppt powerpoint presentation outline graphics tutorials. The topics discussed in these slides are marketing, business, management, planning, strategy. This is a completely editable PowerPoint presentation and is available for immediate download. Download now and impress your audience.


Slide 1 of 6
Presenting this set of slides with name sales performance by product ppt powerpoint presentation outline graphics download. The topics discussed in these slides are finance, marketing, management, investment, analysis. This is a completely editable PowerPoint presentation and is available for immediate download. Download now and impress your audience.


Slide 1 of 6
This is a retail sales by product category ppt powerpoint presentation layouts graphics download. This is a ten stage process. The stages in this process are finance, marketing, management, investment, analysis.


Slide 1 of 6
This is a retail kpi dashboard showing total sales per labor hour sales by unit area ppt powerpoint presentation show graphic tips. This is a three stage process. The stages in this process are finance, marketing, management, investment, analysis.


Slide 1 of 6
This is a four step to handle sales challenges ppt powerpoint presentation gallery graphics design. This is a four stage process. The stages in this process are overcoming objections, upcoming objections, objections management.


Slide 1 of 6
This is a seven steps in linear flow with icons sales strategies and financial projections ppt powerpoint presentation styles graphics example. This is a seven stage process. The stages in this process are 7 point infographic, 7 steps infographic, 7 stages infographic.


Slide 1 of 6
This is a emerging sales forecast product wise ppt powerpoint presentation pictures graphics template. This is a three stage process. The stages in this process are finance, marketing, management, investment, analysis.


Slide 1 of 6
This is a sales performance dashboard marketing ppt powerpoint presentation slides graphics design. This is a four stage process. The stages in this process are compare, marketing, business, management, planning.


Slide 1 of 6
This is a sales by category ppt powerpoint presentation ideas graphics design. This is a three stage process. The stages in this process are finance, analysis, business, investment, marketing.


Slide 1 of 6
This is a sales profitability dashboard income per item ppt powerpoint presentation professional graphic images. This is a five stage process. The stages in this process are business analytics, ba, organizations data.


Slide 1 of 6
This is a waterfall graph showing sales expenses revenue and taxes ppt powerpoint presentation pictures summary. This is a three stage process. The stages in this process are profit and loss, balance sheet, income statement, benefit and loss.


Slide 1 of 6
This is a waterfall graph showing net sales and gross profit ppt powerpoint presentation infographics format. This is a three stage process. The stages in this process are profit and loss, balance sheet, income statement, benefit and loss.


Slide 1 of 6
This is a sales graph showing payouts losses and wins ppt powerpoint presentation pictures designs download. This is a eight stage process. The stages in this process are sales waterfall, waterfall chart, business.


Slide 1 of 6
This is a graph showing increase and decrease in purchase and sales price ppt powerpoint presentation outline gallery. This is a nine stage process. The stages in this process are sales waterfall, waterfall chart, business.


Slide 1 of 6
This is a year by year sales revenue and unit profitability graph ppt powerpoint presentation show professional. This is a eight stage process. The stages in this process are business unit profitability, profitable organization, corporate unit profitability.


Slide 1 of 6
This is a area graph showing sales trends over time ppt powerpoint presentation model background designs. This is a three stage process. The stages in this process are financial analysis, quantitative, statistical modelling.


Slide 1 of 6
This is a improve sales performance and productivity ppt powerpoint presentation diagram graph charts. This is a four stage process. The stages in this process are marketing effort, branding initiative, marketing initiatives.


Slide 1 of 5
Presenting this set of slides with name sales management processes ppt powerpoint presentation inspiration graphics pictures cpb. This is an editable Powerpoint four stages graphic that deals with topics like sales management processes to help convey your message better graphically. This product is a premium product available for immediate download and is 100 percent editable in Powerpoint. Download this now and use it in your presentations to impress your audience.


Slide 1 of 5
Presenting this set of slides with name crm methods sales forecasting ppt powerpoint presentation slides graphics pictures cpb. This is an editable Powerpoint eight stages graphic that deals with topics like crm methods sales forecasting to help convey your message better graphically. This product is a premium product available for immediate download and is 100 percent editable in Powerpoint. Download this now and use it in your presentations to impress your audience.


Slide 1 of 5
Presenting this set of slides with name venn sales marketing ppt powerpoint presentation show graphic images. This is a four stage process. The stages in this process are venn, sale, marketing, planning, management. This is a completely editable PowerPoint presentation and is available for immediate download. Download now and impress your audience.


Slide 1 of 5
Presenting this set of slides with name increase ecommerce sales ppt powerpoint presentation portfolio graphic images cpb. This is an editable Powerpoint six stages graphic that deals with topics like increase ecommerce sales to help convey your message better graphically. This product is a premium product available for immediate download and is 100 percent editable in Powerpoint. Download this now and use it in your presentations to impress your audience.


Slide 1 of 5
Presenting this set of slides with name sales growth graph vector icon ppt powerpoint presentation ideas information. This is a three stage process. The stages in this process are revenue generation, business, strategies. This is a completely editable PowerPoint presentation and is available for immediate download. Download now and impress your audience.


Slide 1 of 5
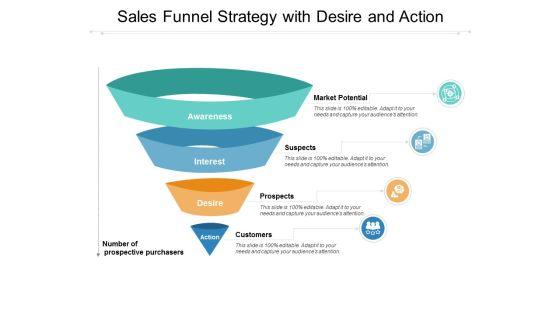
Presenting this set of slides with name sales funnel strategy with desire and action ppt powerpoint presentation infographics graphics example. This is a four stage process. The stages in this process are customer funnel, marketing funnel, consumer marketing. This is a completely editable PowerPoint presentation and is available for immediate download. Download now and impress your audience.


Slide 1 of 5
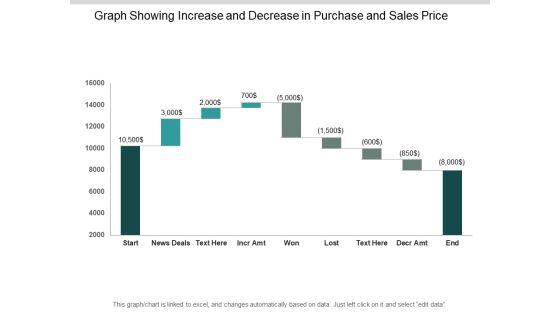
Presenting this set of slides with name graph showing sales performance figures ppt powerpoint presentation infographics topics. This is a six stage process. The stages in this process are people graph, sales performance, population data demographics. This is a completely editable PowerPoint presentation and is available for immediate download. Download now and impress your audience.


Slide 1 of 5
Presenting this set of slides with name sales growth graph vector icon ppt powerpoint presentation icon ideas. This is a one stage process. The stages in this process are industry trends, financial services, term business planning. This is a completely editable PowerPoint presentation and is available for immediate download. Download now and impress your audience.


Slide 1 of 5
Presenting this set of slides with name venn marketing sales ppt powerpoint presentation infographics graphics example. This is a four stage process. The stages in this process are venn, marketing, sales, management, marketing. This is a completely editable PowerPoint presentation and is available for immediate download. Download now and impress your audience.


Slide 1 of 5
Presenting this set of slides with name venn sales growth ppt powerpoint presentation slides graphic images. This is a four stage process. The stages in this process are venn, sale, marketing, planning, management. This is a completely editable PowerPoint presentation and is available for immediate download. Download now and impress your audience.


Slide 1 of 5
Presenting this set of slides with name venn sales review ppt powerpoint presentation slides graphics. This is a four stage process. The stages in this process are marketing, business, management, planning, strategy. This is a completely editable PowerPoint presentation and is available for immediate download. Download now and impress your audience.
SHOW
- 60
- 120
- 180
DISPLAYING: 60 of 862 Item(s)
Page