AI PPT Maker
Templates
PPT Bundles
Design Services
Business PPTs
Business Plan
Management
Strategy
Introduction PPT
Roadmap
Self Introduction
Timelines
Process
Marketing
Agenda
Technology
Medical
Startup Business Plan
Cyber Security
Dashboards
SWOT
Proposals
Education
Pitch Deck
Digital Marketing
KPIs
Project Management
Product Management
Artificial Intelligence
Target Market
Communication
Supply Chain
Google Slides
Research Services
One Pagers
All Categories
Sales Chart PowerPoint Presentation Templates and Google Slides
SHOW
- 60
- 120
- 180
DISPLAYING: 60 of 584 Item(s)
Page


Slide 1 of 12
Boost your confidence and team morale with this well-structured round organizational chart sales ppt powerpoint presentation complete deck with slides. This prefabricated set gives a voice to your presentation because of its well-researched content and graphics. Our experts have added all the components very carefully, thus helping you deliver great presentations with a single click. Not only that, it contains a set of twelve slides that are designed using the right visuals, graphics, etc. Various topics can be discussed, and effective brainstorming sessions can be conducted using the wide variety of slides added in this complete deck. Apart from this, our PPT design contains clear instructions to help you restructure your presentations and create multiple variations. The color, format, design anything can be modified as deemed fit by the user. Not only this, it is available for immediate download. So, grab it now.


Slide 1 of 12
Presenting this set of slides with name matrix org chart sales department ppt powerpoint presentation complete deck. The topics discussed in these slides are construction, management, employee, sales department, manufacturing. This is a completely editable PowerPoint presentation and is available for immediate download. Download now and impress your audience.


Slide 1 of 7
This is a sales timeline circular chart powerpoint slide deck. This is a six stage process. The stages in this process are process, analysis, management, marketing, business.


Slide 1 of 7
This is a sales and marketing plan gantt chart ppt examples slides. This is a three stage process. The stages in this process are sales goal, sales actual, banner ads, newspaper, in store marketing.


Slide 1 of 7
This is a sales and marketing planning chart powerpoint slide designs download. This is a three stage process. The stages in this process are sales goal, sales actual, national marketing, banner ads, local marketing, newspaper, in store marketing, pop, public relations, events, sponsorship, press releases, social media, twitter, facebook.


Slide 1 of 7
This is a yearly sales circular chart powerpoint shapes. This is a six stage process. The stages in this process are year, planning, business, process, success.


Slide 1 of 7
This is a sales steps arrow chart presentation background images. This is a five stage process. The stages in this process are awareness, consideration, purchase, service, loyalty.


Slide 1 of 7
This is a sales deal steps funnel chart ppt templates. This is a eight stage process. The stages in this process are discovery, pre qualification, qualification, solution design, evaluation, decision, negotiation, closed.


Slide 1 of 7
This is a quarterly sales review rainbow chart ppt slide templates. This is a four stage process. The stages in this process are year, arrow, icons, strategy, business.


Slide 1 of 7
This is a quarterly sales figures chart ppt slide templates. This is a four stage process. The stages in this process are total sales, business, management, marketing, success.


Slide 1 of 7
This is a sales summary review chart with icons ppt background graphics. This is a four stage process. The stages in this process are business, presentation, analysis, process.


Slide 1 of 7
This is a sales mapping funnel chart ppt background template. This is a six stage process. The stages in this process are funnel, process, marketing, strategy, sales.


Slide 1 of 7
This is a four steps total sales chart powerpoint slide design ideas. This is a four stage process. The stages in this process are total sales, marketing.


Slide 1 of 7
This is a five steps sales cycle chart powerpoint slide download. This is a five stage process. The stages in this process are consideration, service, loyalty, purchase, awareness.


Slide 1 of 7
This is a sales steps zigzag chart powerpoint slide. This is a five stage process. The stages in this process are awareness, purchase, loyalty, consideration, service.


Slide 1 of 7
This is a sales kpis funnel chart powerpoint slide background image. This is a one stage process. The stages in this process are campaigns to drive traffic, visitors, trials, closed deals, sales.


Slide 1 of 7
This is a quarterly sales arrows chart powerpoint slide backgrounds. This is a four stage process. The stages in this process are arrows, business, management, marketing, icons.


Slide 1 of 7
This is a partner sales cloud infographic chart powerpoint graphics. This is a six stage process. The stages in this process are news and events, marketing literature, sales tools, channel incentives, product promotions, deal registration.


Slide 1 of 7
This is a sales analysis chart powerpoint slides information. This is a four stage process. The stages in this process are loss, sales, profit, total expenses.


Slide 1 of 7
This is a business to business sales chart presentation images. This is a six stage process. The stages in this process are your business, marketing, reactive existing customers, culture, reach new customers, sales.


Slide 1 of 7
This is a sales performance wheel chart ppt examples professional. This is a ten stage process. The stages in this process are performance management, system and governance, supplier relationship management, result tracking and reporting, information technology, category plan development, trading partners relationship, organizational capabilities, business alignment, strategy and business process.


Slide 1 of 7
This is a sales conversion process chart powerpoint slide inspiration. This is a five stage process. The stages in this process are product validation, analytics, sales and launch, forensics, market validation.


Slide 1 of 7
This is a sales and trading example chart powerpoint slide influencers. This is a seven stage process. The stages in this process are supporting customer, experienced sales team, adding value, source liquidity, vision, tools, execution.


Slide 1 of 7
This is a total sales improvement strategies chart ppt sample. This is a six stage process. The stages in this process are grow the market, stimulate demand, customers, compliance, systems, minimizing costs.


Slide 1 of 7
This is a sales channel strategy chart powerpoint show. This is a four stage process. The stages in this process are channel integration, better offer, channel selection, more front of mind.


Slide 1 of 7
This is a sales conversion process chart powerpoint show. This is a six stage process. The stages in this process are invoicing, finance, sales, analysis, synthesis, knowledge.


Slide 1 of 7
This is a sales force automation template chart presentation layouts. This is a seven stage process. The stages in this process are sales force automation, very unsatisfied.


Slide 1 of 7
This is a retail sales performance chart example of ppt presentation. This is a four stage process. The stages in this process are operations, marketing, analytics and insights, merchandising, retail sales performance.


Slide 1 of 7
This is a sales coaching cycle chart ppt samples download. This is a five stage process. The stages in this process are assess needs identify agree coaching goals, pre meeting plan, observe, coaching session, follow up and review.


Slide 1 of 7
This is a tracking sales performance chart ppt example. This is a eight stage process. The stages in this process are efficiency, effectiveness, profits, cost per sale, roi, profit sale, convert to sale, cost contact, conversion, contacts.


Slide 1 of 7
This is a sales performance measures chart ppt sample. This is a three stage process. The stages in this process are product, relationship, service, sales.


Slide 1 of 7
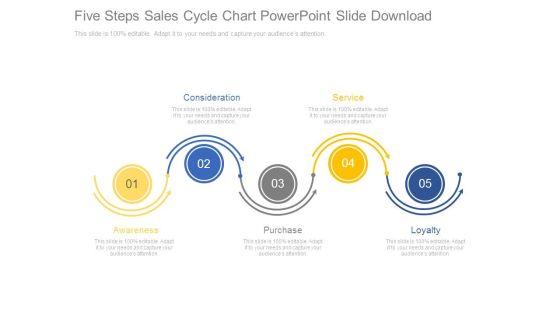
This is a sales improvement areas process flow chart diagram powerpoint layout. This is a seven stage process. The stages in this process are prospecting, contacting, presenting, needs analysis, objection handling and negation, closing, servicing and maintaining client relationship, up and cross selling.


Slide 1 of 7
This is a sales process map flow chart diagram powerpoint slide show. This is a seven stage process. The stages in this process are prospect, approach, interview, proposal, demonstration, negative, support.


Slide 1 of 7
This is a trade sales advertising pie chart diagram presentation ideas. This is a three stage process. The stages in this process are advertising, trade, consumer.


Slide 1 of 7
This is a sample of sales flow chart ppt powerpoint slide download. This is a eight stage process. The stages in this process are select product, decide on suggested product, review and confirm shopping car, confirm address information, print license, specify inventory fulfillment method, submit payment, answer survey questions.


Slide 1 of 7
This is a sales management hierarchy chart sample diagram powerpoint slide show. This is a seven stage process. The stages in this process are management role, operations role, finance role, marketing role, human resources role, sales role, technology role.


Slide 1 of 7
This is a sample sales cycle flow chart ppt infographics. This is a seven stage process. The stages in this process are fix it, feedback, ask customers, assess progress, set the improved product, make changes, improve it.


Slide 1 of 6
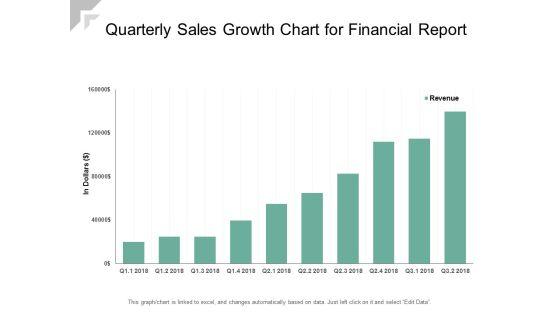
Presenting this set of slides with name quarterly sales growth chart for financial report ppt powerpoint presentation ideas infographics. The topics discussed in these slides are revenue trend, bar chart, financial. This is a completely editable PowerPoint presentation and is available for immediate download. Download now and impress your audience.


Slide 1 of 6
Presenting this set of slides with name bar chart showing quarterly business sales ppt powerpoint presentation model icon. The topics discussed in these slides are revenue trend, bar chart, financial. This is a completely editable PowerPoint presentation and is available for immediate download. Download now and impress your audience.


Slide 1 of 6
Presenting this set of slides with name bar chart for business sales analysis ppt powerpoint presentation styles icon. The topics discussed in these slides are education, growth, pencil bar graph. This is a completely editable PowerPoint presentation and is available for immediate download. Download now and impress your audience.


Slide 1 of 6
This is a two products sales comprising charts ppt powerpoint presentation portfolio files. The topics discussed in this diagram are product differentiation, product comparison, brand differentiation. This is a completely editable PowerPoint presentation, and is available for immediate download.


Slide 1 of 6
This is a waterfall chart with sales overheads interest and depreciation ppt powerpoint presentation file display. This is a eight stage process. The stages in this process are sales waterfall, waterfall chart, business.


Slide 1 of 6
This is a waterfall chart with merchandising sales cost and net revenue ppt powerpoint presentation summary show. This is a three stage process. The stages in this process are sales waterfall, waterfall chart, business.


Slide 1 of 6
This is a waterfall chart showing ytd sales change ppt powerpoint presentation professional format. This is a ten stage process. The stages in this process are sales waterfall, waterfall chart, business.


Slide 1 of 6
This is a waterfall chart indicating sales performance ppt powerpoint presentation outline templates. This is a seven stage process. The stages in this process are sales waterfall, waterfall chart, business.


Slide 1 of 6
This is a improve sales performance and productivity ppt powerpoint presentation diagram graph charts. This is a four stage process. The stages in this process are marketing effort, branding initiative, marketing initiatives.


Slide 1 of 5
Presenting this set of slides with name working capital computation steps chart inventory sales ppt powerpoint presentation icon gallery. The topics discussed in these slides are assumptions, business, planning, strategy, marketing. This is a completely editable PowerPoint presentation and is available for immediate download. Download now and impress your audience.


Slide 1 of 5
This is a sales marketing organization chart ppt powerpoint presentation infographic template template cpb. This is a five stage process. The stages in this process are sales marketing organization chart.


Slide 1 of 5
Strategic Sales Plan Marketing And Service Delivery Ppt Powerpoint Presentation Diagram Graph Charts
This is a strategic sales plan marketing and service delivery ppt powerpoint presentation diagram graph charts. This is a three stage process. The stages in this process are one page strategy, one page plan, one page approach.


Slide 1 of 5
This is a sales volume analysis chart with total sales and total cost ppt powerpoint presentation slide. This is a ten stage process. The stages in this process are break even point,break even analysis,break even level.


Slide 1 of 5
This is a break even sales and cost analysis chart ppt powerpoint presentation gallery master slide. This is a three stage process. The stages in this process are break even point,break even analysis,break even level.


Slide 1 of 5
This is a direct sales lead ppt powerpoint presentation diagram graph charts cpb. This is a two stage process. The stages in this process are direct sales lead.


Slide 1 of 5
This is a scatter bubble chart highest sale ppt powerpoint presentation show slide download. This is a two stage process. The stages in this process are finance, investment, analysis, business, marketing.


Slide 1 of 5
This is a hierarchy chart for sales team ppt powerpoint presentation samples. This is a six stage process. The stages in this process are business, marketing, technology, product, management.


Slide 1 of 5
This is a funnel chart for sales management ppt powerpoint presentation styles. This is a four stage process. The stages in this process are funnel, process, flow, business, sale.


Slide 1 of 5
This is a pie chart showing sales figures ppt powerpoint presentation styles. This is a four stage process. The stages in this process are per channel, railway stations, downtown hotel, cruise liners, per region, north america, south america, central america, eurasia and asia.


Slide 1 of 4
This is a sales breakdown pie chart dashboard powerpoint slide influencers. This is a four stage process. The stages in this process are railway stations and other, downtown hotel and resorts, cruise liners and seaports, airports, north america, south america, central america and caribbean, eurasia and asia, africa, europe.


Slide 1 of 4
This is a sales forecast funnel chart ppt examples slides. This is a four stage process. The stages in this process are jan, feb, mar, apr, may, jun, jul, aug, sep, oct, nov, dec.


Slide 1 of 4
This is a quarterly product sales area chart ppt examples slides. This is a four stage process. The stages in this process are product, business, marketing, success, sales.


Slide 1 of 4
Pie charts infographic diagram has been used to design this PowerPoint template. This PPT slide may be used to depict Sales trend analysis and sales forecasting. Download this professional slide to make impressive presentation.
SHOW
- 60
- 120
- 180
DISPLAYING: 60 of 584 Item(s)
Page