 AI PPT Maker
 Templates
 PPT Bundles
 Design Services
 Business PPTs
 Business Plan
 Management
 Strategy
 Introduction PPT
 Roadmap
 Self Introduction
 Timelines
 Process
 Marketing
 Agenda
 Technology
 Medical
 Startup Business Plan
 Cyber Security
 Dashboards
 SWOT
SWOT Proposals
 Education
 Pitch Deck
 Digital Marketing
 KPIs
KPIs Project Management
 Product Management
 Artificial Intelligence
 Target Market
 Communication
 Supply Chain
 Google Slides
 Research Services
 One Pagers
 All Categories
Sales and revenue PowerPoint Presentation Templates and Google Slides
SHOW
- 60
- 120
- 180
DISPLAYING: 60 of 311 Item(s)
Page


This complete presentation has PPT slides on wide range of topics highlighting the core areas of your business needs. It has professionally designed templates with relevant visuals and subject driven content. This presentation deck has total of fifty three slides. Get access to the customizable templates. Our designers have created editable templates for your convenience. You can edit the colour, text and font size as per your need. You can add or delete the content if required. You are just a click to away to have this ready made presentation. Click the download button now.


Use this Product Management To Boost Sales And Revenue Ppt PowerPoint Presentation Complete With Slides to ensure the business world gets to know you as a presentation expert with tremendous recall value. With its focus on providing the worlds best designs to highlight business ideas that have the potential to change the world, this PPT Template is sure to win you clients. The complete deck in fifty one slides is a compendium of information, structured in a manner that provides the best framework for a presentation. Use this completely editable and customizable presentation to make an impact and improve your order book. Download now.


This complete deck acts as a great communication tool. It helps you in conveying your business message with personalized sets of graphics, icons etc. Comprising a set of thirty eight slides, this complete deck can help you persuade your audience. It also induces strategic thinking as it has been thoroughly researched and put together by our experts. Not only is it easily downloadable but also editable. The color, graphics, theme any component can be altered to fit your individual needs. So grab it now.


This is a integrated sales and marketing funnel for sales revenue ppt powerpoint slides. This is a seven stage process. The stages in this process are social media, webinars, search engines, revenue cycle integrated sales and marketing funnel, name contacts, suspects engaged, prospects recycled, leads moles, sales leads sols, opportunities, customers.


The purpose of this slide is to implement an effective go-to-market strategy for bringing home care start-up services to an end customer taking into consideration elements like sales, positioning, and price. Find highly impressive Effective Go To Marketing Strategies To Increase Sales Volume And Revenue Pictures PDF on Slidegeeks to deliver a meaningful presentation. You can save an ample amount of time using these presentation templates. No need to worry to prepare everything from scratch because Slidegeeks experts have already done a huge research and work for you. You need to download Effective Go To Marketing Strategies To Increase Sales Volume And Revenue Pictures PDF for your upcoming presentation. All the presentation templates are 100 percent editable and you can change the color and personalize the content accordingly. Download now


Boost your pitch with our creative Strategic Brand Promotion For Enhanced Recognition And Revenue Growth Product Marketing Dashboard With Sales Trend Microsoft PDF. Deliver an awe-inspiring pitch that will mesmerize everyone. Using these presentation templates you will surely catch everyones attention. You can browse the ppts collection on our website. We have researchers who are experts at creating the right content for the templates. So you do not have to invest time in any additional work. Just grab the template now and use them.


The following slide showcases the competitive assessment of organizations sales and revenues to evaluate the gap and compare metrics. It includes pie chart representing performance along with key insights etc. Take your projects to the next level with our ultimate collection of Competitive Analysis Of Sales And Revenue Performance Elements PDF. Slidegeeks has designed a range of layouts that are perfect for representing task or activity duration, keeping track of all your deadlines at a glance. Tailor these designs to your exact needs and give them a truly corporate look with your own brand colors they will make your projects stand out from the rest.


The following slide showcases the competitive assessment of organizations sales and revenues to evaluate the gap and compare metrics. It includes pie chart representing performance along with key insights etc. Find a pre designed and impeccable Mitigating Sales Risks With Strategic Action Planning Competitive Analysis Of Sales And Revenue Performance Slides PDF. The templates can ace your presentation without additional effort. You can download these easy to edit presentation templates to make your presentation stand out from others. So, what are you waiting for Download the template from Slidegeeks today and give a unique touch to your presentation.


This slide illustrates facts and figures related to revenue generated by the company and customers in the sales pipeline in the current quarter. It includes revenue, billings, cash flow, target customers and new customers etc. Showcasing this set of slides titled Quarterly Revenue Progress And Sales Pipeline Dashboard Information PDF. The topics addressed in these templates are Financials, Revenue, Sales Pipeline. All the content presented in this PPT design is completely editable. Download it and make adjustments in color, background, font etc. as per your unique business setting.


This slide shows statistics related to trending technologies which can be used by business enterprises while aligning sales and marketing. It includes various technologies such as CRM software, email marketing, analytical tools, content management, etc. From laying roadmaps to briefing everything in detail, our templates are perfect for you. You can set the stage with your presentation slides. All you have to do is download these easy-to-edit and customizable templates. Boosting Yearly Business Revenue Popular Sales And Marketing Alignment Technologies Ideas PDF will help you deliver an outstanding performance that everyone would remember and praise you for. Do download this presentation today.


This slide focuses on metrics to measure customer and revenue churn which also shows net promoter score, customer loyalty rate, percentage of premium users, customer lifetime value, etc. This modern and well arranged Customer Service Plan To Improve Sales Metrics To Measure Customer And Revenue Churn Infographics PDF provides lots of creative possibilities. It is very simple to customize and edit with the Powerpoint Software. Just drag and drop your pictures into the shapes. All facets of this template can be edited with Powerpoint no extra software is necessary. Add your own material, put your images in the places assigned for them, adjust the colors, and then you can show your slides to the world, with an animated slide included.


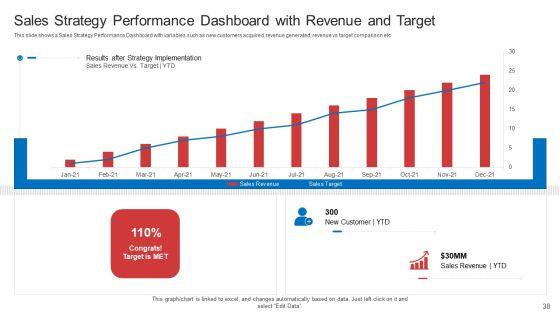
This slide showcases dashboard that can help organization to identify the new customers acquired and revenue generated by service subscriptions. Its key components are average weekly subscription revenue, subscription sales target, customer lifetime value and customer acquisition cost. Do you have to make sure that everyone on your team knows about any specific topic I yes, then you should give Implementing New Sales And Marketing Process For Services Service Subscription And Revenue Assessment Infographics PDF a try. Our experts have put a lot of knowledge and effort into creating this impeccable Implementing New Sales And Marketing Process For Services Service Subscription And Revenue Assessment Infographics PDF. You can use this template for your upcoming presentations, as the slides are perfect to represent even the tiniest detail. You can download these templates from the Slidegeeks website and these are easy to edit. So grab these today.


Presenting you an exemplary Revenue Core Operating Profit Core Operating Profit Margin And Overseas Sales To Revenue One Pager Documents. Our one-pager comprises all the must-have essentials of an inclusive document. You can edit it with ease, as its layout is completely editable. With such freedom, you can tweak its design and other elements to your requirements. Download this Revenue Core Operating Profit Core Operating Profit Margin And Overseas Sales To Revenue One Pager Documents brilliant piece now.


The following slide showcases the competitive assessment of organizations sales and revenues to evaluate the gap and compare metrics. It includes pie chart representing performance along with key insights etc. Slidegeeks is one of the best resources for PowerPoint templates. You can download easily and regulate Sales Risk Assessment For Profit Maximization Competitive Analysis Of Sales And Revenue Performance Introduction PDF for your personal presentations from our wonderful collection. A few clicks is all it takes to discover and get the most relevant and appropriate templates. Use our Templates to add a unique zing and appeal to your presentation and meetings. All the slides are easy to edit and you can use them even for advertisement purposes.


The following slide outlines the graphical representation of companys sales and profit. It cover details about the quarterly sales and profit for the current year along with key intakes. Want to ace your presentation in front of a live audience Our Brand Building Techniques Enhance Customer Engagement Loyalty Decline In Product Sales And Revenue Ideas PDF can help you do that by engaging all the users towards you. Slidegeeks experts have put their efforts and expertise into creating these impeccable powerpoint presentations so that you can communicate your ideas clearly. Moreover, all the templates are customizable, and easy to edit and downloadable. Use these for both personal and commercial use.


The following slide highlights the current scenario of company sales and customer retention rates. It illustrates graphs of last 3 years which shows company sales and net profit margins are declining and existing customer are leaving the company. Slidegeeks is one of the best resources for PowerPoint templates. You can download easily and regulate Techniques To Enhance Customer Engagement Via Digital Platforms Analyzing Companys Current Sales Revenue And Customer Base Themes PDF for your personal presentations from our wonderful collection. A few clicks is all it takes to discover and get the most relevant and appropriate templates. Use our Templates to add a unique zing and appeal to your presentation and meetings. All the slides are easy to edit and you can use them even for advertisement purposes.


The following slide highlights the current scenario of company sales and customer retention rates. It illustrates graphs of last 3 years which shows company sales and net profit margins are declining and existing customer are leaving the company. Create an editable Techniques To Enhance Customer Engagement Via Digital Platforms Analyzing Companys Current Sales Revenue And Customer Base Slide Ideas PDF that communicates your idea and engages your audience. Whether youre presenting a business or an educational presentation, pre-designed presentation templates help save time. Techniques To Enhance Customer Engagement Via Digital Platforms Analyzing Companys Current Sales Revenue And Customer Base Slide Ideas PDF is highly customizable and very easy to edit, covering many different styles from creative to business presentations. Slidegeeks has creative team members who have crafted amazing templates. So, go and get them without any delay.


The following slide highlights the current scenario of company sales and customer retention rates. It illustrates graphs of last 3 years which shows company sales and net profit margins are declining and existing customer are leaving the company. Want to ace your presentation in front of a live audience. Our E Commerce Marketing Techniques To Boost Sales Analyzing Companys Current Sales Revenue And Customer Base Formats PDF can help you do that by engaging all the users towards you.. Slidegeeks experts have put their efforts and expertise into creating these impeccable powerpoint presentations so that you can communicate your ideas clearly. Moreover, all the templates are customizable, and easy-to-edit and downloadable. Use these for both personal and commercial use.


This slide covers status and earnings from sales in an organization. It includes details such as sales count, revenue generated, profit earned and cost incurred to raise sales and profitable sales channel.Showcasing this set of slides titled Company Sales KPI And Revenue Generation Progress Scorecard Formats PDF. The topics addressed in these templates are Accumulated Revenue, Annual Sales Revenue, Incremental Sales. All the content presented in this PPT design is completely editable. Download it and make adjustments in color, background, font etc. as per your unique business setting.


This slide shows the composition of revenue and sales by regions such as America, China, Europe, etc. Slidegeeks is one of the best resources for PowerPoint templates. You can download easily and regulate Financial Reporting To Analyze Composition Of Revenue And Sales By Region Brochure PDF for your personal presentations from our wonderful collection. A few clicks is all it takes to discover and get the most relevant and appropriate templates. Use our Templates to add a unique zing and appeal to your presentation and meetings. All the slides are easy to edit and you can use them even for advertisement purposes.


This slide illustrates artificial intelligence and business intelligence corporate revenue dashboard. It includes pipeline for Aug 2023, revenue for Sep 2023, AI augmented opportunities etc. Pitch your topic with ease and precision using this Artificial Intelligence Sales Capabilities And Revenue Dashboard Portrait PDF. This layout presents information on Sales Capabilities, Revenue Dashboard. It is also available for immediate download and adjustment. So, changes can be made in the color, design, graphics or any other component to create a unique layout.


Here an illustrative One Pager Revenue And Sales Prospect Information Sheet PDF Document PPT Template. This one-pager template is designed to match your needs. It is 100 percent editable, which allows you to make changes as you seem fit to suit your purpose. Grab this One Pager Revenue And Sales Prospect Information Sheet PDF Document PPT Template Download now.


This slide highlights the agriculture company sales revenue by market share and services. It includes Western Europe, Asia, Africa, and Middle east region. Slidegeeks is here to make your presentations a breeze with Sales Revenue By Market And Commodities Global Food Products Company Profile Slides PDF With our easy-to-use and customizable templates, you can focus on delivering your ideas rather than worrying about formatting. With a variety of designs to choose from, you are sure to find one that suits your needs. And with animations and unique photos, illustrations, and fonts, you can make your presentation pop. So whether you Are giving a sales pitch or presenting to the board, make sure to check out Slidegeeks first.


This slide covers sales and revenue generated by a business entity. It also includes elements such profits earned, cost incurred, marketing and sales cost breakdown, annual sales revenue graph, sales generated through social media, revenue from up OR cross selling, etc. Pitch your topic with ease and precision using this Company Sales And Revenue Performance Analysis Ppt Ideas Format PDF. This layout presents information on Total Sales, Revenue Generation, Profit Earned, Cost Incurred. It is also available for immediate download and adjustment. So, changes can be made in the color, design, graphics or any other component to create a unique layout.


This slide illustrates report on sales revenue and market growth by region. It includes sales highlights on different products, total revenue, USA market growth etc.Pitch your topic with ease and precision using this Market Growth And Sales Revenue Diversified Report Sample PDF. This layout presents information on Market Grew, Africa Grew, Total Revenue. It is also available for immediate download and adjustment. So, changes can be made in the color, design, graphics or any other component to create a unique layout.


The following slide highlights the current scenario of company sales and customer retention rates. It illustrates graphs of last 3 years which shows company sales and net profit margins are declining and existing customer are leaving the company.Here you can discover an assortment of the finest PowerPoint and Google Slides templates. With these templates, you can create presentations for a variety of purposes while simultaneously providing your audience with an eye-catching visual experience. Download Analyzing Companys Current Sales Revenue And Customer Base Graphics PDF to deliver an impeccable presentation. These templates will make your job of preparing presentations much quicker, yet still, maintain a high level of quality. Slidegeeks has experienced researchers who prepare these templates and write high-quality content for you. Later on, you can personalize the content by editing the Analyzing Companys Current Sales Revenue And Customer Base Graphics PDF.


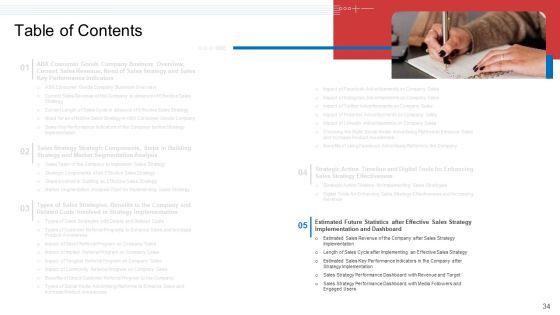
Do you know about Slidesgeeks Table Of Contents Product Management To Boost Sales And Revenue Ppt PowerPoint Presentation File Infographics PDF These are perfect for delivering any kind od presentation. Using it, create PowerPoint presentations that communicate your ideas and engage audiences. Save time and effort by using our pre designed presentation templates that are perfect for a wide range of topic. Our vast selection of designs covers a range of styles, from creative to business, and are all highly customizable and easy to edit. Download as a PowerPoint template or use them as Google Slides themes.


The following slide highlights the current scenario of company sales and customer retention rates. It illustrates graphs of last 3 years which shows company sales and net profit margins are declining and existing customer are leaving the company From laying roadmaps to briefing everything in detail, our templates are perfect for you. You can set the stage with your presentation slides. All you have to do is download these easy to edit and customizable templates. Analyzing Companys Current Sales Revenue And Customer Retail Business Growth Marketing Techniques Elements PDF will help you deliver an outstanding performance that everyone would remember and praise you for. Do download this presentation today.
This slide covers dashboard depicting total annual sales in company. It includes key components such as revenue, profit margins, cost incurred, cost breakdown, up sell and churn trends. Showcasing this set of slides titled Sales Attrition Tracking Report With Revenue And Customer Churn Analytics Formats PDF. The topics addressed in these templates are Revenue, Number Of Sales, Profit, Cost. All the content presented in this PPT design is completely editable. Download it and make adjustments in color, background, font etc. as per your unique business setting.


This slide exhibits sales report dashboards that provides information of sales activities and performance in financial year. It includes elements such as average weekly sales revenue, customer acquisition cost, customer lifetime value and sales target. Pitch your topic with ease and precision using this Business Sales And Revenue Summary Dashboard Brochure PDF. This layout presents information on Average Revenue, Customer Lifetime, Customer Acquisition. It is also available for immediate download and adjustment. So, changes can be made in the color, design, graphics or any other component to create a unique layout.
SHOW
- 60
- 120
- 180
DISPLAYING: 60 of 311 Item(s)
Page