- Sign up
- Sign In
 AI PPT Maker
 Templates
 PPT Bundles
 Design Services
 Business PPTs
 Business Plan
 Management
 Strategy
 Introduction PPT
 Roadmap
 Self Introduction
 Timelines
 Process
 Marketing
 Agenda
 Technology
 Medical
 Startup Business Plan
 Cyber Security
 Dashboards
 SWOT
SWOT Proposals
 Education
 Pitch Deck
 Digital Marketing
 KPIs
KPIs Project Management
 Product Management
 Artificial Intelligence
 Target Market
 Communication
 Supply Chain
 Google Slides
 Research Services
 One Pagers
 All Categories
Sales analysis dashboard PowerPoint Presentation Templates and Google Slides
52 Item(s)


This is a sales forecasting analysis dashboard diagram templates. This is a nine stage process. The stages in this process are develop forecasting procedure, select forecasting analysis method, comprehend total forecasting procedure, collect collate gather and analyze data, determine independent and dependent variables, present all the assumption about data, forecast objectives, evaluate performance result against the forecasts, make and finalize the forecasts.


The following slide highlights the KPIs of product sales to assess sales performance over the past few years to formulate new strategy. It includes elements such as revenue, offline and online sales, monthly cost analysis etc. Pitch your topic with ease and precision using this Description Product Sales Performance Analysis Dashboard Ppt PowerPoint Presentation File Samples PDF. This layout presents information on Product Wise Revenue, Monthly Cost Analysis, Sales Revenue, Different Strategies. It is also available for immediate download and adjustment. So, changes can be made in the color, design, graphics or any other component to create a unique layout.


This slide exhibits customer service dashboard to improve visibility. The dashboard includes resolved and active cases, incoming cases by subject, priority, SLA status and age, CSAT and escalated case volume. Slidegeeks is one of the best resources for PowerPoint templates. You can download easily and regulate Enhance Customer Engagement Through After Sales Activities Customer Support Service Analysis Dashboard Diagrams Introduction PDF for your personal presentations from our wonderful collection. A few clicks is all it takes to discover and get the most relevant and appropriate templates. Use our Templates to add a unique zing and appeal to your presentation and meetings. All the slides are easy to edit and you can use them even for advertisement purposes.


The following slide displays dashboard to summarize sales transactions of the company for effective management of income and revenue. It further includes KPIs such as monthly and yearly breakdown, new customers, etc. Showcasing this set of slides titled Sales Transaction Overview Dashboard With Variance Analysis Summary PDF. The topics addressed in these templates are Sales, Customers, Variance Analysis. All the content presented in this PPT design is completely editable. Download it and make adjustments in color, background, font etc. as per your unique business setting.


This slide showcases a dashboard presenting various metrics to measure and analyze sales performance for revenue growth. It includes key components such as number of annual new customer, sales revenue, customer satisfaction, customer acquisition cost, product wise sales, month wise sales and sales comparison. From laying roadmaps to briefing everything in detail, our templates are perfect for you. You can set the stage with your presentation slides. All you have to do is download these easy-to-edit and customizable templates. Inspecting Sales Optimization Areas Sales Analysis Dashboard To Measure Performance Demonstration PDF will help you deliver an outstanding performance that everyone would remember and praise you for. Do download this presentation today.


This showcases dashboard that can help organization in cash management and track KPIs to evaluate the financial performance of company. It key components are liquidity ratios, cash balance. days sales outstanding, days inventory outstanding and days payable outstanding. Pitch your topic with ease and precision using this Cash Management Dashboard With Sales Outstanding And Liquidity Ratio Analysis Information PDF. This layout presents information on Cash Conversion, Working Capital, Cash Balance. It is also available for immediate download and adjustment. So, changes can be made in the color, design, graphics or any other component to create a unique layout.


The following slide highlights the sales revenue and profit margin growth dashboard illustrating key headings which includes revenue, sales, gross margin and net margin. Where gross margin consists of actual gross margin, target gross margin, gross margin growth and comparative gross margin. Showcasing this set of slides titled Sales Revenue And Profit Growth Analysis Dashboard Ppt Portfolio Slide PDF. The topics addressed in these templates are Revenue, Sales, Gross Margin, Net Margin. All the content presented in this PPT design is completely editable. Download it and make adjustments in color, background, font etc. as per your unique business setting.


The following slide highlights the sales revenue and gross margin growth dashboard illustrating key headings which includes gross margin, total revenue, total client, total product, gross margin trend, gross margin growth, monthly gross margin, monthly revenue, yearly revenue growth and gross margin growth trend by product. Showcasing this set of slides titled Sales Revenue And Gross Growth Analysis Dashboard Ppt Inspiration Background Image PDF. The topics addressed in these templates are Gross Margin, Total Revenue, Total Clients. All the content presented in this PPT design is completely editable. Download it and make adjustments in color, background, font etc. as per your unique business setting.


The following slide highlights the dashboard o product sales growth and gross margin analysis illustrating key headings which includes sales by product, sales by month, sales product by margin, sales product by quantity, gross margin growth, gross margin trend and product inventory. Showcasing this set of slides titled Dashboard Of Product Sales Growth And Gross Analysis Analysis Ppt Styles Good PDF. The topics addressed in these templates are Gross Margin Growth, Gross Margin Trend, Product Inventory. All the content presented in this PPT design is completely editable. Download it and make adjustments in color, background, font etc. as per your unique business setting.


This slide illustrates the SAP Analytics Cloud dashboard to monitor product sales performance. It provides information regarding the gross margin and net revenue earned, product performance state wise and year wise. Welcome to our selection of the Budget Plan For BI Technique For Data Informed Decisions Clipart PDF. These are designed to help you showcase your creativity and bring your sphere to life. Planning and Innovation are essential for any business that is just starting out. This collection contains the designs that you need for your everyday presentations. All of our PowerPoints are 100 percent editable, so you can customize them to suit your needs. This multi purpose template can be used in various situations. Grab these presentation templates today.
This slide defines the dashboard for five years sales forecast and analysis . It includes information related to the estimated and actual sales. Pitch your topic with ease and precision using this Five Years Sales Projection And Analysis Dashboard Icons PDF. This layout presents information on Forecast Value, Forecast Accuracy, Won Opportunities. It is also available for immediate download and adjustment. So, changes can be made in the color, design, graphics or any other component to create a unique layout.


Persuade your audience using this Tactical Planning And Strategic Analysis Dashboard For Sales Infographics PDF. This PPT design covers three stages, thus making it a great tool to use. It also caters to a variety of topics including Tactical, Planning And Analyzing, Organizational Goals, Icon. Download this PPT design now to present a convincing pitch that not only emphasizes the topic but also showcases your presentation skills.


The given below slide highlights the sales results post implementation of promotion techniques. It includes KPIs such no. of units sold, competitive assessment of product wise sales, average sales unit etc.Showcasing this set of slides titled Effective Sales Promotion Strategies Analysis Dashboard Ppt PowerPoint Presentation Slides Background Designs PDF. The topics addressed in these templates are Return Amount, Sales Return, Sales Revenue. All the content presented in this PPT design is completely editable. Download it and make adjustments in color, background, font etc. as per your unique business setting.


This slide shows sales improvement plan dashboard for product classification and financial analysis which can be referred by companies which want to make quick decisions by having overview of organized and compiled data. It includes details such as comparison chart, state wise sales, total sales, adjusted margin, operational expenses, etc. Showcasing this set of slides titled Sales Enhancement Strategy Dashboard With Product Classification And Financial Analysis Formats PDF. The topics addressed in these templates are Gross Margin, Sales, Operational Expenses. All the content presented in this PPT design is completely editable. Download it and make adjustments in color, background, font etc. as per your unique business setting.


This slide showcase sales opportunity dashboard depicting international market analysis which contains opportunities, quarter to date bookings, average purchase value and opportunity breakdown. Showcasing this set of slides titled Sales Opportunity Dashboard Depicting International Business Analysis Brochure PDF. The topics addressed in these templates are Average Purchase Value, Opportunities. All the content presented in this PPT design is completely editable. Download it and make adjustments in color, background, font etc. as per your unique business setting.


The following slide depicts the efforts made my sales team in increasing companys growth. It also includes KPAs such as new customers acquired, sales, profit, average revenue per unit, customer lifetime value, acquisition cost etc. Showcasing this set of slides titled Quarterly Sales Team Performance Analysis Kpis Slides PDF. The topics addressed in these templates are Above Sales Target, Average Sales Revenue, Average Customer. All the content presented in this PPT design is completely editable. Download it and make adjustments in color, background, font etc. as per your unique business setting.
This slide illustrates the SAP Analytics Cloud dashboard to monitor product sales performance. It provides information regarding the gross margin and net revenue earned, product performance state wise and year wise. Deliver and pitch your topic in the best possible manner with this SAC Planning And Implementation SAP Analytics Cloud Dashboard For Product Sales Analysis Icons PDF. Use them to share invaluable insights on Gross Margin, Earned Quarter Wise, Gross Margin, Net Revenue and impress your audience. This template can be altered and modified as per your expectations. So, grab it now.


Deliver and pitch your topic in the best possible manner with this Finance And Accounting Online Conversion Plan Sales And Profit Margin Analysis Dashboard Demonstration PDF. Use them to share invaluable insights on Profitability Indicator, Goods Breakdown, Expenses Breakdown and impress your audience. This template can be altered and modified as per your expectations. So, grab it now.


This graph or chart is linked to excel, and changes automatically based on data. Just left click on it and select Edit Data. Deliver an awe inspiring pitch with this creative Summary Financial Sales And Profit Margin Analysis Dashboard Pictures PDF bundle. Topics like Net Profit, Past Year Vs Target Vs Actual, Net Profit Margin By Region, Channel, Expenses Breakdown, Costs And Expenses, Profitability Indicator Ratios can be discussed with this completely editable template. It is available for immediate download depending on the needs and requirements of the user.


Deliver an awe inspiring pitch with this creative Sales And Profit Margin Analysis Dashboard Introduction PDF bundle. Topics like Net Sales, Net Profit, Profitability Indicator Ratios can be discussed with this completely editable template. It is available for immediate download depending on the needs and requirements of the user.


The following slide highlights the business forecasting dashboard with sales funnel illustrating key headings which includes sales forecast, customer revenue, forecast change analysis, number of units sold forecast, forecast accuracy, opportunity generated, customer satisfaction, sales funnel, revenue forecast and summary. Pitch your topic with ease and precision using this business predictive analysis dashboard with sales funnel ppt show images pdf. This layout presents information on potential revenue, forecasted revenue, forecasted profit, forecasted risk. It is also available for immediate download and adjustment. So, changes can be made in the color, design, graphics or any other component to create a unique layout.


This slide shows real estate leasing dashboard depicting sale and rent analysis which can be referred by property managers to manage various listing. It includes information about monthly stats of rent and sales, total proceeds, monthly target, rental properties, etc.Showcasing this set of slides titled property leasing dashboard depicting sale and rent analysis diagrams pdf The topics addressed in these templates are property leasing dashboard depicting sale and rent analysis All the content presented in this PPT design is completely editable. Download it and make adjustments in color, background, font etc. as per your unique business setting.
Showcasing this set of slides titled sales pipeline analysis tracking through dashboard icons pdf. The topics addressed in these templates are sales pipeline analysis tracking through dashboard. All the content presented in this PPT design is completely editable. Download it and make adjustments in color, background, font etc. as per your unique business setting.


Showcasing this set of slides titled sales pipeline analysis dashboard with kpis structure pdf. The topics addressed in these templates are sales pipeline analysis dashboard with kpis. All the content presented in this PPT design is completely editable. Download it and make adjustments in color, background, font etc. as per your unique business setting.
Showcasing this set of slides titled icon of sales pipeline analysis dashboard graphics pdf. The topics addressed in these templates are icon of sales pipeline analysis dashboard. All the content presented in this PPT design is completely editable. Download it and make adjustments in color, background, font etc. as per your unique business setting.


Deliver an awe inspiring pitch with this creative roadmap for financial accounting transformation sales and profit margin analysis dashboard pictures pdf bundle. Topics like profitability indicator ratios, costs and expenses, expenses breakdown can be discussed with this completely editable template. It is available for immediate download depending on the needs and requirements of the user.


Deliver an awe inspiring pitch with this creative commodity category analysis product management kpi sales metrics professional pdf bundle. Topics like sales performance, top product in revenue, account target or progress can be discussed with this completely editable template. It is available for immediate download depending on the needs and requirements of the user.


This slide provides the glimpse about the sales performance metrics which focuses on regional sales based on customer demands and sales team performance. Deliver and pitch your topic in the best possible manner with this market area analysis regional sales performance metrics dashboard designs pdf. Use them to share invaluable insights on regional sales performance metrics dashboard and impress your audience. This template can be altered and modified as per your expectations. So, grab it now.


Deliver an awe inspiring pitch with this creative business management dashboards sales business analysis method ppt file images pdf bundle. Topics like revenue, sales, profit margin can be discussed with this completely editable template. It is available for immediate download depending on the needs and requirements of the user.


Deliver an awe inspiring pitch with this creative market analysis of retail sector retail kpi dashboard showing total sales per labor hour sales by unit area themes pdf bundle. Topics like sales, revenue, average, departments can be discussed with this completely editable template. It is available for immediate download depending on the needs and requirements of the user.


Deliver and pitch your topic in the best possible manner with this market analysis of retail sector retail kpi dashboard showing sales revenue customers and out of stock items structure pdf. Use them to share invaluable insights on sales revenue, customers, average transaction price and impress your audience. This template can be altered and modified as per your expectations. So, grab it now.
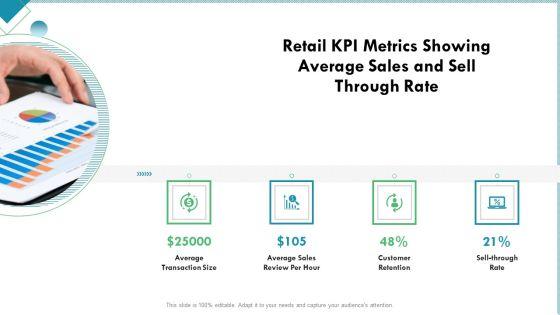

This is a market analysis of retail sector retail kpi metrics showing average sales and sell through rate clipart pdf template with various stages. Focus and dispense information on four stages using this creative set, that comes with editable features. It contains large content boxes to add your information on topics like average transaction size, average sales review per hour, customer retention, sell through rate. You can also showcase facts, figures, and other relevant content using this PPT layout. Grab it now.
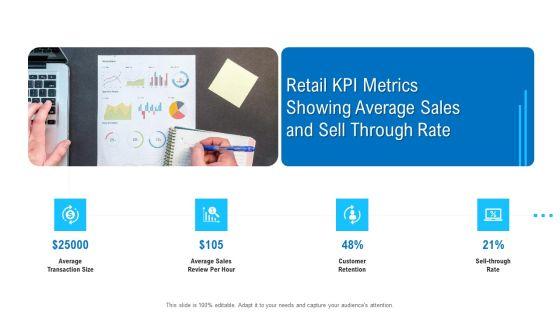

Presenting merchandising industry analysis retail kpi metrics showing average sales and sell through rate clipart pdf to provide visual cues and insights. Share and navigate important information on four stages that need your due attention. This template can be used to pitch topics like average transaction size, average sales review per hour, customer retention. In addtion, this PPT design contains high resolution images, graphics, etc, that are easily editable and available for immediate download.


Deliver and pitch your topic in the best possible manner with this market potential analysis product management KPI sales metrics ppt inspiration grid pdf. Use them to share invaluable insights on revenue, account target progress, sales performance, salesforce sales, expansion MRR target progress and impress your audience. This template can be altered and modified as per your expectations. So, grab it now.
Showcasing this set of slides titled sales trends analysis report dashboard ppt powerpoint presentation icon portrait pdf. The topics addressed in these templates are sales trends analysis report dashboard. All the content presented in this PPT design is completely editable. Download it and make adjustments in color, background, font etc. as per your unique business setting.


Deliver and pitch your topic in the best possible manner with this competitor analysis sales performance dashboard ppt infographics samples pdf. Use them to share invaluable insights on sales, revenue, performance, growth and impress your audience. This template can be altered and modified as per your expectations. So, grab it now.


Presenting this set of slides with name product sales analysis dashboard report ppt powerpoint presentation infographics graphics pictures pdf. The topics discussed in these slides are average operative costs, product models performance, production last year, sales by month, taxed amount. This is a completely editable PowerPoint presentation and is available for immediate download. Download now and impress your audience.


Presenting this set of slides with name dashboard for statistical analysis of product sales ppt powerpoint presentation infographics graphics pictures pdf. The topics discussed in these slides are sales chart, product. This is a completely editable PowerPoint presentation and is available for immediate download. Download now and impress your audience.


Presenting this set of slides with name sales performance analysis kpi dashboard ppt powerpoint presentation file graphic images pdf. The topics discussed in these slides are target, achievement, revenue. This is a completely editable PowerPoint presentation and is available for immediate download. Download now and impress your audience.
Presenting this set of slides with name consumer statistics dashboard showing sales analysis by month ppt powerpoint presentation icon inspiration pdf. The topics discussed in these slides are sales, analysis, growth. This is a completely editable PowerPoint presentation and is available for immediate download. Download now and impress your audience.


Presenting this set of slides with name dashboard showing sales gap analysis ppt powerpoint presentation infographic template graphics pictures pdf. The topics discussed in these slides are bookings month, total forecast month open opportumities, forecasted value closing number deals month, sales cycle, bookings this quarter, goal. This is a completely editable PowerPoint presentation and is available for immediate download. Download now and impress your audience.


Presenting this set of slides with name sales performance analysis dashboard ppt powerpoint presentation infographic template guide pdf. The topics discussed in these slides are overall sales target achievement, sales representative achievement. This is a completely editable PowerPoint presentation and is available for immediate download. Download now and impress your audience.


This slide covers the dashboard for analyzing the sales plan implemented in an organization. The purpose of this template is to assess strategical and operational aspects of the company. It includes key performance indicators such as number of sales, revenue, profit, cost, etc. Showcasing this set of slides titled Sales Work Action Plan Analysis Dashboard Brochure PDF. The topics addressed in these templates are Sales Revenue, Cost Breakdown, Accumulated Revenue. All the content presented in this PPT design is completely editable. Download it and make adjustments in color, background, font etc. as per your unique business setting.


Presenting Sales Revenue And Profit Growth Analysis Dashboard Icon Ppt Outline Mockup PDF to dispense important information. This template comprises three stages. It also presents valuable insights into the topics including Sales, Revenue And Profit, Growth Analysis, Dashboard Icon. This is a completely customizable PowerPoint theme that can be put to use immediately. So, download it and address the topic impactfully.


Following slide presents a key performance indicating dashboard that can be used by businesses to track Inventory stock out and lost sales. Major key performance indicators are percentage stockouts, amount of sales, lost sales accountability, etc. Pitch your topic with ease and precision using this Inventory Stock Out And Decline Of Sales Analysis Dashboard Inspiration PDF. This layout presents information on Lost Sales Summary, Stock Out Details It is also available for immediate download and adjustment. So, changes can be made in the color, design, graphics or any other component to create a unique layout.


The following slide presents a key performance indicating dashboards that can be used by managers in order to analyse customer-lost sales. Major key performance indicators are lost deals rate, lost sales rate, customer data analytics, etc. Pitch your topic with ease and precision using this Customer Decline Of Sales Analysis Dashboard Rules PDF. This layout presents information on Customer Data Analytics. It is also available for immediate download and adjustment. So, changes can be made in the color, design, graphics or any other component to create a unique layout.


This template shows the sales analysis dashboard after implementing an effective marketing plan. This slide aims to measure the potential and actual results of the sales target. It includes KPIs such as the number of page views on the website, total sales, subscribers, etc.Pitch your topic with ease and precision using this 360 Degree Sales Analysis Dashboard After Marketing Plan Implementation Pictures PDF. This layout presents information on Lead Generation Life, Conversion Rate. It is also available for immediate download and adjustment. So, changes can be made in the color, design, graphics or any other component to create a unique layout.


This slide illustrates a dashboard for product sales review to measure to help business monitor and improve productivity, employee engagement and meet revenue targets. It covers product names with sales reps, lead conversion, response time and outbound calls. Showcasing this set of slides titled Monthly Product Sales Analysis Dashboard Infographics PDF. The topics addressed in these templates are Lead Conversion Rate, Outbound Calls, Sales Analysis Dashboard. All the content presented in this PPT design is completely editable. Download it and make adjustments in color, background, font etc. as per your unique business setting.


This slide presents software sales and profit comparison dashboard highlighting yearly growth. It shows increase in sales, profit, number of sales and comparison of 3 different software. Showcasing this set of slides titled Software Sales And Comparison Analysis Of Profit Dashboard Sample PDF. The topics addressed in these templates are Increase Sales, Profit, Sales Dashboard. All the content presented in this PPT design is completely editable. Download it and make adjustments in color, background, font etc. as per your unique business setting.
52 Item(s)