- Sign up
- Sign In
 AI PPT Maker
 Templates
 PPT Bundles
 Design Services
 Business PPTs
 Business Plan
 Management
 Strategy
 Introduction PPT
 Roadmap
 Self Introduction
 Timelines
 Process
 Marketing
 Agenda
 Technology
 Medical
 Startup Business Plan
 Cyber Security
 Dashboards
 SWOT
SWOT Proposals
 Education
 Pitch Deck
 Digital Marketing
 KPIs
KPIs Project Management
 Product Management
 Artificial Intelligence
 Target Market
 Communication
 Supply Chain
 Google Slides
 Research Services
 One Pagers
 All Categories
Revenue reported PowerPoint Presentation Templates and Google Slides
SHOW
- 60
- 120
- 180
DISPLAYING: 60 of 96 Item(s)
Page


Presenting this set of slides with name digital marketing roi report revenue ppt powerpoint presentation pictures slide portrait. The topics discussed in these slides are business, management, planning, strategy, marketing. This is a completely editable PowerPoint presentation and is available for immediate download. Download now and impress your audience.


Following slide illustrates statistics of revenue generation. It depicts that company achieved its highest revenue generation mark in H2 2023. Retrieve professionally designed Submission Of Project Viability Report For Bank Loan Year Over Year Revenue Generation Highlights Diagrams PDF to effectively convey your message and captivate your listeners. Save time by selecting pre-made slideshows that are appropriate for various topics, from business to educational purposes. These themes come in many different styles, from creative to corporate, and all of them are easily adjustable and can be edited quickly. Access them as PowerPoint templates or as Google Slides themes. You do not have to go on a hunt for the perfect presentation because Slidegeeks got you covered from everywhere.


This slide showcase donut chart of revenue an expenses occurred towards running an organization. It includes elements such as foundations, contracts payroll, benefits, fundraising, worker wages etc. Showcasing this set of slides titled Organization Revenue And Expenditure Financial Performance Report Inspiration PDF. The topics addressed in these templates are Expenses, Revenue Worker Wages. All the content presented in this PPT design is completely editable. Download it and make adjustments in color, background, font etc. as per your unique business setting.


This slide showcase revenue trends of four different product and suggestions to boost revenue. It includes elements such as product A, product B , product C, product D along with key highlights and revenue projection. Showcasing this set of slides titled Financial Revenue Trends Analysis Performance Report Designs PDF. The topics addressed in these templates are Revenue, Innovative Design, Latest Trend. All the content presented in this PPT design is completely editable. Download it and make adjustments in color, background, font etc. as per your unique business setting.


The slide highlights the historical financial revenue illustrating revenue, year on year growth and CAGR. It also depicts the reasons for the growth decline in last three years. Present like a pro with Logistics Transport Company Financial Report Historical Financial Revenue Ppt Outline Slides PDF Create beautiful presentations together with your team, using our easy-to-use presentation slides. Share your ideas in real-time and make changes on the fly by downloading our templates. So whether you are in the office, on the go, or in a remote location, you can stay in sync with your team and present your ideas with confidence. With Slidegeeks presentation got a whole lot easier. Grab these presentations today.


Following slide illustrates statistics of revenue generation. It depicts that company achieved its highest revenue generation mark in H2 2020. Are you searching for a Financial Evaluation Report Year Over Year Revenue Generation Highlights Designs PDF that is uncluttered, straightforward, and original Its easy to edit, and you can change the colors to suit your personal or business branding. For a presentation that expresses how much effort youve put in, this template is ideal With all of its features, including tables, diagrams, statistics, and lists, its perfect for a business plan presentation. Make your ideas more appealing with these professional slides. Download Financial Evaluation Report Year Over Year Revenue Generation Highlights Designs PDF from Slidegeeks today.


This slide illustrates graphical representation of CRM leads data. It includes revenue, open leads, won leads, cold leads, monthly leads report and leads dough nut graph etc. Pitch your topic with ease and precision using this Monthly Leads Report And Customer Relationship Management Dashboard With Revenue Information PDF. This layout presents information on Monthly Leads Report, Customer Relationship Management, Dashboard With Revenue. It is also available for immediate download and adjustment. So, changes can be made in the color, design, graphics or any other component to create a unique layout.


This slide shows the Total Revenues and Net Income of ABC Corporation for five years in Million dollar Coming up with a presentation necessitates that the majority of the effort goes into the content and the message you intend to convey. The visuals of a PowerPoint presentation can only be effective if it supplements and supports the story that is being told. Keeping this in mind our experts created Financial Reporting To Analyze Total Revenues And Net Income For Five Years Guidelines PDF to reduce the time that goes into designing the presentation. This way, you can concentrate on the message while our designers take care of providing you with the right template for the situation.


This slide shows the composition of revenue and sales by regions such as America, China, Europe, etc. Slidegeeks is one of the best resources for PowerPoint templates. You can download easily and regulate Financial Reporting To Analyze Composition Of Revenue And Sales By Region Brochure PDF for your personal presentations from our wonderful collection. A few clicks is all it takes to discover and get the most relevant and appropriate templates. Use our Templates to add a unique zing and appeal to your presentation and meetings. All the slides are easy to edit and you can use them even for advertisement purposes.


This slide shows a dashboard of monthly profit and loss transactions of a company. It depicts last six months expenses, revenues, payment status and customer growth.Showcasing this set of slides titled Monthly Profit And Loss Dashboard Reports With Expenses And Revenue Kpis Portrait PDF. The topics addressed in these templates are Overall Profit Margin, Overall Outstanding Revenue, Customer Growth. All the content presented in this PPT design is completely editable. Download it and make adjustments in color, background, font etc. as per your unique business setting.


The slide highlights the historical revenue split for software company since its inception and revenue share for current year based on geography. Do you have an important presentation coming up Are you looking for something that will make your presentation stand out from the rest Look no further than Revenue Split By Geography Financial Performance Report Of Software Firm Background PDF. With our professional designs, you can trust that your presentation will pop and make delivering it a smooth process. And with Slidegeeks, you can trust that your presentation will be unique and memorable. So why wait Grab Revenue Split By Geography Financial Performance Report Of Software Firm Background PDF today and make your presentation stand out from the rest.


The slide shows annual revenue growth of the company with the CAGR for last five financial years from 2019 to 2023. It also highlights year on year growth along with key insights. Do you have to make sure that everyone on your team knows about any specific topic I yes, then you should give Company Historic Revenue Financial Performance Report Of Software Firm Designs PDF a try. Our experts have put a lot of knowledge and effort into creating this impeccable Company Historic Revenue Financial Performance Report Of Software Firm Designs PDF. You can use this template for your upcoming presentations, as the slides are perfect to represent even the tiniest detail. You can download these templates from the Slidegeeks website and these are easy to edit. So grab these today.


The following slide shows the comparison of the revenue share by business segments of a software company. It includes services and solutions revenue share for 2019 and 2023 along with key insights. There are so many reasons you need a Business Segments Revenue Earning Comparison Financial Performance Report Of Software Firm Topics PDF. The first reason is you can not spend time making everything from scratch, Thus, Slidegeeks has made presentation templates for you too. You can easily download these templates from our website easily.


This template covers about monthly leads, deals closed in month and revenue generated in whole month . Further, it includes revenue generated by account manager.Pitch your topic with ease and precision using this Revenue Generated Through Personnel Performance Evaluation Report Mockup PDF. This layout presents information on Monthly Lead, Team Activities, Account Manage. It is also available for immediate download and adjustment. So, changes can be made in the color, design, graphics or any other component to create a unique layout.


This slide illustrates report on sales revenue and market growth by region. It includes sales highlights on different products, total revenue, USA market growth etc.Pitch your topic with ease and precision using this Market Growth And Sales Revenue Diversified Report Sample PDF. This layout presents information on Market Grew, Africa Grew, Total Revenue. It is also available for immediate download and adjustment. So, changes can be made in the color, design, graphics or any other component to create a unique layout.


This slide illustrates revenue report segmented across various dimensions for an automobile company. It includes revenue generation segmented by geography, by product, by vehicle segment etc.Showcasing this set of slides titled Diversified Revenue Report By Geography And Vehicle Segment Background PDF. The topics addressed in these templates are Vehicle Segment, Conventional Starter, Differential Assembly. All the content presented in this PPT design is completely editable. Download it and make adjustments in color, background, font etc. as per your unique business setting.


This slide covers a profitability dashboard for analyzing gross margin and net profit metrics. It includes evaluation charts such as actual vs budgeted gross profit, net profit, trends, variance analysis table for the selected month and year. Pitch your topic with ease and precision using this Actual Vs Budgeted Gross And Net Revenue Comparison Report Sample PDF. This layout presents information on Gross Profit, Net Profit, Budget. It is also available for immediate download and adjustment. So, changes can be made in the color, design, graphics or any other component to create a unique layout.
Year Over Year Revenue Generation Highlights Construct Project Feasibility Analysis Report Icons PDF
Following slide illustrates statistics of revenue generation. It depicts that company achieved its highest revenue generation mark in H2 2023. Slidegeeks has constructed Year Over Year Revenue Generation Highlights Construct Project Feasibility Analysis Report Icons PDF after conducting extensive research and examination. These presentation templates are constantly being generated and modified based on user preferences and critiques from editors. Here, you will find the most attractive templates for a range of purposes while taking into account ratings and remarks from users regarding the content. This is an excellent jumping off point to explore our content and will give new users an insight into our top notch PowerPoint Templates.


This slide displays the overall revenue that has been earned by an organization during a weekly performance report with the gross margin percent , total revenue , no. Of customers , etc. Showcasing this set of slides titled Revenue Weekly Performance Report Dashboard Topics PDF. The topics addressed in these templates are Gross Margin, Total Revenue, Customers. All the content presented in this PPT design is completely editable. Download it and make adjustments in color, background, font etc. as per your unique business setting.


Following slide illustrates statistics of revenue generation. It depicts that company achieved its highest revenue generation mark in H2 2023. Presenting this PowerPoint presentation, titled Feasibility Analysis Report For Construction Project Year Over Year Revenue Generation Highlights Portrait PDF, with topics curated by our researchers after extensive research. This editable presentation is available for immediate download and provides attractive features when used. Download now and captivate your audience. Presenting this Feasibility Analysis Report For Construction Project Year Over Year Revenue Generation Highlights Portrait PDF. Our researchers have carefully researched and created these slides with all aspects taken into consideration. This is a completely customizable Feasibility Analysis Report For Construction Project Year Over Year Revenue Generation Highlights Portrait PDF that is available for immediate downloading. Download now and make an impact on your audience. Highlight the attractive features available with our PPTs.


Following slide illustrates statistics of revenue generation. It depicts that company achieved its highest revenue generation mark in H2 2020. Here you can discover an assortment of the finest PowerPoint and Google Slides templates. With these templates, you can create presentations for a variety of purposes while simultaneously providing your audience with an eye catching visual experience. Download Construction Project Cost Benefit Analysis Report Year Over Year Revenue Generation Highlights Infographics PDF to deliver an impeccable presentation. These templates will make your job of preparing presentations much quicker, yet still, maintain a high level of quality. Slidegeeks has experienced researchers who prepare these templates and write high quality content for you. Later on, you can personalize the content by editing the Construction Project Cost Benefit Analysis Report Year Over Year Revenue Generation Highlights Infographics PDF.


Take your projects to the next level with our ultimate collection of Revenue Generated From Top Countries Engineering Company Financial Analysis Report Sample PDF. Slidegeeks has designed a range of layouts that are perfect for representing task or activity duration, keeping track of all your deadlines at a glance. Tailor these designs to your exact needs and give them a truly corporate look with your own brand colors they all make your projects stand out from the rest.
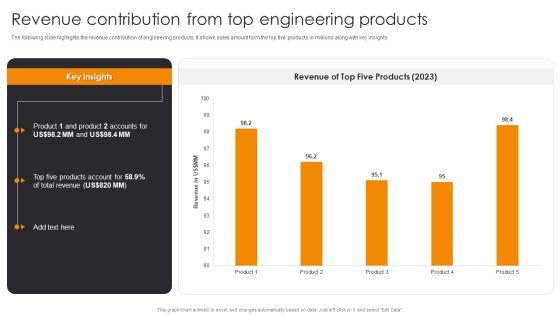
The following slide highlights the revenue contribution of engineering products, It shows sales amount form the top five products in millions along with key insights. This Revenue Contribution From Top Engineering Products Engineering Company Financial Analysis Report Infographics PDF from Slidegeeks makes it easy to present information on your topic with precision. It provides customization options, so you can make changes to the colors, design, graphics, or any other component to create a unique layout. It is also available for immediate download, so you can begin using it right away. Slidegeeks has done good research to ensure that you have everything you need to make your presentation stand out. Make a name out there for a brilliant performance.


The slide shows annual revenue growth of the company with the CAGR for last five financial years from 2019 to 2023 along with key insights.Presenting this PowerPoint presentation, titled Company Revenue 2019 To 2023 Engineering Company Financial Analysis Report Structure PDF, with topics curated by our researchers after extensive research. This editable presentation is available for immediate download and provides attractive features when used. Download now and captivate your audience. Presenting this Company Revenue 2019 To 2023 Engineering Company Financial Analysis Report Structure PDF. Our researchers have carefully researched and created these slides with all aspects taken into consideration. This is a completely customizable Company Revenue 2019 To 2023 Engineering Company Financial Analysis Report Structure PDF that is available for immediate downloading. Download now and make an impact on your audience. Highlight the attractive features available with our PPTs.


The slide shows the graphical representation of sustainable revenue growth for an engineering company. It shows price-adjusted revenue, sustainable revenue and nominal revenue to compare the sales potential of company. Coming up with a presentation necessitates that the majority of the effort goes into the content and the message you intend to convey. The visuals of a PowerPoint presentation can only be effective if it supplements and supports the story that is being told. Keeping this in mind our experts created Engineering Company Sustainable Revenue Growth Engineering Company Financial Analysis Report Clipart PDF to reduce the time that goes into designing the presentation. This way, you can concentrate on the message while our designers take care of providing you with the right template for the situation.


The following slide highlights the real revenue growth of the engineering company for a time period of four years. It shows nominal revenue growth and price-adjusted revenue growth to show the revenue in percentage.Formulating a presentation can take up a lot of effort and time, so the content and message should always be the primary focus. The visuals of the PowerPoint can enhance the presenters message, so our Engineering Company Real Revenue Growth Engineering Company Financial Analysis Report Structure PDF was created to help save time. Instead of worrying about the design, the presenter can concentrate on the message while our designers work on creating the ideal templates for whatever situation is needed. Slidegeeks has experts for everything from amazing designs to valuable content, we have put everything into Engineering Company Real Revenue Growth Engineering Company Financial Analysis Report Structure PDF.


The following slide highlights the business revenue generated by the engineering company in a given year. It shows revenue share from cities, players and geography, Cities include Tier I, Tier II, and Tier III, Players include government and private builders, geography includes north America, Europe and Asia pacific.If you are looking for a format to display your unique thoughts, then the professionally designed Business Services Revenue Generated By Categories Engineering Company Financial Analysis Report Graphics PDF is the one for you. You can use it as a Google Slides template or a PowerPoint template. Incorporate impressive visuals, symbols, images, and other charts. Modify or reorganize the text boxes as you desire. Experiment with shade schemes and font pairings. Alter, share or cooperate with other people on your work. Download Business Services Revenue Generated By Categories Engineering Company Financial Analysis Report Graphics PDF and find out how to give a successful presentation. Present a perfect display to your team and make your presentation unforgettable.
This slide covers dashboard depicting total annual sales in company. It includes key components such as revenue, profit margins, cost incurred, cost breakdown, up sell and churn trends. Showcasing this set of slides titled Sales Attrition Tracking Report With Revenue And Customer Churn Analytics Formats PDF. The topics addressed in these templates are Revenue, Number Of Sales, Profit, Cost. All the content presented in this PPT design is completely editable. Download it and make adjustments in color, background, font etc. as per your unique business setting.


This slide showcases annual report for construction company that provide public disclosure of a organization operating and financial activities. Its key components are growth strategies, financial review, and revenue analysis. Showcasing this set of slides titled Yearly Report For Construction Organization With Revenue Analysis Topics PDF. The topics addressed in these templates are Revenue Analysis, Growth Strategies, Customers. All the content presented in this PPT design is completely editable. Download it and make adjustments in color, background, font etc. as per your unique business setting.


This slide showcases post event report of sales event that can help business to identify the top performing employees and variance in revenue generated. Its key components are event brief, top sold items and revenue earned. Showcasing this set of slides titled Sales Event Post Report Summary With Revenue Generated Portrait PDF. The topics addressed in these templates are Revenue Earned, Top Performers, Revenue Generated. All the content presented in this PPT design is completely editable. Download it and make adjustments in color, background, font etc. as per your unique business setting.


This slide represents snapshot for financial activities. It covers reimbursement contracts, government capital, donation, in-kind contribution, program charge, general expenses etc. Pitch your topic with ease and precision using this Financial Summary Report Activities For Revenue And Expenditure Ppt Inspiration Display PDF. This layout presents information on Government Capital, Other Funds, Program Charge. It is also available for immediate download and adjustment. So, changes can be made in the color, design, graphics or any other component to create a unique layout.


This slide represents corporate financial statement snapshot. It includes income statement, profit, profit and loss trend, expenditure, revenue etc that enables organization to showcase cost incurred. Showcasing this set of slides titled Corporate Financial Summary Report For Revenue Statement Ppt Ideas Graphic Images. The topics addressed in these templates are Income Statement, Net Profit, Expenditure. All the content presented in this PPT design is completely editable. Download it and make adjustments in color, background, font etc. as per your unique business setting.


This slide exhibits revenue and customer progress status report in the project. It includes revenue, the number of new customers, average revenue per customer, and customer acquisition cost. Pitch your topic with ease and precision using this Project Management Revenue And Customer Progress Report Clipart PDF. This layout presents information on Customer Acquisition Cost, Average Revenue, Per Customer. It is also available for immediate download and adjustment. So, changes can be made in the color, design, graphics or any other component to create a unique layout.
Presenting Icon For Business Monthly Revenue Report Summary Of Company Information PDF to dispense important information. This template comprises four stages. It also presents valuable insights into the topics including Icon For Business, Monthly Revenue, Report Summary This is a completely customizable PowerPoint theme that can be put to use immediately. So, download it and address the topic impactfully.


The following slide highlights the monthly hotel revenue report with budget. Where it depicts key headings which includes count, actual average, budget average, last year average, total revenue producing rooms, total rooms occupied and total revenue.Pitch your topic with ease and precision using this Business Monthly Hotel Revenue Report Summary With Budget Download PDF This layout presents information on Revenue Producing, Producing Rooms, Complimentary Rooms It is also available for immediate download and adjustment. So, changes can be made in the color, design, graphics or any other component to create a unique layout.


The slide provides the companys revenue for last three years from three operating segments software for business customers, hardware products, and entertainment.Deliver an awe inspiring pitch with this creative Financial Report Of An IT Firm Companys Segment Financials And Revenue Split Rules PDF bundle. Topics like Software Business, Customers Entertainment, Hardware Products can be discussed with this completely editable template. It is available for immediate download depending on the needs and requirements of the user.


The slide provides the companys revenue for last three years from its geographical segments North America, Europe, Asia, and Rest of the World.Deliver an awe inspiring pitch with this creative Financial Report Of An IT Firm Companys Geographic Financials And Revenue Split Elements PDF bundle. Topics like Companys Geographic, Financials Revenue can be discussed with this completely editable template. It is available for immediate download depending on the needs and requirements of the user.
Presenting Monthly Sales Report Revenue Forecast Icon Inspiration PDF to provide visual cues and insights. Share and navigate important information on four stages that need your due attention. This template can be used to pitch topics like Monthly Sales, Report Revenue, Forecast Icon. In addtion, this PPT design contains high resolution images, graphics, etc, that are easily editable and available for immediate download.


This slide covers digital marketing report which includes revenues, average yield, transaction volumes, with percentage comparison of population, session, and conversion that helps business to know about the marketing progress.Showcasing this set of slides titled Online Marketing Report With Total Revenues Slides PDF The topics addressed in these templates are Online Marketing, Report, Total Revenues All the content presented in this PPT design is completely editable. Download it and make adjustments in color, background, font etc. as per your unique business setting.


The slide provides the companys revenue for last three years from three operating segments software for business customers, hardware products, and entertainment.Deliver and pitch your topic in the best possible manner with this Information Technology Firm Report Example Companys Segment Financials And Revenue Split Diagrams PDF Use them to share invaluable insights on Companys Segment, Financials Revenue, Split and impress your audience. This template can be altered and modified as per your expectations. So, grab it now.


Deliver and pitch your topic in the best possible manner with this iot industrial report summary internet of things iot and analytics revenue 2022 2026 background pdf. Use them to share invaluable insights on internet of things iot and analytics revenue 2022 2026and impress your audience. This template can be altered and modified as per your expectations. So, grab it now.


Showcasing this set of slides titled project management report revenue growth ppt powerpoint presentation icon example pdf. The topics addressed in these templates are target metric, grow revenue, grow leads and conversion, media coverage. All the content presented in this PPT design is completely editable. Download it and make adjustments in color, background, font etc. as per your unique business setting.


Showcasing this set of slides titled ecommerce website functions report with total revenue ppt powerpoint presentation file elements pdf. The topics addressed in these templates are sales by gende, sold products per day, average sales price. All the content presented in this PPT design is completely editable. Download it and make adjustments in color, background, font etc. as per your unique business setting.
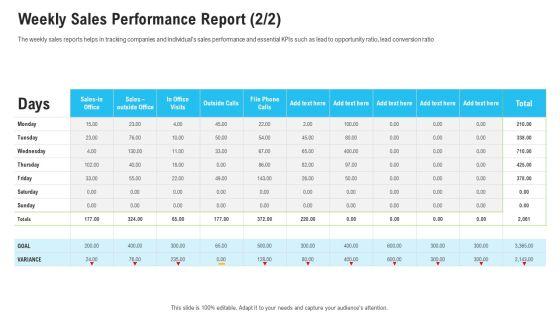
The weekly sales reports helps in tracking companies and individuals sales performance and essential KPIs such as lead to opportunity ratio, lead conversion ratio. Deliver an awe-inspiring pitch with this creative sales department strategies increase revenues weekly sales performance report structure pdf bundle. Topics like weekly sales performance report can be discussed with this completely editable template. It is available for immediate download depending on the needs and requirements of the user.

The weekly sales reports helps in tracking companies and individuals sales performance and essential KPIs such as lead to opportunity ratio, lead conversion ratio, customer lifetime value. Deliver and pitch your topic in the best possible manner with this sales department strategies increase revenues weekly sales performance report leads diagrams pdf. Use them to share invaluable insights on lead to opportunity ratio, customer lifetime value and impress your audience. This template can be altered and modified as per your expectations. So, grab it now.


This graph or chart is linked to excel, and changes automatically based on data. Just left click on it and select edit data. Showcasing this set of slides titled report showing sales revenues data ppt show backgrounds pdf. The topics addressed in these templates are cost and revenues, market research, finance and administration. All the content presented in this PPT design is completely editable. Download it and make adjustments in color, background, font etc. as per your unique business setting.


Showcasing this set of slides titled mobile analytics report with revenue and live activity ppt powerpoint presentation show templates pdf. The topics addressed in these templates are live activity, online users, revenue. All the content presented in this PPT design is completely editable. Download it and make adjustments in color, background, font etc. as per your unique business setting.
SHOW
- 60
- 120
- 180
DISPLAYING: 60 of 96 Item(s)
Page