 AI PPT Maker
 Templates
 PPT Bundles
 Design Services
 Business PPTs
 Business Plan
 Management
 Strategy
 Introduction PPT
 Roadmap
 Self Introduction
 Timelines
 Process
 Marketing
 Agenda
 Technology
 Medical
 Startup Business Plan
 Cyber Security
 Dashboards
 SWOT
SWOT Proposals
 Education
 Pitch Deck
 Digital Marketing
 KPIs
KPIs Project Management
 Product Management
 Artificial Intelligence
 Target Market
 Communication
 Supply Chain
 Google Slides
 Research Services
 One Pagers
 All Categories
Revenue per PowerPoint Presentation Templates and Google Slides
SHOW
- 60
- 120
- 180
DISPLAYING: 60 of 300 Item(s)
Page


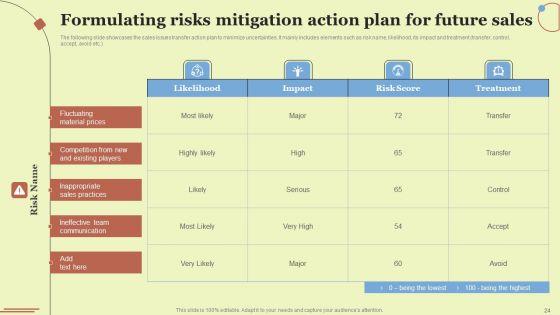

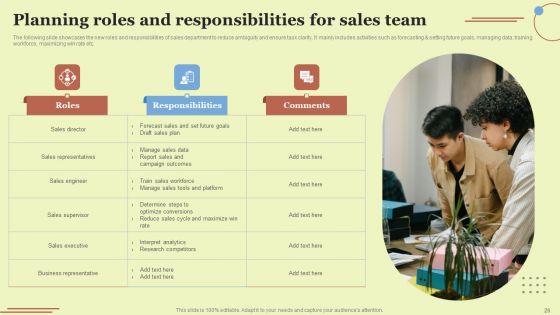


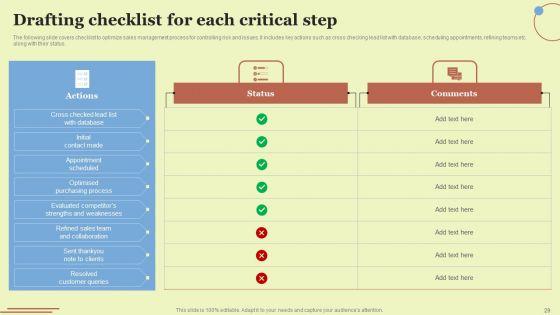


In business, sometimes the end result can be completely different from what stakeholders visualized. This Performing Sales Risk Analysis To Increase Revenue Ppt PowerPoint Presentation Complete Deck With Slides details the study of enterprise and problem solving as a fundamental area of getting the desired outcomes. Stakeholders need to be convinced of how to proceed and change through this wonderful PPT presentation. The idea guiding this complete deck of fifty one presentation slides is to ensure that dealing with change and unexpected results becomes easy. The area of focus for this change can be customized with the 100 percent editable and customizable nature of each of the slides in our presentation. Download now.


Take advantage of this well researched and professionally designed Periodic Revenue Model Ppt PowerPoint Presentation Complete Deck With Slides to ace your next business meeting. Use this PPT complete deck to impress the management with your ideas for business growth and revenue increase. Use the fifty slide Template Bundle to leave no stone unturned as you present each step of your process. Employ the visual tools within the slides such as graphs, charts, and tables to ensure that the audience can never look away from the presentation. With attractive visuals, easy to understand structure, and your knowledge, your presentation will have the attention it deserves. Download this PPT Template from the link below.


This key performance indicator tree variable revenue ppt powerpoint presentation complete deck with slides acts as backup support for your ideas, vision, thoughts, etc. Use it to present a thorough understanding of the topic. This PPT slideshow can be utilized for both in-house and outside presentations depending upon your needs and business demands. Entailing twelve slides with a consistent design and theme, this template will make a solid use case. As it is intuitively designed, it suits every business vertical and industry. All you have to do is make a few tweaks in the content or any other component to design unique presentations. The biggest advantage of this complete deck is that it can be personalized multiple times once downloaded. The color, design, shapes, and other elements are free to modify to add personal touches. You can also insert your logo design in this PPT layout. Therefore a well-thought and crafted presentation can be delivered with ease and precision by downloading this key performance indicator tree variable revenue ppt powerpoint presentation complete deck with slides PPT slideshow.
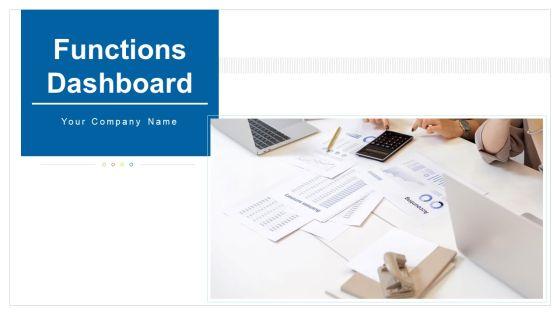

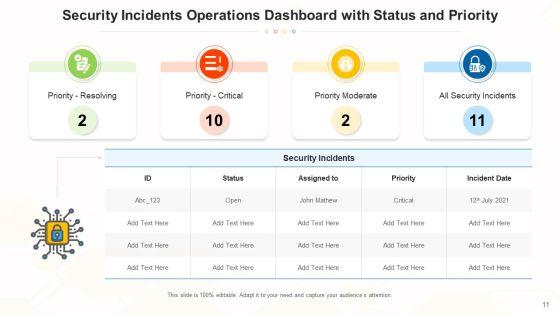

Improve your presentation delivery using this functions dashboard performance revenue ppt powerpoint presentation complete deck with slides. Support your business vision and objectives using this well-structured PPT deck. This template offers a great starting point for delivering beautifully designed presentations on the topic of your choice. Comprising twelve this professionally designed template is all you need to host discussion and meetings with collaborators. Each slide is self-explanatory and equipped with high-quality graphics that can be adjusted to your needs. Therefore, you will face no difficulty in portraying your desired content using this PPT slideshow. This PowerPoint slideshow contains every important element that you need for a great pitch. It is not only editable but also available for immediate download and utilization. The color, font size, background, shapes everything can be modified to create your unique presentation layout. Therefore, download it now.


Boost your confidence and team morale with this well-structured client lifecycle performance revenue ppt powerpoint presentation complete deck with slides. This prefabricated set gives a voice to your presentation because of its well-researched content and graphics. Our experts have added all the components very carefully, thus helping you deliver great presentations with a single click. Not only that, it contains a set of twelve slides that are designed using the right visuals, graphics, etc. Various topics can be discussed, and effective brainstorming sessions can be conducted using the wide variety of slides added in this complete deck. Apart from this, our PPT design contains clear instructions to help you restructure your presentations and create multiple variations. The color, format, design anything can be modified as deemed fit by the user. Not only this, it is available for immediate download. So, grab it now.


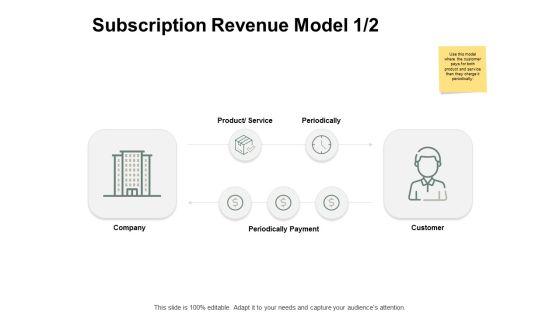


Presenting this set of slides with name subscription revenue model periodically ppt powerpoint presentation professional inspiration. The topics discussed in these slides are business, management, planning, strategy, marketing. This is a completely editable PowerPoint presentation and is available for immediate download. Download now and impress your audience.


Presenting this set of slides with name marketing percentage revenue ppt powerpoint presentation model visuals cpb. This is a six stage process. The stages in this process are marketing percentage revenue. This is a completely editable PowerPoint presentation and is available for immediate download. Download now and impress your audience.


This slide outlines existing scenario of spa and wellness business yearly financial performance to assess profit or loss in company. It assess performance based on elements such as revenue, net income and gross profit. Do you have to make sure that everyone on your team knows about any specific topic I yes, then you should give Spa Marketing Strategy Boost Reservations Enhance Revenue Current Financial Performance Analysis Mockup PDF a try. Our experts have put a lot of knowledge and effort into creating this impeccable Spa Marketing Strategy Boost Reservations Enhance Revenue Current Financial Performance Analysis Mockup PDF. You can use this template for your upcoming presentations, as the slides are perfect to represent even the tiniest detail. You can download these templates from the Slidegeeks website and these are easy to edit. So grab these today.


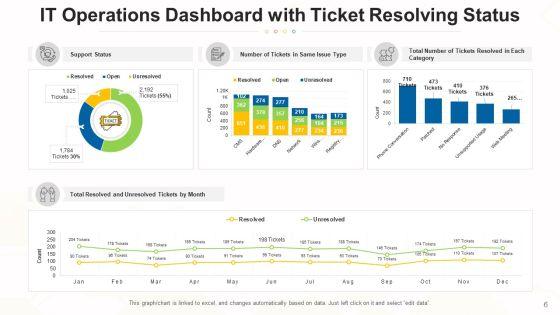
This slide shows dashboard which can be used by organizations to measure the results of sales plan. It includes metrics such as sales per product, actual vs target sales, sales by region, sales by channel, etc. Boost your pitch with our creative Boosting Yearly Business Revenue KPI Dashboard To Track Sales Plan Performance Topics PDF. Deliver an awe-inspiring pitch that will mesmerize everyone. Using these presentation templates you will surely catch everyones attention. You can browse the ppts collection on our website. We have researchers who are experts at creating the right content for the templates. So you dont have to invest time in any additional work. Just grab the template now and use them.


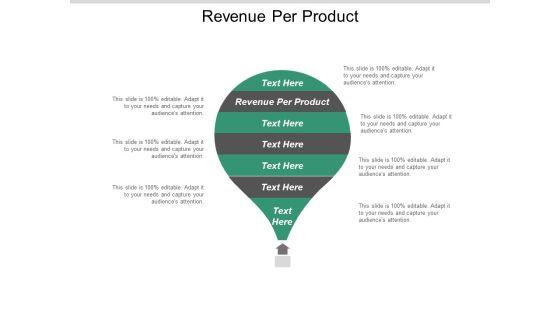
Following slide includes information about revenue earned by business by every employee. It includes key components such as revenue in US dollars and years. Retrieve professionally designed Coffee Cafe Company Profile Revenue Earned By Business Per Employee Formats PDF to effectively convey your message and captivate your listeners. Save time by selecting pre made slideshows that are appropriate for various topics, from business to educational purposes. These themes come in many different styles, from creative to corporate, and all of them are easily adjustable and can be edited quickly. Access them as PowerPoint templates or as Google Slides themes. You do not have to go on a hunt for the perfect presentation because Slidegeeks got you covered from everywhere.


Create an editable Strategic Brand Promotion For Enhanced Recognition And Revenue Growth Product Marketing Performance Overview Slides PDF that communicates your idea and engages your audience. Whether youre presenting a business or an educational presentation, pre designed presentation templates help save time. Strategic Brand Promotion For Enhanced Recognition And Revenue Growth Product Marketing Performance Overview Slides PDF is highly customizable and very easy to edit, covering many different styles from creative to business presentations. Slidegeeks has creative team members who have crafted amazing templates. So, go and get them without any delay.


This slide represents industry analysis and performance assessment for real estate market to build business plan. It covers generations buying properties, mortgages, consumer spending etc. If your project calls for a presentation, then Slidegeeks is your go to partner because we have professionally designed, easy to edit templates that are perfect for any presentation. After downloading, you can easily edit Strategies For Flipping Houses For Maximum Revenue Real Estate Industry Analysis For Performance Evaluation Brochure PDF and make the changes accordingly. You can rearrange slides or fill them with different images. Check out all the handy templates


The following slide showcases the competitive assessment of organizations sales and revenues to evaluate the gap and compare metrics. It includes pie chart representing performance along with key insights etc. Take your projects to the next level with our ultimate collection of Competitive Analysis Of Sales And Revenue Performance Elements PDF. Slidegeeks has designed a range of layouts that are perfect for representing task or activity duration, keeping track of all your deadlines at a glance. Tailor these designs to your exact needs and give them a truly corporate look with your own brand colors they will make your projects stand out from the rest.


The following slide showcases the competitive assessment of organizations sales and revenues to evaluate the gap and compare metrics. It includes pie chart representing performance along with key insights etc. Find a pre designed and impeccable Mitigating Sales Risks With Strategic Action Planning Competitive Analysis Of Sales And Revenue Performance Slides PDF. The templates can ace your presentation without additional effort. You can download these easy to edit presentation templates to make your presentation stand out from others. So, what are you waiting for Download the template from Slidegeeks today and give a unique touch to your presentation.


The following slide highlights the quarterly revenue generated from each customer. The average revenue depicted is from domestic customers, international customers and Disney plus Hotstar customers. Take your projects to the next level with our ultimate collection of Company Profile For Online Video Service Provider Average Revenue Per Customer Guidelines PDF. Slidegeeks has designed a range of layouts that are perfect for representing task or activity duration, keeping track of all your deadlines at a glance. Tailor these designs to your exact needs and give them a truly corporate look with your own brand colors they will make your projects stand out from the rest.


This slide showcase donut chart of revenue an expenses occurred towards running an organization. It includes elements such as foundations, contracts payroll, benefits, fundraising, worker wages etc. Showcasing this set of slides titled Organization Revenue And Expenditure Financial Performance Report Inspiration PDF. The topics addressed in these templates are Expenses, Revenue Worker Wages. All the content presented in this PPT design is completely editable. Download it and make adjustments in color, background, font etc. as per your unique business setting.


This slide showcase revenue trends of four different product and suggestions to boost revenue. It includes elements such as product A, product B , product C, product D along with key highlights and revenue projection. Showcasing this set of slides titled Financial Revenue Trends Analysis Performance Report Designs PDF. The topics addressed in these templates are Revenue, Innovative Design, Latest Trend. All the content presented in this PPT design is completely editable. Download it and make adjustments in color, background, font etc. as per your unique business setting.


The purpose of the following slide is to provide the projections for the subscriber count for the next 3 years. Get a simple yet stunning designed Periodic Revenue Model Subscriber Count Projections Formats PDF. It is the best one to establish the tone in your meetings. It is an excellent way to make your presentations highly effective. So, download this PPT today from Slidegeeks and see the positive impacts. Our easy to edit Periodic Revenue Model Subscriber Count Projections Formats PDF can be your go to option for all upcoming conferences and meetings. So, what are you waiting for Grab this template today.


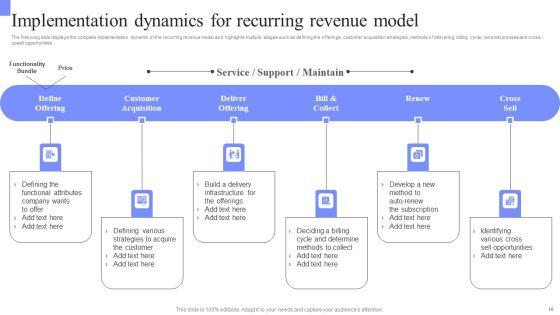
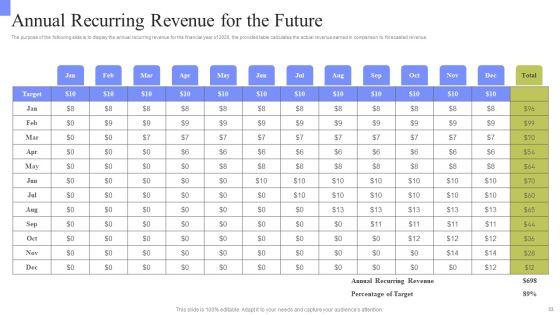
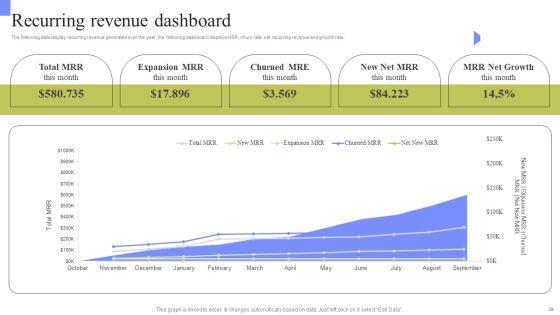
The following slide display recurring revenue generated over the year, the following dashboard displays MRR, churn rate net recurring revenue and growth rate. Slidegeeks is one of the best resources for PowerPoint templates. You can download easily and regulate Periodic Revenue Model Recurring Revenue Dashboard Infographics PDF for your personal presentations from our wonderful collection. A few clicks is all it takes to discover and get the most relevant and appropriate templates. Use our Templates to add a unique zing and appeal to your presentation and meetings. All the slides are easy to edit and you can use them even for advertisement purposes.


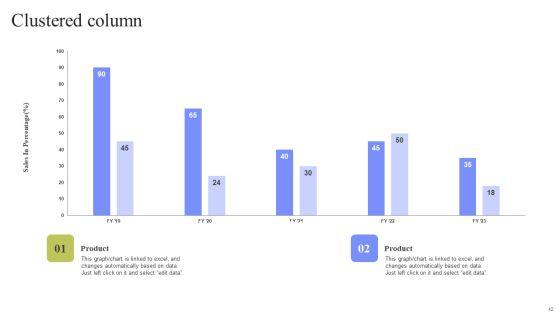
The purpose of the following slide is to analyze the financial performance of the organization. The provided graph highlight the revenues, Gross profit and net profit margin of the organization for the year 2016,17,18 and 19. Create an editable Periodic Revenue Model Our Financial Performance Over The Year Themes PDF that communicates your idea and engages your audience. Whether youre presenting a business or an educational presentation, pre designed presentation templates help save time. Periodic Revenue Model Our Financial Performance Over The Year Themes PDF is highly customizable and very easy to edit, covering many different styles from creative to business presentations. Slidegeeks has creative team members who have crafted amazing templates. So, go and get them without any delay.


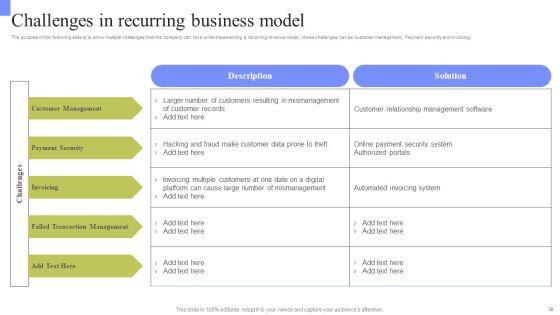
The purpose of the following slide is to show churn rate of the organization of the next 4 years and highlight the strategies that can be used to reduce the churn rate. Do you know about Slidesgeeks Periodic Revenue Model Customer Churn Rate For Recurring Revenue Model Diagrams PDF. These are perfect for delivering any kind od presentation. Using it, create PowerPoint presentations that communicate your ideas and engage audiences. Save time and effort by using our pre designed presentation templates that are perfect for a wide range of topic. Our vast selection of designs covers a range of styles, from creative to business, and are all highly customizable and easy to edit. Download as a PowerPoint template or use them as Google Slides themes.


The following slide display a business performance dashboard that highlights the average revenue per unit, customer Acquisition Cost and profit earned. This Periodic Revenue Model Business Performance Dashboard Rules PDF from Slidegeeks makes it easy to present information on your topic with precision. It provides customization options, so you can make changes to the colors, design, graphics, or any other component to create a unique layout. It is also available for immediate download, so you can begin using it right away. Slidegeeks has done good research to ensure that you have everything you need to make your presentation stand out. Make a name out there for a brilliant performance.


The purpose of the following slide is to show the account expansion and contraction forecast for the financial year of 2023. Presenting this PowerPoint presentation, titled Periodic Revenue Model Account Expansion And Contraction Prediction Summary PDF, with topics curated by our researchers after extensive research. This editable presentation is available for immediate download and provides attractive features when used. Download now and captivate your audience. Presenting this Periodic Revenue Model Account Expansion And Contraction Prediction Summary PDF. Our researchers have carefully researched and created these slides with all aspects taken into consideration. This is a completely customizable Periodic Revenue Model Account Expansion And Contraction Prediction Summary PDF that is available for immediate downloading. Download now and make an impact on your audience. Highlight the attractive features available with our PPTs.


The slide highlights the historical revenue for food products, beverage and dairy products revenue with CAGR. It showcases key insights for revenue describing growth trend for each category. Boost your pitch with our creative Food Company Financial Performance Summary Revenue By Category Introduction PDF. Deliver an awe-inspiring pitch that will mesmerize everyone. Using these presentation templates you will surely catch everyones attention. You can browse the ppts collection on our website. We have researchers who are experts at creating the right content for the templates. So you do not have to invest time in any additional work. Just grab the template now and use them.


The slide shows annual revenue growth of the company with the CAGR for last five financial years from 2019 to 2023 along with key insights. Take your projects to the next level with our ultimate collection of Food Company Financial Performance Summary Historical Revenue 2019 2023 Background PDF. Slidegeeks has designed a range of layouts that are perfect for representing task or activity duration, keeping track of all your deadlines at a glance. Tailor these designs to your exact needs and give them a truly corporate look with your own brand colors they will make your projects stand out from the rest


The slide highlights the revenue generated from the USA and rest of the world in US dollar from 2019 to 2023. It showcases key insights describing revenue trend. Retrieve professionally designed Food Company Financial Performance Summary Business Revenue Generation By Geographical Area Elements PDF to effectively convey your message and captivate your listeners. Save time by selecting pre-made slideshows that are appropriate for various topics, from business to educational purposes. These themes come in many different styles, from creative to corporate, and all of them are easily adjustable and can be edited quickly. Access them as PowerPoint templates or as Google Slides themes. You do not have to go on a hunt for the perfect presentation because Slidegeeks got you covered from everywhere.


This one page covers about quarterly revenue generations comparable with previous year and revenue analysis from various channels. Presenting you an exemplary Quarterly Sales Performance In Comparison With Revenue Analysis One Pager Documents. Our one-pager comprises all the must-have essentials of an inclusive document. You can edit it with ease, as its layout is completely editable. With such freedom, you can tweak its design and other elements to your requirements. Download this Quarterly Sales Performance In Comparison With Revenue Analysis One Pager Documents brilliant piece now.


Planning Sales Campaign To Improve Impact Assessment With Sales Revenue Performance Introduction PDF
This slide provides glimpse about impact analysis of revenue performance after implementation of new sales plan. It includes parameters such as sales revenue, sales target achievement, unsold inventory, etc. This modern and well-arranged Planning Sales Campaign To Improve Impact Assessment With Sales Revenue Performance Introduction PDF provides lots of creative possibilities. It is very simple to customize and edit with the Powerpoint Software. Just drag and drop your pictures into the shapes. All facets of this template can be edited with Powerpoint, no extra software is necessary. Add your own material, put your images in the places assigned for them, adjust the colors, and then you can show your slides to the world, with an animated slide included.


The following slide showcases the competitive assessment of organizations sales and revenues to evaluate the gap and compare metrics. It includes pie chart representing performance along with key insights etc. Slidegeeks is one of the best resources for PowerPoint templates. You can download easily and regulate Sales Risk Assessment For Profit Maximization Competitive Analysis Of Sales And Revenue Performance Introduction PDF for your personal presentations from our wonderful collection. A few clicks is all it takes to discover and get the most relevant and appropriate templates. Use our Templates to add a unique zing and appeal to your presentation and meetings. All the slides are easy to edit and you can use them even for advertisement purposes.


The purpose of the following slide is to analyze the financial performance of the organization. The provided graph highlight the revenues, Gross profit and net profit margin of the organization for the year 2020,21,22 and 23. Are you in need of a template that can accommodate all of your creative concepts This one is crafted professionally and can be altered to fit any style. Use it with Google Slides or PowerPoint. Include striking photographs, symbols, depictions, and other visuals. Fill, move around, or remove text boxes as desired. Test out color palettes and font mixtures. Edit and save your work, or work with colleagues. Download Membership Based Revenue Plan Our Financial Performance Over The Year Mockup PDF and observe how to make your presentation outstanding. Give an impeccable presentation to your group and make your presentation unforgettable.


The following slide display a business performance dashboard that highlights the average revenue per unit, customer Acquisition Cost and profit earned. There are so many reasons you need a Membership Based Revenue Plan Business Performance Dashboard Ideas PDF. The first reason is you cant spend time making everything from scratch, Thus, Slidegeeks has made presentation templates for you too. You can easily download these templates from our website easily.


Pitch your topic with ease and precision using this Branch Performance Evaluation Management Dashboard With Revenue And Product Mockup PDF. This layout presents information on Five Revenue, Revenue Product, Total Revenue. It is also available for immediate download and adjustment. So, changes can be made in the color, design, graphics or any other component to create a unique layout.


The slides showcases tips for enhancing branchs workforce performance and efficiency. It covers utilize transaction analysis data, schedule idle time, incent staff for efficiency, get bottom support and use part-time staff.Persuade your audience using this Best Practices To Improve Branch Workforce Performance Evaluation And Efficiency Introduction PDF. This PPT design covers five stages, thus making it a great tool to use. It also caters to a variety of topics including Market Opportunities, Customer Branch, Unnecessary Labor. Download this PPT design now to present a convincing pitch that not only emphasizes the topic but also showcases your presentation skills.


The following slide exhibits dashboard to maintain revenue and management under control. It presents information related to profits, cross selling, costs, etc. Pitch your topic with ease and precision using this Weekly Sales Performance KPI Dashboard For Revenue Generation Brochure PDF. This layout presents information on Total Sales, Revenue, Profit, Cost. It is also available for immediate download and adjustment. So, changes can be made in the color, design, graphics or any other component to create a unique layout.


This slide covers sales and revenue generated by a business entity. It also includes elements such profits earned, cost incurred, marketing and sales cost breakdown, annual sales revenue graph, sales generated through social media, revenue from up OR cross selling, etc. Pitch your topic with ease and precision using this Company Sales And Revenue Performance Analysis Ppt Ideas Format PDF. This layout presents information on Total Sales, Revenue Generation, Profit Earned, Cost Incurred. It is also available for immediate download and adjustment. So, changes can be made in the color, design, graphics or any other component to create a unique layout.


The slide highlights the historical revenue split for software company since its inception and revenue share for current year based on geography. Do you have an important presentation coming up Are you looking for something that will make your presentation stand out from the rest Look no further than Revenue Split By Geography Financial Performance Report Of Software Firm Background PDF. With our professional designs, you can trust that your presentation will pop and make delivering it a smooth process. And with Slidegeeks, you can trust that your presentation will be unique and memorable. So why wait Grab Revenue Split By Geography Financial Performance Report Of Software Firm Background PDF today and make your presentation stand out from the rest.
SHOW
- 60
- 120
- 180
DISPLAYING: 60 of 300 Item(s)
Page