AI PPT Maker
Templates
PPT Bundles
Design Services
Business PPTs
Business Plan
Management
Strategy
Introduction PPT
Roadmap
Self Introduction
Timelines
Process
Marketing
Agenda
Technology
Medical
Startup Business Plan
Cyber Security
Dashboards
SWOT
Proposals
Education
Pitch Deck
Digital Marketing
KPIs
Project Management
Product Management
Artificial Intelligence
Target Market
Communication
Supply Chain
Google Slides
Research Services
One Pagers
All Categories
Revenue Graph PowerPoint Presentation Templates and Google Slides
SHOW
- 60
- 120
- 180
DISPLAYING: 60 of 256 Item(s)
Page


Slide 1 of 7
This is a financials base plan for revenue analysis powerpoint slide graphics. This is a three stage process. The stages in this process are kp, revenue, cost of sales, gross profit, customer acquisition cost, other operating cost expense, operating profit, change in cash, ending cash, employees ftes.


Slide 1 of 7
This is a sales and marketing plan for revenue analysis powerpoint slide graphics. This is a three stage process. The stages in this process are online, advertising, market research, blog, website, mobile app, mobile alerts, online, print, outdoor, radio, television, surveys, impact studies.


Slide 1 of 7
This is a revenue growth assessment example powerpoint slide graphics. This is a four stage process. The stages in this process are sales benchmark index, strategy, systems, marketing, sales.


Slide 1 of 7
This is a revenue collection presentation graphics. This is a four stage process. The stages in this process are supply chain management, general government, internal risk management and mitigation, revenue collection.


Slide 1 of 6
This is a waterfall graph showing sales expenses revenue and taxes ppt powerpoint presentation pictures summary. This is a three stage process. The stages in this process are profit and loss, balance sheet, income statement, benefit and loss.


Slide 1 of 6
This is a year by year sales revenue and unit profitability graph ppt powerpoint presentation show professional. This is a eight stage process. The stages in this process are business unit profitability, profitable organization, corporate unit profitability.


Slide 1 of 5
Presenting this set of slides with name target revenue with graph icon ppt powerpoint presentation portfolio elements. This is a one stage process. The stages in this process are target revenue, target dollar revenue, businessmen shows. This is a completely editable PowerPoint presentation and is available for immediate download. Download now and impress your audience.


Slide 1 of 5
Presenting this set of slides with name finance revenue deposits ppt powerpoint presentation portfolio graphic images. This is a two stage process. The stages in this process are revenue, deposits, net income, management, marketing. This is a completely editable PowerPoint presentation and is available for immediate download. Download now and impress your audience.


Slide 1 of 5
Presenting this set of slides with name healthcare industry revenue cycle ppt powerpoint presentation professional graphics design. This is a five stage process. The stages in this process are patient registration, insurance eligibility, analytics, claims management, medical coding. This is a completely editable PowerPoint presentation and is available for immediate download. Download now and impress your audience.


Slide 1 of 5
Presenting this set of slides with name hook and bait revenue model ppt powerpoint presentation outline graphics tutorials. The topics discussed in these slides are marketing, business, management, planning, strategy. This is a completely editable PowerPoint presentation and is available for immediate download. Download now and impress your audience.


Slide 1 of 5
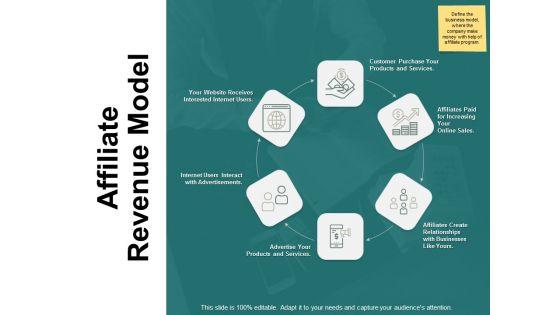
Presenting this set of slides with name affiliate revenue model ppt powerpoint presentation styles graphics design. This is a six stage process. The stages in this process are businesses, advertisements, online sales, management, marketing. This is a completely editable PowerPoint presentation and is available for immediate download. Download now and impress your audience.


Slide 1 of 5
Presenting this set of slides with name types of revenue model ppt powerpoint presentation graphics. The topics discussed in these slides are marketing, business, management, planning, strategy. This is a completely editable PowerPoint presentation and is available for immediate download. Download now and impress your audience.


Slide 1 of 5
Presenting this set of slides with name revenue models dollar ppt powerpoint presentation icon graphics example. The topics discussed in these slides are marketing, business, management, planning, strategy. This is a completely editable PowerPoint presentation and is available for immediate download. Download now and impress your audience.


Slide 1 of 5
Presenting this set of slides with name healthcare industry revenue cycle ppt powerpoint presentation file graphic tips. This is a five stage process. The stages in this process are submission, management, analytics, revenue, gears. This is a completely editable PowerPoint presentation and is available for immediate download. Download now and impress your audience.


Slide 1 of 5
Presenting this set of slides with name disaster categories and its impact on revenue ppt powerpoint presentation file graphics. The topics discussed in these slides are business, management, planning, strategy, marketing. This is a completely editable PowerPoint presentation and is available for immediate download. Download now and impress your audience.


Slide 1 of 5
Presenting this set of slides with name ecommerce business and revenue models icon slide ppt powerpoint presentation outline graphic images. The topics discussed in these slides are business, management, planning, strategy, marketing. This is a completely editable PowerPoint presentation and is available for immediate download. Download now and impress your audience.


Slide 1 of 5
Presenting this set of slides with name advertising revenue model ppt powerpoint presentation summary graphics. This is a four stage process. The stages in this process are business, content, media, revenue, management. This is a completely editable PowerPoint presentation and is available for immediate download. Download now and impress your audience.


Slide 1 of 5
Presenting this set of slides with name increasing revenue intent b2b marketing ppt powerpoint presentation file graphics pictures cpb. This is a three stage process. The stages in this process are increasing revenue intent b2b marketing. This is a completely editable PowerPoint presentation and is available for immediate download. Download now and impress your audience.


Slide 1 of 5
Presenting this set of slides with name revenue forecast vector icon ppt powerpoint presentation infographics graphics pictures. The topics discussed in these slides are financial analysis, balance sheet, income statement. This is a completely editable PowerPoint presentation and is available for immediate download. Download now and impress your audience.


Slide 1 of 5
This is a project revenue recognition ppt powerpoint presentation infographic template graphic images cpb. This is a three stage process. The stages in this process are project revenue recognition.


Slide 1 of 5
This is a revenue recognition management ppt powerpoint presentation summary graphic tips cpb. This is a four stage process. The stages in this process are revenue recognition management.


Slide 1 of 5
This is a revenue streams ppt powerpoint presentation professional graphics design. This is a four stage process. The stages in this process are business, management, marketing, process.


Slide 1 of 5
This is a retails store revenue projection business ppt powerpoint presentation file graphics download. This is a four stage process. The stages in this process are comparison, planning, marketing, finance, strategy.


Slide 1 of 5
This is a track revenue investment ppt powerpoint presentation outline graphics cpb. This is a six stage process. The stages in this process are track revenue investment.


Slide 1 of 5
This is a roadmap revenue ppt powerpoint presentation outline graphics download cpb. This is a six stage process. The stages in this process are roadmap revenue.


Slide 1 of 5
This is a revenue storm pricing ppt powerpoint presentation layouts graphics. This is a four stage process. The stages in this process are revenue storm pricing.


Slide 1 of 5
This is a revenue forecasting ppt powerpoint presentation outline graphics design cpb. This is a four stage process. The stages in this process are revenue forecasting.


Slide 1 of 5
This is a revenue management ppt powerpoint presentation gallery graphic tips cpb. This is a four stage process. The stages in this process are revenue management.


Slide 1 of 5
This is a planning revenue generation ppt powerpoint presentation layouts graphics example cpb. This is a seven stage process. The stages in this process are planning revenue generation, business, process, management, marketing.


Slide 1 of 5
This is a cost and revenue assessment ppt powerpoint presentation ideas graphics download. This is a three stage process. The stages in this process are cost benefit analysis, cost benefit investigation, cost benefit examination.


Slide 1 of 5
This is a business management checklist revenue model examples sells promotion ppt powerpoint presentation graphics. This is a six stage process. The stages in this process are business management checklist, revenue model examples, sells promotion.


Slide 1 of 5
This is a revenue streams ppt powerpoint presentation infographic template graphics template. This is a six stage process. The stages in this process are advertising, sales commission, subscription, affiliate, sponsored content.


Slide 1 of 5
This is a revenue model ppt powerpoint presentation outline graphics download. This is a five stage process. The stages in this process are who is your primary customer and how do you make money, life time value of an average customer, show basic math on revenues and conversion rates, what is the pricing model.


Slide 1 of 5
This is a revenue streams ppt powerpoint presentation gallery graphic images. This is a six stage process. The stages in this process are advertising, sales commission, subscription, affiliate, sponsored content.


Slide 1 of 5
This is a revenue model ppt powerpoint presentation outline graphics design. This is a five stage process. The stages in this process are icons, marketing, strategy, planning, shapes.


Slide 1 of 5
This is a competitor revenue and profit ppt powerpoint presentation professional graphics pictures. This is a five stage process. The stages in this process are business, marketing, strategy, graph, finance.


Slide 1 of 5
This is a revenue split by product and segment ppt powerpoint presentation outline graphic images. This is a two stage process. The stages in this process are revenue by product, revenue by segment, segment, alloy steel, carbon steel.


Slide 1 of 5
This is a revenue model ppt powerpoint presentation styles graphic images. This is a five stage process. The stages in this process are pricing, recurring revenue frequency, expected conversion rate to get a paid client, expected, cost to acquire a customer.


Slide 1 of 5
This is a revenue model ppt powerpoint presentation slides graphics pictures. This is a five stage process. The stages in this process are business, cost to acquire a customer, recurring revenue frequency, expected arpu, pricing.


Slide 1 of 5
This is a revenue split by product segment template ppt powerpoint presentation icon graphics download. This is a four stage process. The stages in this process are table, business, marketing, data, management.


Slide 1 of 5
This is a revenue split by geography ppt powerpoint presentation show graphics pictures. This is a five stage process. The stages in this process are location, management, planning, strategy, success.


Slide 1 of 5
This is a revenue split by product segment template 2 ppt powerpoint presentation ideas graphic images. This is a four stage process. The stages in this process are business, marketing, finance, graph, strategy.


Slide 1 of 5
This is a revenue split by country ppt powerpoint presentation infographic template graphic images. This is a five stage process. The stages in this process are usa, brazil, africa, australia, russia.


Slide 1 of 5
This is a revenue split by country ppt powerpoint presentation layouts graphics template. This is a five stage process. The stages in this process are north america, brazil, africa, russia, australia.


Slide 1 of 5
This is a revenue model ppt powerpoint presentation layouts graphics tutorials. This is a six stage process. The stages in this process are pricing, estimated yearly revenue, recurring revenue frequency, expected arpu.


Slide 1 of 5
This is a monthly run revenue ppt powerpoint presentation ideas graphics template. This is a two stage process. The stages in this process are business, finance, marketing, management, graph.


Slide 1 of 5
This is a competitor analysis competitor revenue and profit graph ppt powerpoint presentation gallery vector. This is a five stage process. The stages in this process are bar graph, marketing, management, business, presentation.


Slide 1 of 5
This is a revenue cost per employee comparison ppt powerpoint presentation icon graphics tutorials. This is a two stage process. The stages in this process are revenue and cost per employee comparison, line chart, business, marketing, success,


Slide 1 of 5
This is a revenue split by product and segment ppt powerpoint presentation portfolio graphics pictures. This is a six stage process. The stages in this process are pricing, recurring revenue frequency, expected conversion rate to get a paid client, life time value of a customer, expected arpu.


Slide 1 of 5
This is a revenue split by product segment ppt powerpoint presentation ideas graphics. This is a four stage process. The stages in this process are business, marketing, bar graph, success.


Slide 1 of 5
This is a revenue split by product segment template ppt powerpoint presentation graphics. This is a four stage process. The stages in this process are product, business, marketing, planning, process.


Slide 1 of 5
This is a revenue streams template 2 ppt powerpoint presentation file graphic images. This is a six stage process. The stages in this process are pricing, estimated yearly revenue, expected arpu, recurring revenue frequency, expected conversion rate to get a paid client, life time value of a customer.


Slide 1 of 5
This is a competitor analysis competitor revenue and profit graph ppt powerpoint presentation inspiration. This is a five stage process. The stages in this process are business, marketing, management, profit, revenue.


Slide 1 of 5
This is a bar graph for sales revenue over the years ppt powerpoint presentation professional. This is a nine stage process. The stages in this process are business, marketing, growth, bar, years.


Slide 1 of 5
This is a improving business revenue bar graph ppt powerpoint presentation infographic template. This is a six stage process. The stages in this process are graph, arrow, finance, percentage, success.


Slide 1 of 5
This is a graphical representation for total business revenue ppt powerpoint presentation diagrams. This is a nine stage process. The stages in this process are business, strategy, line chart, bar graph, marketing, management.


Slide 1 of 4
This is a financial revenue analysis growth bar graph powerpoint slide download. This is a twelve stage process. The stages in this process are bar graph, business, marketing, growth, success.


Slide 1 of 4
This is a revenue growth for bar graph ppt examples slides. This is a five stage process. The stages in this process are bar graph, years, business, growth, marketing.


Slide 1 of 4
This is a prospective sources of revenue powerpoint slide graphics. This is a five stage process. The stages in this process are potential sources of revenue.


Slide 1 of 2
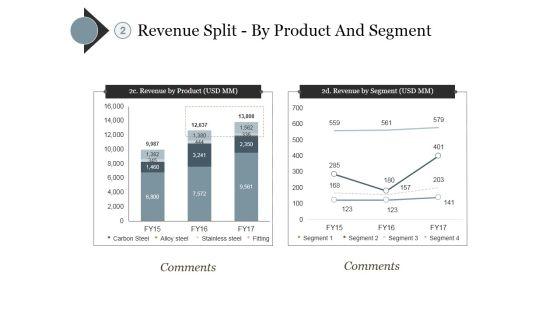
This slide represents the revenue split by geography which shows highest revenue from United States and industry such as real estate and construction, media and entertainment, etc. Do you have to make sure that everyone on your team knows about any specific topic I yes, then you should give Website Design And Development Services Company Profile Revenue Split By Geography Graphics PDF a try. Our experts have put a lot of knowledge and effort into creating this impeccable Website Design And Development Services Company Profile Revenue Split By Geography Graphics PDF. You can use this template for your upcoming presentations, as the slides are perfect to represent even the tiniest detail. You can download these templates from the Slidegeeks website and these are easy to edit. So grab these today.
SHOW
- 60
- 120
- 180
DISPLAYING: 60 of 256 Item(s)
Page