 AI PPT Maker
 Templates
 PPT Bundles
 Design Services
 Business PPTs
 Business Plan
 Management
 Strategy
 Introduction PPT
 Roadmap
 Self Introduction
 Timelines
 Process
 Marketing
 Agenda
 Technology
 Medical
 Startup Business Plan
 Cyber Security
 Dashboards
 SWOT
SWOT Proposals
 Education
 Pitch Deck
 Digital Marketing
 KPIs
KPIs Project Management
 Product Management
 Artificial Intelligence
 Target Market
 Communication
 Supply Chain
 Google Slides
 Research Services
 One Pagers
 All Categories
Revenue comparison PowerPoint Presentation Templates and Google Slides
SHOW
- 60
- 120
- 180
DISPLAYING: 60 of 115 Item(s)
Page


Boost your confidence and team morale with this well-structured Revenue Comparison Ppt PowerPoint Presentation Complete Deck With Slides. This prefabricated set gives a voice to your presentation because of its well-researched content and graphics. Our experts have added all the components very carefully, thus helping you deliver great presentations with a single click. Not only that, it contains a set of forteen slides that are designed using the right visuals, graphics, etc. Various topics can be discussed, and effective brainstorming sessions can be conducted using the wide variety of slides added in this complete deck. Apart from this, our PPT design contains clear instructions to help you restructure your presentations and create multiple variations. The color, format, design anything can be modified as deemed fit by the user. Not only this, it is available for immediate download. So, grab it now.


If designing a presentation takes a lot of your time and resources and you are looking for a better alternative, then this Cost Of Goods And Revenue Comparison Ppt PowerPoint Presentation Complete Deck With Slides is the right fit for you. This is a prefabricated set that can help you deliver a great presentation on the topic. All the eleven slides included in this sample template can be used to present a birds-eye view of the topic. These slides are also fully editable, giving you enough freedom to add specific details to make this layout more suited to your business setting. Apart from the content, all other elements like color, design, theme are also replaceable and editable. This helps in designing a variety of presentations with a single layout. Not only this, you can use this PPT design in formats like PDF, PNG, and JPG once downloaded. Therefore, without any further ado, download and utilize this sample presentation as per your liking.


This slide shows the KPI dashboard of the catering industry to evaluate the actual and potential targets. It includes KPIs such as expenditure, sales revenue, beverage, etc. Showcasing this set of slides titled Catering Business Advertisement Plan KPI Dashboard With Revenue Comparison Icons PDF. The topics addressed in these templates are Expenditure, Revenue Comparison, Department. All the content presented in this PPT design is completely editable. Download it and make adjustments in color, background, font etc. as per your unique business setting.


The slide showcases the operating revenue, total expenses, profit and loss, and cash from operations. It compares all the financial parameters for the financial year 2021 and 2022. Want to ace your presentation in front of a live audience Our Annual Operating Revenue And Total Expenses Comparison Ppt Infographic Template Rules PDF can help you do that by engaging all the users towards you.. Slidegeeks experts have put their efforts and expertise into creating these impeccable powerpoint presentations so that you can communicate your ideas clearly. Moreover, all the templates are customizable, and easy-to-edit and downloadable. Use these for both personal and commercial use.


The purpose of this slide is to outline the comparison of revenue growth rates of cloud based companies year over year. It includes three companies along with growth line and average of total revenue generated. Showcasing this set of slides titled Year Over Year Comparison Of Cloud Revenue Growth Sample PDF. The topics addressed in these templates are Yoy Growth Rates, Generated, Growth Reported. All the content presented in this PPT design is completely editable. Download it and make adjustments in color, background, font etc. as per your unique business setting.


The purpose of this slide is to showcase a comprehensive overview of the international big data market evolution serving the most valuable contribution to revenue growth along with key insights. Pitch your topic with ease and precision using this Big Data Global Market Revenue Annual Comparison Structure PDF. This layout presents information on Market Revenues, Global Market, Growing Trend. It is also available for immediate download and adjustment. So, changes can be made in the color, design, graphics or any other component to create a unique layout.


The slide shows the key comparison of revenues generated from projects and services delivered to clients. Presenting you a fantastic Three Year Revenues Comparison Template 328 One Pager Documents. This piece is crafted on hours of research and professional design efforts to ensure you have the best resource. It is completely editable and its design allow you to rehash its elements to suit your needs. Get this Three Year Revenues Comparison Template 328 One Pager Documents A4 One-pager now.


This one page covers about quarterly revenue generations comparable with previous year and revenue analysis from various channels. Presenting you an exemplary Quarterly Sales Performance In Comparison With Revenue Analysis One Pager Documents. Our one-pager comprises all the must-have essentials of an inclusive document. You can edit it with ease, as its layout is completely editable. With such freedom, you can tweak its design and other elements to your requirements. Download this Quarterly Sales Performance In Comparison With Revenue Analysis One Pager Documents brilliant piece now.


The slide shows the key comparison of revenues generated from projects and services delivered to clients. Presenting you a fantastic Three Year Revenues Comparison One Pager Documents. This piece is crafted on hours of research and professional design efforts to ensure you have the best resource. It is completely editable and its design allow you to rehash its elements to suit your needs. Get this Three Year Revenues Comparison One Pager Documents A4 One-pager now.


The following slide shows the comparison of the revenue share by business segments of a software company. It includes services and solutions revenue share for 2019 and 2023 along with key insights. There are so many reasons you need a Business Segments Revenue Earning Comparison Financial Performance Report Of Software Firm Topics PDF. The first reason is you can not spend time making everything from scratch, Thus, Slidegeeks has made presentation templates for you too. You can easily download these templates from our website easily.


This slide showcases profitability comparison with the help of a trend chart. It represents revenue, cost of goods sold, gross profit, net profit, etc. Pitch your topic with ease and precision using this Two Consecutive Years Revenue Comparison Topics PDF. This layout presents information on Revenue, Gross Profit, Net Income. It is also available for immediate download and adjustment. So, changes can be made in the color, design, graphics or any other component to create a unique layout.


This slide showcases a comprehensive P and L report for representing the financial outcomes. It also helps to take financial performance management decisions. It includes financial analysis KPIs such as p and l statements, p and l structure dynamics, sales or margin quality performance analysis, DUPONT ratio, etc. Showcasing this set of slides titled Quarterly Revenue And Loss Statement Comparison Dashboard Portrait PDF. The topics addressed in these templates are Profitability, Debt Coverage Ratios, Margin Quality Performa. All the content presented in this PPT design is completely editable. Download it and make adjustments in color, background, font etc. as per your unique business setting.


This slide displays the budget analysis report comparing the budget with the actual year to date data. It also helps in making estimations for the remaining year. It includes variance between budgeted and actual gross margin results, service revenue, profit margin, product revenue, payroll cost, etc. Pitch your topic with ease and precision using this Budget Analysis Dashboard With Actual And Forecasted Revenue Comparison Structure PDF. This layout presents information on Payroll Cost, Budget Revenue Components, Product Revenue. It is also available for immediate download and adjustment. So, changes can be made in the color, design, graphics or any other component to create a unique layout.


This slide showcases a comparison chart with monthly new customers, revenue, profits, and profit margins. It also includes the profit categorization based on set standards. Showcasing this set of slides titled Annual Revenue Margin Comparison Sheet Information PDF. The topics addressed in these templates are Customers, Revenue, Profit Margin. All the content presented in this PPT design is completely editable. Download it and make adjustments in color, background, font etc. as per your unique business setting.


This slide covers a profitability dashboard for analyzing gross margin and net profit metrics. It includes evaluation charts such as actual vs budgeted gross profit, net profit, trends, variance analysis table for the selected month and year. Pitch your topic with ease and precision using this Actual Vs Budgeted Gross And Net Revenue Comparison Report Sample PDF. This layout presents information on Gross Profit, Net Profit, Budget. It is also available for immediate download and adjustment. So, changes can be made in the color, design, graphics or any other component to create a unique layout.


This slide showcases the half yearly profit comparison dashboard. It also includes comparison kp is such as monthly profit, profit margin growth, branch profit percentage, top 3 profitable products, etc. Showcasing this set of slides titled 6 Months Company Revenue Comparison Dashboard Graphics PDF. The topics addressed in these templates are Growth Rate, Overall Profit Margin, Branch Profit. All the content presented in this PPT design is completely editable. Download it and make adjustments in color, background, font etc. as per your unique business setting.


This slide shows the details of the revenues and operating expenses of the company hat has occurred and that will be occurred in the future. It also includes the comparison of historical as well as forecasted data for 5 years.Showcasing this set of slides titled Revenue And Operation Expenses Comparison Chart Slides PDF. The topics addressed in these templates are Continuous Increase, Operating Cost, Enhancement Ultimately. All the content presented in this PPT design is completely editable. Download it and make adjustments in color, background, font etc. as per your unique business setting.


This slide shows the comparison between actual and forecasted revenue of e-commerce company products. Showcasing this set of slides titled Actual And Forecasted E Commerce Revenue Analysis Comparison Clipart PDF. The topics addressed in these templates are Actual Revenue, Forecasted Revenue, Bearish Market. All the content presented in this PPT design is completely editable. Download it and make adjustments in color, background, font etc. as per your unique business setting.
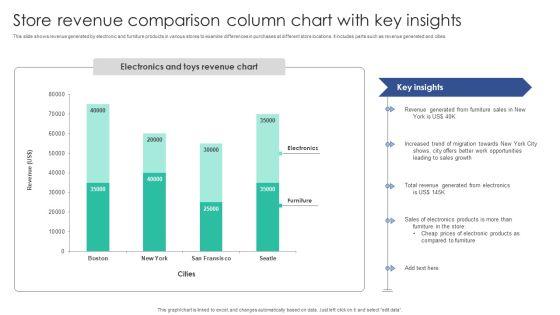

This slide shows revenue generated by electronic and furniture products in various stores to examine differences in purchases at different store locations. It includes parts such as revenue generated and cities. Showcasing this set of slides titled Store Revenue Comparison Column Chart With Key Insights Themes PDF. The topics addressed in these templates are Revenue Generated, Furniture Sales, Increased Trend. All the content presented in this PPT design is completely editable. Download it and make adjustments in color, background, font etc. as per your unique business setting.


This slide shows revenue comparison chart of product sales in various companies to understand profitability of business. It includes companies and revenues. Showcasing this set of slides titled Sales Revenue Comparison Stacked Bar Graph Mockup PDF. The topics addressed in these templates are Sales Revenue Comparison, Revenue From Clothing, Revenue From Equipment. All the content presented in this PPT design is completely editable. Download it and make adjustments in color, background, font etc. as per your unique business setting.


This slide shows monthly revenue of three clothing brands. It includes the profit comparison of top brands of clothing sector Showcasing this set of slides titled Revenue Chart Comparison Of Top Players In Clothing Market Ppt Infographics Skills PDF. The topics addressed in these templates are Revenue, Brand, Key Insights. All the content presented in this PPT design is completely editable. Download it and make adjustments in color, background, font etc. as per your unique business setting.


This slide covers the comparison of social media networks on the basis of revenue for 2022 which showcases Facebook being most popular platform as compared to others. Deliver an awe inspiring pitch with this creative Social Platforms Revenue Comparison Facebook Business Outline Download PDF bundle. Topics like Revenue, Social Media Networks can be discussed with this completely editable template. It is available for immediate download depending on the needs and requirements of the user.


The following slide highlights the transportation carrier comparison dashboard with revenue depicting truck turnaround time, transit time, average revenue per month, average revenue per mile, utilized truck capacity and on time pick up for selection of desired transport services. Pitch your topic with ease and precision using this Logistics KPI Carrier Comparison Dashboard With Revenue Ppt Infographics Portfolio PDF. This layout presents information on Truck Turnaround Time, Average Revenue, Per Month, Transit Time. It is also available for immediate download and adjustment. So, changes can be made in the color, design, graphics or any other component to create a unique layout.


Showcasing this set of slides titled Product Performance Comparison Graph Showing Revenue Growth Portrait PDF. The topics addressed in these templates are Sales Revenue, Product. All the content presented in this PPT design is completely editable. Download it and make adjustments in color, background, font etc. as per your unique business setting.


This graph or chart is linked to excel, and changes automatically based on data. Just left click on it and select Edit Data. Showcasing this set of slides titled Business Revenue Performance Comparison Highlights Ppt Summary Rules PDF. The topics addressed in these templates are Customer Acquisition, Customer Actual, Revenue Compared. All the content presented in this PPT design is completely editable. Download it and make adjustments in color, background, font etc. as per your unique business setting.


The slide provides the comparison of revenue and operating expenses for the year 2016 to 2021 historical and 2022 to 2025 forecasted. Deliver an awe inspiring pitch with this creative fundraising from corporate investment revenue and operating expenses comparison historical pictures pdf bundle. Topics like net revenue, operating cost can be discussed with this completely editable template. It is available for immediate download depending on the needs and requirements of the user.


This slide shows the startup valuation method comparison details such as net present value, discounted payback method, internal rate of return method, etc. Deliver an awe inspiring pitch with this creative valuing a pre revenue startup business startup valuation method comparison details with results guidelines pdf bundle. Topics like startup valuation method comparison details with results can be discussed with this completely editable template. It is available for immediate download depending on the needs and requirements of the user.


This slide shows the market comparison methods for startup companies such as industry details, niche, founder experience, company location, etc. Deliver and pitch your topic in the best possible manner with this valuing a pre revenue startup business market comparison methods for startup companies designs pdf. Use them to share invaluable insights on market comparison methods for startup companies and impress your audience. This template can be altered and modified as per your expectations. So, grab it now.


This slide provides information regarding the comparison of win and lost opportunities in terms of duration associated to them. Deliver an awe inspiring pitch with this creative sales funnel management for revenue generation comparison between win and lost elements pdf bundle. Topics like estimating outcomes, opportunities are not extending, pipeline and the probability can be discussed with this completely editable template. It is available for immediate download depending on the needs and requirements of the user.
The slide provides the comparative graph of companys revenue and expenses for last 5 years historical and coming 4 years forecasted.Deliver and pitch your topic in the best possible manner with this revenue and expenses comparison historical and projection ppt icon files pdf. Use them to share invaluable insights on financials, 2016 to 2025, revenue, operating expenses and impress your audience. This template can be altered and modified as per your expectations. So, grab it now.


Presenting comparison revenue decrease of a beverage company ppt layouts background image pdf to provide visual cues and insights. Share and navigate important information on two stages that need your due attention. This template can be used to pitch topics like male users, female users. In addtion, this PPT design contains high resolution images, graphics, etc, that are easily editable and available for immediate download.


The slide provides the comparative graph of companys revenue and expenses for last 5 years historical and coming 4 years forecasted. Deliver an awe inspiring pitch with this creative revenue and expenses comparison historical and projection mockup pdf bundle. Topics like financials, revenue, expenses can be discussed with this completely editable template. It is available for immediate download depending on the needs and requirements of the user.


The slide provides the comparison of revenue and operating expenses for the year 2015 - 2020 historical and 2021 - 2024 forecasted. Deliver an awe inspiring pitch with this creative revenue and operating expenses comparison historical vs forecasted summary pdf bundle. Topics like net revenue, operating cost, operating expenses can be discussed with this completely editable template. It is available for immediate download depending on the needs and requirements of the user.


Deliver an awe inspiring pitch with this creative after hours trading revenue and expenses comparison historical and projection microsoft pdf bundle. Topics like revenue and expenses comparison historical and projection can be discussed with this completely editable template. It is available for immediate download depending on the needs and requirements of the user.


The slide provides the comparative graph of companys revenue and expenses for last 5 years historical and coming 4 years forecasted. Deliver an awe inspiring pitch with this creative investment fundraising pitch deck from stock market revenue and expenses comparison historical and projection infographics pdf bundle. Topics like financials, historical, forecasted, revenue, expenses can be discussed with this completely editable template. It is available for immediate download depending on the needs and requirements of the user.


This slide shows the revenue and expenses total of interest and non-interest expenses comparison of the companys historical 2016-2020 and forecasted 2021-2024 data. Deliver and pitch your topic in the best possible manner with this revenue and expenses comparison historical vs forecasted ppt show tips pdf. Use them to share invaluable insights on revenue, expenses and impress your audience. This template can be altered and modified as per your expectations. So, grab it now.


This slide shows the revenue and expenses total of interest and non-interest expenses comparison of the companys historical 2015-2019 and forecasted 2020-2023 data. Deliver an awe inspiring pitch with this creative post initial public offering equity financing pitch revenue and expenses comparison historical vs forecasted summary pdf bundle. Topics like revenue and expenses comparison historical vs forecasted, 2015 to 203 can be discussed with this completely editable template. It is available for immediate download depending on the needs and requirements of the user.


This slide shows the revenue and expenses total of interest and non interest expenses comparison of the companys historical 2015 2019 and forecasted 2020 2023 data. Deliver and pitch your topic in the best possible manner with this revenue and expenses comparison historical vs forecasted microsoft pdf. Use them to share invaluable insights on revenue and expenses comparison historical vs forecasted and impress your audience. This template can be altered and modified as per your expectations. So, grab it now.


Presenting strategic plan to increase sales volume and revenue comparison clipart pdf to provide visual cues and insights. Share and navigate important information on two stages that need your due attention. This template can be used to pitch topics like female, male. In addtion, this PPT design contains high resolution images, graphics, etc, that are easily editable and available for immediate download.


The slide provides the comparison of revenue and operating expenses for the year 2015 2020 historical and 2021 2024 forecasted. Deliver an awe-inspiring pitch with this creative revenue and operating expenses comparison historical vs forecasted pictures pdf. bundle. Topics like revenue and operating expenses comparison historical vs forecasted can be discussed with this completely editable template. It is available for immediate download depending on the needs and requirements of the user.


The slide provides the comparison of revenue and operating expenses for the year 2015 2020 historical and 2021 2024 forecasted. Deliver an awe-inspiring pitch with this creative revenue and operating expenses comparison historical vs forecasted background pdf. bundle. Topics like revenue and operating expenses comparison historical vs forecasted can be discussed with this completely editable template. It is available for immediate download depending on the needs and requirements of the user.


This slide shows the revenue and expenses total of interest and non-interest expenses comparison of the companys historical 2015-2019 and forecasted 2020-2023 data. Deliver an awe-inspiring pitch with this creative after ipo equity revenue and expenses comparison historical vs forecasted slides pdf bundle. Topics like revenue and expenses comparison historical vs forecasted can be discussed with this completely editable template. It is available for immediate download depending on the needs and requirements of the user.


The slide provides the comparison of revenue and operating expenses for the year 2015 2020 historical and 2021 2024 forecasted. Deliver an awe inspiring pitch with this creative revenue and operating expenses comparison historical vs forecasted ppt summary clipart pdf bundle. Topics like revenue and operating expenses comparison historical vs forecasted can be discussed with this completely editable template. It is available for immediate download depending on the needs and requirements of the user.


The slide provides the comparative graph of companys revenue and expenses for last 5 years historical and coming 4 years forecasted. Deliver and pitch your topic in the best possible manner with this revenue and expenses comparison historical and projection ppt layouts grid pdf. Use them to share invaluable insights on financials, operating expenses, revenue and impress your audience. This template can be altered and modified as per your expectations. So, grab it now.


The slide provides the comparative graph of companys revenue and expenses for last 5 years historical and coming 4 years forecasted. Deliver and pitch your topic in the best possible manner with this cash market investor deck revenue and expenses comparison historical and projection ppt professional information pdf. Use them to share invaluable insights on financials, revenue, operating expenses, 2016 to 2025 and impress your audience. This template can be altered and modified as per your expectations. So, grab it now.


This slide shows the revenue and expenses total of interest and non interest expenses comparison of the companys historical 2016 to2020 and forecasted 2021 to2024 data.Deliver and pitch your topic in the best possible manner with this revenue and expenses comparison historical vs forecasted ppt show deck pdf. Use them to share invaluable insights on 2015 to 2024, revenue and impress your audience. This template can be altered and modified as per your expectations. So, grab it now.


This slide shows the revenue and expenses total of interest and non-interest expenses comparison of the companys historical 2015 to 2019 and forecasted 2020 to 2023 data.Deliver an awe-inspiring pitch with this creative revenue and expenses comparison historical vs forecasted ppt show outfit pdf. bundle. Topics like 2015 to 2024, revenue can be discussed with this completely editable template. It is available for immediate download depending on the needs and requirements of the user


The slide provides the comparative graph of companys revenue and expenses for last 5 years historical and coming 4 years forecasted. Deliver an awe inspiring pitch with this creative revenue and expenses comparison historical and projection designs pdf bundle. Topics like revenue and expenses comparison historical and projection can be discussed with this completely editable template. It is available for immediate download depending on the needs and requirements of the user.


The slide provides the comparative graph of companys revenue and expenses for last 5 years historical and coming 4 years forecasted. Deliver an awe inspiring pitch with this creative funding pitch to raise funds from pe revenue and expenses comparison historical and projection summary pdf bundle. Topics like financials, historical, forecasted, revenue, expenses can be discussed with this completely editable template. It is available for immediate download depending on the needs and requirements of the user.


The sales department compares the sales figures of two years. This comparison will help firm in analyzing how well the department is performing between two years. Deliver an awe-inspiring pitch with this creative sales department strategies increase revenues sales comparison year over year infographics pdf bundle. Topics like sales comparison year over year can be discussed with this completely editable template. It is available for immediate download depending on the needs and requirements of the user.


Presenting sales department strategies increase revenues comparison ppt infographics inspiration pdf to provide visual cues and insights. Share and navigate important information on three stages that need your due attention. This template can be used to pitch topics like comparison. In addition, this PPT design contains high-resolution images, graphics, etc, that are easily editable and available for immediate download.


This is a lowering sales revenue a telecommunication firm case competition comparison ppt summary visuals pdf template with various stages. Focus and dispense information on two stages using this creative set, that comes with editable features. It contains large content boxes to add your information on topics like comparison, male, female. You can also showcase facts, figures, and other relevant content using this PPT layout. Grab it now.


the slide provides the comparative graph of companys revenue and expenses for last 5 years historical and coming 4 years forecasted Deliver and pitch your topic in the best possible manner with this pitch deck to attract funding after ipo market revenue and expenses comparison historical and projection topics pdf. Use them to share invaluable insights on historical, forecasted, financials and impress your audience. This template can be altered and modified as per your expectations. So, grab it now.


The slide provides the comparative graph of companys revenue and expenses for last 5 years historical and coming 4 years forecasted.Deliver and pitch your topic in the best possible manner with this revenue and expenses comparison historical and projection ppt show slide download pdf. Use them to share invaluable insights on financials, 2016 to 2025, revenue, operating expenses and impress your audience. This template can be altered and modified as per your expectations. So, grab it now.


Deliver an awe inspiring pitch with this creative revenue comparison of cruise industry 2020 forecast vs restated brochure pdf bundle. Topics like revenue comparison of cruise industry 2020 forecast vs restate can be discussed with this completely editable template. It is available for immediate download depending on the needs and requirements of the user.


The slide provides the comparative graph of companys revenue and expenses for last 5 years historical and coming 4 years forecasted. Deliver and pitch your topic in the best possible manner with this pitch deck to raise funding from secondary market revenue and expenses comparison historical and projection summary pdf. Use them to share invaluable insights on financials, revenue, operating expenses and impress your audience. This template can be altered and modified as per your expectations. So, grab it now.


The slide provides the comparative graph of companys revenue and expenses for last 5 years historical and coming 4 years forecasted.Deliver an awe-inspiring pitch with this creative revenue and expenses comparison historical and projection ppt styles graphics design pdf. bundle. Topics like financials, 2016 to 2025, revenue, operating expenses can be discussed with this completely editable template. It is available for immediate download depending on the needs and requirements of the user.
SHOW
- 60
- 120
- 180
DISPLAYING: 60 of 115 Item(s)
Page