 AI PPT Maker
 Templates
 PPT Bundles
 Design Services
 Business PPTs
 Business Plan
 Management
 Strategy
 Introduction PPT
 Roadmap
 Self Introduction
 Timelines
 Process
 Marketing
 Agenda
 Technology
 Medical
 Startup Business Plan
 Cyber Security
 Dashboards
 SWOT
SWOT Proposals
 Education
 Pitch Deck
 Digital Marketing
 KPIs
KPIs Project Management
 Product Management
 Artificial Intelligence
 Target Market
 Communication
 Supply Chain
 Google Slides
 Research Services
 One Pagers
 All Categories
Revenue analysis PowerPoint Presentation Templates and Google Slides
SHOW
- 60
- 120
- 180
DISPLAYING: 60 of 259 Item(s)
Page


In business, sometimes the end result can be completely different from what stakeholders visualized. This Performing Sales Risk Analysis To Increase Revenue Ppt PowerPoint Presentation Complete Deck With Slides details the study of enterprise and problem solving as a fundamental area of getting the desired outcomes. Stakeholders need to be convinced of how to proceed and change through this wonderful PPT presentation. The idea guiding this complete deck of fifty one presentation slides is to ensure that dealing with change and unexpected results becomes easy. The area of focus for this change can be customized with the 100 percent editable and customizable nature of each of the slides in our presentation. Download now.


Share a great deal of information on the topic by deploying this Revenue Comparative Analysis Ppt PowerPoint Presentation Complete With Slides. Support your ideas and thought process with this prefabricated set. It includes a set of tweleve slides, all fully modifiable and editable. Each slide can be restructured and induced with the information and content of your choice. You can add or remove large content boxes as well, to make this PPT slideshow more personalized. Its high-quality graphics and visuals help in presenting a well-coordinated pitch. This PPT template is also a resourceful tool to take visual cues from and implement the best ideas to help your business grow and expand. The main attraction of this well-formulated deck is that everything is editable, giving you the freedom to adjust it to your liking and choice. Changes can be made in the background and theme as well to deliver an outstanding pitch. Therefore, click on the download button now to gain full access to this multifunctional set.


Share a great deal of information on the topic by deploying this competitors revenue statement analysis expenses ppt powerpoint presentation complete deck with slides. Support your ideas and thought process with this prefabricated set. It includes a set of twelve slides, all fully modifiable and editable. Each slide can be restructured and induced with the information and content of your choice. You can add or remove large content boxes as well, to make this PPT slideshow more personalized. Its high-quality graphics and visuals help in presenting a well-coordinated pitch. This PPT template is also a resourceful tool to take visual cues from and implement the best ideas to help your business grow and expand. The main attraction of this well-formulated deck is that everything is editable, giving you the freedom to adjust it to your liking and choice. Changes can be made in the background and theme as well to deliver an outstanding pitch. Therefore, click on the download button now to gain full access to this multifunctional set.


This is a financials base plan for revenue analysis powerpoint slide graphics. This is a three stage process. The stages in this process are kp, revenue, cost of sales, gross profit, customer acquisition cost, other operating cost expense, operating profit, change in cash, ending cash, employees ftes.


This is a market size segmentation with revenue analysis ppt design. This is a two stage process. The stages in this process are in team of users, in team of revenue from customers, target market target market, tam, sam, we are planning to acquire users first and then paid customer, advertisers, event organizers, mentors.


This slide outlines existing scenario of spa and wellness business yearly financial performance to assess profit or loss in company. It assess performance based on elements such as revenue, net income and gross profit. Do you have to make sure that everyone on your team knows about any specific topic I yes, then you should give Spa Marketing Strategy Boost Reservations Enhance Revenue Current Financial Performance Analysis Mockup PDF a try. Our experts have put a lot of knowledge and effort into creating this impeccable Spa Marketing Strategy Boost Reservations Enhance Revenue Current Financial Performance Analysis Mockup PDF. You can use this template for your upcoming presentations, as the slides are perfect to represent even the tiniest detail. You can download these templates from the Slidegeeks website and these are easy to edit. So grab these today.


This slide showcases an analysis of current market share and revenue of own brand and competitors to ascertain position within the industry with relevant key insights. The best PPT templates are a great way to save time, energy, and resources. Slidegeeks have 100 percent editable powerpoint slides making them incredibly versatile. With these quality presentation templates, you can create a captivating and memorable presentation by combining visually appealing slides and effectively communicating your message. Download Enterprise Leaders Technique To Achieve Market Control Current Market Share And Revenue Analysis Brochure PDF from Slidegeeks and deliver a wonderful presentation.


This slide showcases dashboard that can help restaurant keep track of revenue generated from food and beverages. Its key elements are revenue by location, top expenses, revenue by type etc Are you in need of a template that can accommodate all of your creative concepts This one is crafted professionally and can be altered to fit any style. Use it with Google Slides or PowerPoint. Include striking photographs, symbols, depictions, and other visuals. Fill, move around, or remove text boxes as desired. Test out color palettes and font mixtures. Edit and save your work, or work with colleagues. Download Marketing Initiatives To Promote Fast Food Cafe Food And Beverages Revenue Analysis Dashboard Demonstration PDF and observe how to make your presentation outstanding. Give an impeccable presentation to your group and make your presentation unforgettable.


This slide highlights the Company Products Analysis with different segments which includes grooming, beauty care, home care and health care which showcases product revenue growth and return on assets. Here you can discover an assortment of the finest PowerPoint and Google Slides templates. With these templates, you can create presentations for a variety of purposes while simultaneously providing your audience with an eye catching visual experience. Download Company Product Analysis With Revenue Growth And Return On Assets Portrait PDF to deliver an impeccable presentation. These templates will make your job of preparing presentations much quicker, yet still, maintain a high level of quality. Slidegeeks has experienced researchers who prepare these templates and write high quality content for you. Later on, you can personalize the content by editing the Company Product Analysis With Revenue Growth And Return On Assets Portrait PDF.


This slide represents rental market analysis that helps investors and buyers evaluate and compare properties. It covers job market trends, property prices, price to rent ratio etc. Are you in need of a template that can accommodate all of your creative concepts This one is crafted professionally and can be altered to fit any style. Use it with Google Slides or PowerPoint. Include striking photographs, symbols, depictions, and other visuals. Fill, move around, or remove text boxes as desired. Test out color palettes and font mixtures. Edit and save your work, or work with colleagues. Download Strategies For Flipping Houses For Maximum Revenue Real Estate Rental Market Analysis Determine Property Value Download PDF and observe how to make your presentation outstanding. Give an impeccable presentation to your group and make your presentation unforgettable.


This slide represents industry analysis and performance assessment for real estate market to build business plan. It covers generations buying properties, mortgages, consumer spending etc. If your project calls for a presentation, then Slidegeeks is your go to partner because we have professionally designed, easy to edit templates that are perfect for any presentation. After downloading, you can easily edit Strategies For Flipping Houses For Maximum Revenue Real Estate Industry Analysis For Performance Evaluation Brochure PDF and make the changes accordingly. You can rearrange slides or fill them with different images. Check out all the handy templates


This slide represents neighborhood assessment that helps investors to calculate investment potential for a property. It covers home value, population, employment rate, income level etc. Do you have an important presentation coming up Are you looking for something that will make your presentation stand out from the rest Look no further than Strategies For Flipping Houses For Maximum Revenue Neighborhood Analysis To Assess Investment Potential Rules PDF. With our professional designs, you can trust that your presentation will pop and make delivering it a smooth process. And with Slidegeeks, you can trust that your presentation will be unique and memorable. So why wait Grab Strategies For Flipping Houses For Maximum Revenue Neighborhood Analysis To Assess Investment Potential Rules PDF today and make your presentation stand out from the rest.


This slide highlights the company products analysis with different segments which includes grooming, beauty care, home care and health care which showcases product revenue growth and return on assets. Find highly impressive Company Product Analysis With Revenue Growth And Return On Assets Rules PDF on Slidegeeks to deliver a meaningful presentation. You can save an ample amount of time using these presentation templates. No need to worry to prepare everything from scratch because Slidegeeks experts have already done a huge research and work for you. You need to download Company Product Analysis With Revenue Growth And Return On Assets Rules PDF for your upcoming presentation. All the presentation templates are 100 percent editable and you can change the color and personalize the content accordingly. Download now.


The following slide showcases the competitive assessment of organizations sales and revenues to evaluate the gap and compare metrics. It includes pie chart representing performance along with key insights etc. Take your projects to the next level with our ultimate collection of Competitive Analysis Of Sales And Revenue Performance Elements PDF. Slidegeeks has designed a range of layouts that are perfect for representing task or activity duration, keeping track of all your deadlines at a glance. Tailor these designs to your exact needs and give them a truly corporate look with your own brand colors they will make your projects stand out from the rest.


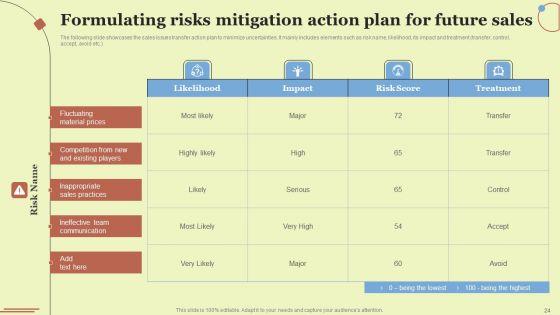
The following slide showcases the competitive assessment of organizations sales and revenues to evaluate the gap and compare metrics. It includes pie chart representing performance along with key insights etc. Find a pre designed and impeccable Mitigating Sales Risks With Strategic Action Planning Competitive Analysis Of Sales And Revenue Performance Slides PDF. The templates can ace your presentation without additional effort. You can download these easy to edit presentation templates to make your presentation stand out from others. So, what are you waiting for Download the template from Slidegeeks today and give a unique touch to your presentation.


This slide covers a graphical representation of coca- colas revenue contribution from the smallest 200 brands and the biggest 200 brands. It also includes key insights such as brand portfolio strategy key focus, etc. Take your projects to the next level with our ultimate collection of Coca Cola Brand Portfolio Strategy Brands Revenue Contribution Analysis Formats PDF. Slidegeeks has designed a range of layouts that are perfect for representing task or activity duration, keeping track of all your deadlines at a glance. Tailor these designs to your exact needs and give them a truly corporate look with your own brand colors they will make your projects stand out from the rest.


This slide showcase revenue trends of four different product and suggestions to boost revenue. It includes elements such as product A, product B , product C, product D along with key highlights and revenue projection. Showcasing this set of slides titled Financial Revenue Trends Analysis Performance Report Designs PDF. The topics addressed in these templates are Revenue, Innovative Design, Latest Trend. All the content presented in this PPT design is completely editable. Download it and make adjustments in color, background, font etc. as per your unique business setting.


This slide focuses on financial highlights of Web design company which represents revenue and net profit for last five years from 2018 to 2022. There are so many reasons you need a Website Design And Development Services Company Profile Revenue And Net Profit Analysis Formats PDF. The first reason is you can not spend time making everything from scratch, Thus, Slidegeeks has made presentation templates for you too. You can easily download these templates from our website easily.


This slide showcases dashboard that can help organization to analyze the total products shipped of different categories and identify the revenue generated. Its key components are warehousing costs, number of items in stock and total revenue. Pitch your topic with ease and precision using this Product Logistics Management And Revenue Analysis Dashboard Demonstration PDF. This layout presents information on Warehouse Costs, Shipping Revenue Country, Shipped Products . It is also available for immediate download and adjustment. So, changes can be made in the color, design, graphics or any other component to create a unique layout.


This slide showcases shipping dashboard that can help company to calculate the revenue generated from delivered products and track the monthly order status. Its key components are highest revenue days, subscription revenue, order status, order revenue and transaction paid status. Showcasing this set of slides titled Logistics Management Revenue Analysis Dashboard With Orders Revenue Brochure PDF. The topics addressed in these templates are Order Revenue, Transaction Paid, Subscription Revenue. All the content presented in this PPT design is completely editable. Download it and make adjustments in color, background, font etc. as per your unique business setting.


This one page covers about quarterly revenue generations comparable with previous year and revenue analysis from various channels. Presenting you an exemplary Quarterly Sales Performance In Comparison With Revenue Analysis One Pager Documents. Our one-pager comprises all the must-have essentials of an inclusive document. You can edit it with ease, as its layout is completely editable. With such freedom, you can tweak its design and other elements to your requirements. Download this Quarterly Sales Performance In Comparison With Revenue Analysis One Pager Documents brilliant piece now.


This slide showcases dashboard that can help restaurant to keep track revenue generated from food and beverages. Its key elements are revenue by location, top expenses, revenue by type etc. This Strategic Promotional Guide For Restaurant Business Advertising Food And Beverages Revenue Analysis Dashboard Template PDF from Slidegeeks makes it easy to present information on your topic with precision. It provides customization options, so you can make changes to the colors, design, graphics, or any other component to create a unique layout. It is also available for immediate download, so you can begin using it right away. Slidegeeks has done good research to ensure that you have everything you need to make your presentation stand out. Make a name out there for a brilliant performance.


The following slide showcases financial waterfall for revenue growth in electronics industry. It presents information related to percentage increase in sales, net sales, etc. Showcasing this set of slides titled Financial Waterfall Model Revenue Growth Analysis Professional PDF. The topics addressed in these templates are Financial, Revenue Growth, Analysis. All the content presented in this PPT design is completely editable. Download it and make adjustments in color, background, font etc. as per your unique business setting.


This slide depicts the dashboard used to analyze the key performance indicators of the revenue planning process. The purpose of this template is to evaluate the revenue based on the actual and budget specified. It includes information related to the product, total, actual and budget revenue. Showcasing this set of slides titled KPI Analysis Of Revenue Planning Procedure Professional PDF. The topics addressed in these templates are Kpi Analysis, Revenue Planning Procedure. All the content presented in this PPT design is completely editable. Download it and make adjustments in color, background, font etc. as per your unique business setting.


The following slide showcases the competitive assessment of organizations sales and revenues to evaluate the gap and compare metrics. It includes pie chart representing performance along with key insights etc. Slidegeeks is one of the best resources for PowerPoint templates. You can download easily and regulate Sales Risk Assessment For Profit Maximization Competitive Analysis Of Sales And Revenue Performance Introduction PDF for your personal presentations from our wonderful collection. A few clicks is all it takes to discover and get the most relevant and appropriate templates. Use our Templates to add a unique zing and appeal to your presentation and meetings. All the slides are easy to edit and you can use them even for advertisement purposes.


This slide highlights the Company Products Analysis with different segments which includes grooming, beauty care, home care and health care which showcases product revenue growth and return on assets. Whether you have daily or monthly meetings, a brilliant presentation is necessary. Customer Goods Production Company Product Analysis With Revenue Growth And Return Infographics PDF can be your best option for delivering a presentation. Represent everything in detail using Customer Goods Production Company Product Analysis With Revenue Growth And Return Infographics PDF and make yourself stand out in meetings. The template is versatile and follows a structure that will cater to your requirements. All the templates prepared by Slidegeeks are easy to download and edit. Our research experts have taken care of the corporate themes as well. So, give it a try and see the results.


This slide covers a graphical representation of coca- colas revenue contribution from the smallest 200 brands and the biggest 200 brands. It also includes key insights such as brand portfolio strategy key focus, etc. From laying roadmaps to briefing everything in detail, our templates are perfect for you. You can set the stage with your presentation slides. All you have to do is download these easy-to-edit and customizable templates. Coca Cola Brand Portfolio Strategy Brands Revenue Contribution Analysis Ideas PDF will help you deliver an outstanding performance that everyone would remember and praise you for. Do download this presentation today.


This slide showcases dashboard that can help restaurant keep track of revenue generated from food and beverages. Its key elements are revenue by location, top expenses, revenue by type etc.The best PPT templates are a great way to save time, energy, and resources. Slidegeeks have 100precent editable powerpoint slides making them incredibly versatile. With these quality presentation templates, you can create a captivating and memorable presentation by combining visually appealing slides and effectively communicating your message. Download Digital Marketing Plan For Restaurant Business Food And Beverages Revenue Analysis Dashboard Template PDF from Slidegeeks and deliver a wonderful presentation.


This slide covers a graphical representation of worldwide automobile manufacturing industry revenue. It also includes key insights into disruptions of global manufacturing, supply chain, consumer spending, etc. Do you know about Slidesgeeks Global Automobile Market Analysis Global Automobile Production Industry Revenue Demonstration PDF. These are perfect for delivering any kind od presentation. Using it, create PowerPoint presentations that communicate your ideas and engage audiences. Save time and effort by using our pre-designed presentation templates that are perfect for a wide range of topic. Our vast selection of designs covers a range of styles, from creative to business, and are all highly customizable and easy to edit. Download as a PowerPoint template or use them as Google Slides themes.


This slide provides dashboard showcasing product development project overview with completion status. It provides information regarding cash flow statements, completion progress, project overview and product approval status. Pitch your topic with ease and precision using this KPI Dashboard Showcasing Product Management Revenue Analysis Portrait PDF. This layout presents information on Completion Progress, Product Approval Status, Cash Flow Statements. It is also available for immediate download and adjustment. So, changes can be made in the color, design, graphics or any other component to create a unique layout.


The slide showcases the comparative analysis of revenue and profit distribution from six global regions. The regions included are south America, north America, Asia, Africa, Oceania, and Europe. The Pharmaceutical Company Financial Summary Comparative Analysis Of Revenue Elements PDF is a compilation of the most recent design trends as a series of slides. It is suitable for any subject or industry presentation, containing attractive visuals and photo spots for businesses to clearly express their messages. This template contains a variety of slides for the user to input data, such as structures to contrast two elements, bullet points, and slides for written information. Slidegeeks is prepared to create an impression.


The slide showcases the quarterly revenue highlights for the insurance company to illustrate the quarterly performance of the firm along with the key highlights. Want to ace your presentation in front of a live audience Our Insurance Business Financial Analysis Insurance Company Quarterly Revenue Highlights Designs PDF can help you do that by engaging all the users towards you.. Slidegeeks experts have put their efforts and expertise into creating these impeccable powerpoint presentations so that you can communicate your ideas clearly. Moreover, all the templates are customizable, and easy-to-edit and downloadable. Use these for both personal and commercial use.


The slide showcases the revenue earned by the insurance company from different income sources. It depicts revenue earned from net earned premium, investment, commission and other income sources for last five financial years. This modern and well-arranged Insurance Business Financial Analysis Sources Of Revenue Ppt Model Ideas PDF provides lots of creative possibilities. It is very simple to customize and edit with the Powerpoint Software. Just drag and drop your pictures into the shapes. All facets of this template can be edited with Powerpoint, no extra software is necessary. Add your own material, put your images in the places assigned for them, adjust the colors, and then you can show your slides to the world, with an animated slide included.


The slide showcases the revenue share from different income sources for insurance company in last five financial years. It depicts revenue share from net earned premium, investment, commission and other income sources. Coming up with a presentation necessitates that the majority of the effort goes into the content and the message you intend to convey. The visuals of a PowerPoint presentation can only be effective if it supplements and supports the story that is being told. Keeping this in mind our experts created Insurance Business Financial Analysis Revenue Split By Activities Ppt Infographic Template Design Inspiration PDF to reduce the time that goes into designing the presentation. This way, you can concentrate on the message while our designers take care of providing you with the right template for the situation.


The slide showcases company revenue for last five years along with yearly on year growth. It also depicts CAGR and key insights for revenue analysis. Crafting an eye-catching presentation has never been more straightforward. Let your presentation shine with this tasteful yet straightforward Insurance Business Financial Analysis Historical Revenue Ppt Styles Graphics PDF template. It offers a minimalistic and classy look that is great for making a statement. The colors have been employed intelligently to add a bit of playfulness while still remaining professional. Construct the ideal Insurance Business Financial Analysis Historical Revenue Ppt Styles Graphics PDF that effortlessly grabs the attention of your audience Begin now and be certain to wow your customers.
SHOW
- 60
- 120
- 180
DISPLAYING: 60 of 259 Item(s)
Page