 AI PPT Maker
 Templates
 PPT Bundles
 Design Services
 Business PPTs
 Business Plan
 Management
 Strategy
 Introduction PPT
 Roadmap
 Self Introduction
 Timelines
 Process
 Marketing
 Agenda
 Technology
 Medical
 Startup Business Plan
 Cyber Security
 Dashboards
 SWOT
SWOT Proposals
 Education
 Pitch Deck
 Digital Marketing
 KPIs
KPIs Project Management
 Product Management
 Artificial Intelligence
 Target Market
 Communication
 Supply Chain
 Google Slides
 Research Services
 One Pagers
 All Categories
Results kpi PowerPoint Presentation Templates and Google Slides
SHOW
- 60
- 120
- 180
DISPLAYING: 60 of 117 Item(s)
Page


If designing a presentation takes a lot of your time and resources and you are looking for a better alternative, then this Survey Response Results KPI Dashboard Infographic Ppt PowerPoint Presentation Complete Deck With Slides is the right fit for you. This is a prefabricated set that can help you deliver a great presentation on the topic. All the twelv slides included in this sample template can be used to present a birds-eye view of the topic. These slides are also fully editable, giving you enough freedom to add specific details to make this layout more suited to your business setting. Apart from the content, all other elements like color, design, theme are also replaceable and editable. This helps in designing a variety of presentations with a single layout. Not only this, you can use this PPT design in formats like PDF, PNG, and JPG once downloaded. Therefore, without any further ado, download and utilize this sample presentation as per your liking.


The following slide showcases a comprehensive key performance indicator KPI dashboard which can be used to showcase the outcome of marketing campaign. The major metrics covered in the slide are brand mentions, customer lifetime value CLV, customer acquisition cost CAC, net promoter score NPS, etc. Are you in need of a template that can accommodate all of your creative concepts This one is crafted professionally and can be altered to fit any style. Use it with Google Slides or PowerPoint. Include striking photographs, symbols, depictions, and other visuals. Fill, move around, or remove text boxes as desired. Test out color palettes and font mixtures. Edit and save your work, or work with colleagues. Download KPI Dashboard Highlighting Result Of Marketing Campaign Ppt PowerPoint Presentation Diagram Lists PDF and observe how to make your presentation outstanding. Give an impeccable presentation to your group and make your presentation unforgettable.


The following slide represents KPI dashboard to evaluate social media results of micromarketing to anticipate campaign responses. It includes elements such as social events, facebook shares, twitter retweets, interactions etc. Are you searching for a Niche Marketing Guide To Target Specific Customer Groups Evaluating Social Media Results With Kpi Dashboard Inspiration PDF that is uncluttered, straightforward, and original Its easy to edit, and you can change the colors to suit your personal or business branding. For a presentation that expresses how much effort you have put in, this template is ideal. With all of its features, including tables, diagrams, statistics, and lists, its perfect for a business plan presentation. Make your ideas more appealing with these professional slides. Download Niche Marketing Guide To Target Specific Customer Groups Evaluating Social Media Results With Kpi Dashboard Inspiration PDF from Slidegeeks today.


The following slide highlights personal selling efforts of region wise sales representatives to attract new and retain previous customers. It includes elements such as total team sales, weekly, monthly and annual individual outcomes etc. Coming up with a presentation necessitates that the majority of the effort goes into the content and the message you intend to convey. The visuals of a PowerPoint presentation can only be effective if it supplements and supports the story that is being told. Keeping this in mind our experts created Adopting IMC Technique To Boost Brand Recognition Kpi Dashboard To Analyze Personal Selling Results Formats PDF to reduce the time that goes into designing the presentation. This way, you can concentrate on the message while our designers take care of providing you with the right template for the situation.


This slide shows the dashboard which can be used by content manager to represent the impact of content development on the website. It includes metrics such as blog visitors, blog first touch, new customers. Showcasing this set of slides titled KPI Dashboard Showing Results Of Content Formulation Clipart PDF. The topics addressed in these templates are Blog Visitors, Blog First Touch, New Customers. All the content presented in this PPT design is completely editable. Download it and make adjustments in color, background, font etc. as per your unique business setting.


This slide covers KPI dashboard to analyse results of conducting market research. It involves details such as brand awareness, sample information and major branding themes. Crafting an eye-catching presentation has never been more straightforward. Let your presentation shine with this tasteful yet straightforward KPI Dashboard To Determine Market Research Results Information PDF template. It offers a minimalistic and classy look that is great for making a statement. The colors have been employed intelligently to add a bit of playfulness while still remaining professional. Construct the ideal KPI Dashboard To Determine Market Research Results Information PDF that effortlessly grabs the attention of your audience Begin now and be certain to wow your customers


This slide covers dashboard to assess results of direct mail campaign. It involves details such as total number of recipients, number of delivered items, re routed and mailing breakdown status. Take your projects to the next level with our ultimate collection of Complete Strategic Manual For Direct Mail Marketing Kpi Dashboard To Track Direct Mail Campaign Results Inspiration PDF. Slidegeeks has designed a range of layouts that are perfect for representing task or activity duration, keeping track of all your deadlines at a glance. Tailor these designs to your exact needs and give them a truly corporate look with your own brand colors they will make your projects stand out from the rest.


The following slide depicts the key outcomes of SMS promotion strategy to track its effectiveness. It includes elements such as sales graph, metrics, order, marketing subscribers, average order value, SMS sent, revenue per click, conversion rate, return on investment etc. Slidegeeks is here to make your presentations a breeze with Mobile Promotion Strategic Guide For Micro Businesses Sms Marketing Result Assessment With Kpi Dashboard Slides PDF With our easy to use and customizable templates, you can focus on delivering your ideas rather than worrying about formatting. With a variety of designs to choose from, you are sure to find one that suits your needs. And with animations and unique photos, illustrations, and fonts, you can make your presentation pop. So whether you are giving a sales pitch or presenting to the board, make sure to check out Slidegeeks first.


The purpose of this slide is to exhibit performance KPI dashboard highlighting the marketing campaign results. Organization can track the success rate of its campaign through metrics such as impressions, clicks, click through rate, cost per click, etc. Pitch your topic with ease and precision using this KPI Metrics Dashboard Showing Marketing Results Of Various Campaigns Pictures PDF. This layout presents information on Impressions, Acquisitions, CPA By Campaign. It is also available for immediate download and adjustment. So, changes can be made in the color, design, graphics or any other component to create a unique layout.


The purpose of this slide is to highlight a comprehensive dashboard which can assist the organization to evaluate the marketing campaign results. The dashboard covers information about sales performance, product performance, ecommerce conversion rate, etc. Showcasing this set of slides titled KPI Dashboard Highlighting Marketing Campaign Results Mockup PDF. The topics addressed in these templates are Sales Performance, Product Performance Analysis. All the content presented in this PPT design is completely editable. Download it and make adjustments in color, background, font etc. as per your unique business setting.


The following slide outlines a comprehensive dashboard depicting the business process automation BPA results in the supply chain. Information covered in the slide is related to average order processing days, average shipping days, etc. Coming up with a presentation necessitates that the majority of the effort goes into the content and the message you intend to convey. The visuals of a PowerPoint presentation can only be effective if it supplements and supports the story that is being told. Keeping this in mind our experts created Introducing AI Tools KPI Dashboard Highlighting Automation Results In Supply Chain Portrait PDF to reduce the time that goes into designing the presentation. This way, you can concentrate on the message while our designers take care of providing you with the right template for the situation.


This slide depicts the dashboard for analyzing the results of email campaign and social media marketing. It includes information related to the comparison, statistics, usage, etc. Showcasing this set of slides titled Email Marketing Campaign Outcomes Metrics And Kpis To Measure Results Rules PDF. The topics addressed in these templates are Detailed Engagement, Mobile Engagement, Desktop Engagement. All the content presented in this PPT design is completely editable. Download it and make adjustments in color, background, font etc. as per your unique business setting.


Showcasing this set of slides titled E Mail Marketing Campaign Outcomes Kpis Result Analysis Mockup PDF. The topics addressed in these templates are Marketing Campaign, Outcomes Kpis, Result Analysis. All the content presented in this PPT design is completely editable. Download it and make adjustments in color, background, font etc. as per your unique business setting.


The following slide outlines a comprehensive dashboard depicting the business process automation BPA results in the supply chain. Information covered in the slide is related to average order processing days, average shipping days, etc. From laying roadmaps to briefing everything in detail, our templates are perfect for you. You can set the stage with your presentation slides. All you have to do is download these easy to edit and customizable templates. KPI Dashboard Highlighting Automation Results In Supply Chain Management Brochure PDF will help you deliver an outstanding performance that everyone would remember and praise you for. Do download this presentation today.


This slide covers a comprehensive dashboard that can be used to examine the success rate of the paid social media plan. The metrics mentioned in the dashboard are impressions, cost, clicks, cost per click, conversions, cost per conversion, etc. Presenting this PowerPoint presentation, titled KPI Dashboard To Analyze Results Of Paid Social Media Advertising Rules PDF, with topics curated by our researchers after extensive research. This editable presentation is available for immediate download and provides attractive features when used. Download now and captivate your audience. Presenting this KPI Dashboard To Analyze Results Of Paid Social Media Advertising Rules PDF. Our researchers have carefully researched and created these slides with all aspects taken into consideration. This is a completely customizable KPI Dashboard To Analyze Results Of Paid Social Media Advertising Rules PDF that is available for immediate downloading. Download now and make an impact on your audience. Highlight the attractive features available with our PPTs.


Following slide showcases performance KPI dashboard used to evaluate marketing project campaign results. The dashboard provides overview of key metrics such as total revenue, marketing spend, profit and cost per acquisition, leads etc. Showcasing this set of slides titled KPI Dashboard Showing Results Of Sales And Marketing Project Campaign Formats PDF. The topics addressed in these templates are Marketing Spend, Revenue, Profit Per Acquisition. All the content presented in this PPT design is completely editable. Download it and make adjustments in color, background, font etc. as per your unique business setting.


This slide showcases internal communication KPIs and dashboard that can help organization to identify the reach of messages and most discussed topics in company. Its key components are delivered results and message type. Showcasing this set of slides titled Internal Organizational Communication Kpis And Dashboard With Delivered Results Designs PDF. The topics addressed in these templates are Most Discussed Topics, All Time, Last Week. All the content presented in this PPT design is completely editable. Download it and make adjustments in color, background, font etc. as per your unique business setting.


The following slide outlines a comprehensive dashboard depicting the business process automation BPA results in the supply chain. Information covered in the slide is related to average order processing days, average shipping days, etc.Deliver and pitch your topic in the best possible manner with this KPI Dashboard Highlighting Automation Results In Supply Achieving Operational Efficiency Graphics PDF. Use them to share invaluable insights on Orders Progress, Late Deliveries, Deliveries Warehouse and impress your audience. This template can be altered and modified as per your expectations. So, grab it now.


Pitch your topic with ease and precision using this Survey Response Results KPI Dashboard With Companys Net Promoter Score Graphics PDF. This layout presents information on Recommend Company, Percentage Customers, Explain Companys. It is also available for immediate download and adjustment. So, changes can be made in the color, design, graphics or any other component to create a unique layout.


Showcasing this set of slides titled Survey Response Results KPI Dashboard On Organization Performance And Development Summary PDF. The topics addressed in these templates are Survey Responses, Overall Satisfaction, Training Courses. All the content presented in this PPT design is completely editable. Download it and make adjustments in color, background, font etc. as per your unique business setting.


Pitch your topic with ease and precision using this Survey Response Results KPI Dashboard On Coronavirus Recovery Rates Information PDF. This layout presents information on Positive Response, Response Received, Survey Response. It is also available for immediate download and adjustment. So, changes can be made in the color, design, graphics or any other component to create a unique layout.


Showcasing this set of slides titled Survey Response Results KPI Analytics Dashboard On Personal Finances Guidelines PDF. The topics addressed in these templates are Current Financial, Personal Finance, Obstacles Increase. All the content presented in this PPT design is completely editable. Download it and make adjustments in color, background, font etc. as per your unique business setting.


Pitch your topic with ease and precision using this Immigration Stats Dashboard From Survey Response Results KPI Elements PDF. This layout presents information on Attitude Immigration, Respondent Profile, Immigrants. It is also available for immediate download and adjustment. So, changes can be made in the color, design, graphics or any other component to create a unique layout.
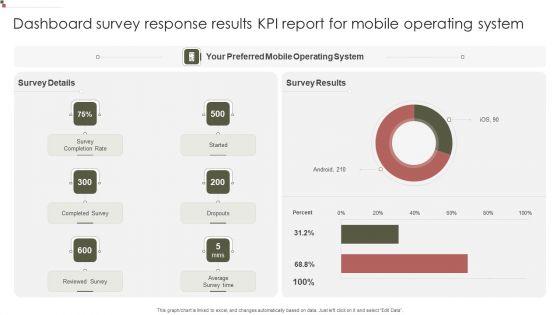
Showcasing this set of slides titled Dashboard Survey Response Results KPI Report For Mobile Operating System Designs PDF. The topics addressed in these templates are Operating System, Survey Results, Completed Survey. All the content presented in this PPT design is completely editable. Download it and make adjustments in color, background, font etc. as per your unique business setting.


Pitch your topic with ease and precision using this Dashboard Of Net Promoter Score Survey Response Results KPI Portrait PDF. This layout presents information on Product Average, Promoter Score, Product Experience. It is also available for immediate download and adjustment. So, changes can be made in the color, design, graphics or any other component to create a unique layout.


Showcasing this set of slides titled Dashboard Of Employee Engagement Survey Response Results KPI Microsoft PDF. The topics addressed in these templates are Total Respondents, Organization Culture, Engagement. All the content presented in this PPT design is completely editable. Download it and make adjustments in color, background, font etc. as per your unique business setting.


Pitch your topic with ease and precision using this Dashboard For Product Campaign Survey Response Results KPI Pictures PDF. This layout presents information on Awareness Recent, Product Campaign, Product Future. It is also available for immediate download and adjustment. So, changes can be made in the color, design, graphics or any other component to create a unique layout.


Showcasing this set of slides titled Customer Experience Dashboard Created Through Survey Response Results KPI Mockup PDF. The topics addressed in these templates are Promoter Score, Customer Satisfaction, Agent Performance. All the content presented in this PPT design is completely editable. Download it and make adjustments in color, background, font etc. as per your unique business setting.


Mentioned slide outlines a dashboard through which the organization can track and evaluate the results of Human Resource Training Administration. It provides information about metrics such as training budget, total cost, cost per participant, total hours of training, etc. Showcasing this set of slides titled Kpi Dashboard Highlighting Results Of Human Resource Training Administration Background PDF. The topics addressed in these templates are Actual Cost Vs, Training Budget, Approved Training Budget, Online Training. All the content presented in this PPT design is completely editable. Download it and make adjustments in color, background, font etc. as per your unique business setting.


Showcasing this set of slides titled Professional Hiring Procedure KPI Dashboard To Ensure Effective Results Summary PDF. The topics addressed in these templates are Shortlisted Candidates, Hired Candidates, Rejected Candidates. All the content presented in this PPT design is completely editable. Download it and make adjustments in color, background, font etc. as per your unique business setting.
The given below slide highlights the KPAs of market research associated with customer satisfaction. It includes net promoter score, customer effort score, monthly NPS and CES trend etc.Pitch your topic with ease and precision using this Market Insights Research Results With KPI Dashboard Ppt PowerPoint Presentation Icon File Formats PDF. This layout presents information on Satisfaction Score, Customer Effort, Customer Score. It is also available for immediate download and adjustment. So, changes can be made in the color, design, graphics or any other component to create a unique layout.


The following slide outlines a comprehensive dashboard depicting the business process automation BPA results in the supply chain. Information covered in the slide is related to average order processing days, average shipping days, etc. Deliver and pitch your topic in the best possible manner with this KPI Dashboard Highlighting Automation Results In Supply Chain Management Rules PDF. Use them to share invaluable insights on Average Order Fulfillment Days, Average Shipping Days, Average Order Processing Days and impress your audience. This template can be altered and modified as per your expectations. So, grab it now.


The following slide showcases a comprehensive dashboard which can be used to track customer referral program results. It provides information about total participants enrolled, invites, clicks, converts, tweets, facebook shares etc. Pitch your topic with ease and precision using this KPI Dashboard Highlighting Customer Recommendation Program Results Rules PDF. This layout presents information on Participants, Invites, Converts. It is also available for immediate download and adjustment. So, changes can be made in the color, design, graphics or any other component to create a unique layout.


The following slide showcases online marketing KPI dashboard which will assist companies to effectively monitor the performance of pay per click campaign. The metrics highlighted in the slide are total impressions, clicks, conversions, costs, click through rate etc. Pitch your topic with ease and precision using this Performance KPI Dashboard Showing Results Of Pay Per Click Marketing Portrait PDF. This layout presents information on Impressions, Target, Budget. It is also available for immediate download and adjustment. So, changes can be made in the color, design, graphics or any other component to create a unique layout.


The following slide showcases a comprehensive marketing KPI dashboard which can be used to track the performance of ecommerce businesses. The metrics mentioned in the slide are total sale by product, average product price, product page visits etc. Showcasing this set of slides titled KPI Dashboard To Track Results Of Ecommerce Marketing Strategy Structure PDF. The topics addressed in these templates are Average, Customer, Marketing. All the content presented in this PPT design is completely editable. Download it and make adjustments in color, background, font etc. as per your unique business setting.


The following slide showcases KPI dashboard which can be used by marketer to track the results of online marketing campaign. The template provides information about total leads, cost per acquisition, major KPIs, funnel, total followers by age, gender and location etc. Showcasing this set of slides titled KPI Dashboard Illustrating Results Of Online Marketing Campaign Slides PDF. The topics addressed in these templates are Cost, Location, Performing. All the content presented in this PPT design is completely editable. Download it and make adjustments in color, background, font etc. as per your unique business setting


The following slide showcases marketing KPI dashboard which shows the performance measuring metrics of SEO campaign. The metrics covered in the slide are most viewed pages from SEO, most search engines used, traffic type, top known keywords etc. Pitch your topic with ease and precision using this KPI Dashboard Highlighting Results Of SEO Campaign Topics PDF. This layout presents information on Search Engines, Traffic, Organic. It is also available for immediate download and adjustment. So, changes can be made in the color, design, graphics or any other component to create a unique layout.


The purpose of this slide is to outline the results of different social media marketing channels through KPIs. Followers, impressions, link counts, engagement rate, average order value are some of the key KPIs which are used to measure the marketing results. Showcasing this set of slides titled Social Media Marketing Results With Kpi Scorecard Demonstration PDF. The topics addressed in these templates are Social Media Marketing Results With Kpi Scorecard. All the content presented in this PPT design is completely editable. Download it and make adjustments in color, background, font etc. as per your unique business setting.


Mentioned slide outlines a comprehensive KPI dashboard highlighting web page results using XYZ analytics tool. The key performance indicators kpis mentioned in the slide are visits, page views, average visit duration, bounce rate, etc. Pitch your topic with ease and precision using this kpi dashboard showing web traffic results using analytical techniques inspiration pdf. This layout presents information on bounce rate, traffic sources, analytics. It is also available for immediate download and adjustment. So, changes can be made in the color, design, graphics or any other component to create a unique layout.


Following slide showcases a dashboard which can be used by organization to track the results of paid social media plan. The template provides information about key metrices such as social media status, engaged users, page impressions, page likes etc. Pitch your topic with ease and precision using this performance kpi dashboard to measure results of paid social media plan ppt powerpoint presentation gallery format ideas pdf. This layout presents information on social media status, instagram page spend, facebook page spend, facebook page likes. It is also available for immediate download and adjustment. So, changes can be made in the color, design, graphics or any other component to create a unique layout.


Following slide showcases a comprehensive dashboard which can be used to examine success rate of paid social media plan. The metrices mentioned in the dashboard are impressions, cost, clicks, cost per click, conversions, cost per conversion etc. Showcasing this set of slides titled kpi dashboard showing results of paid social media advertising ppt powerpoint presentation file summary pdf. The topics addressed in these templates are metric one cost, metric one impressions, performance metrics by source. All the content presented in this PPT design is completely editable. Download it and make adjustments in color, background, font etc. as per your unique business setting.


This slide exhibits a comprehensive dashboard showing the email marketing strategy results. It contains information about various metrics such as total emails sent, successful deliveries, abuse reports, comparison between click rate and open rate, investment and revenue performance of marketing campaigns etc. Showcasing this set of slides titled kpi dashboard highlighting the results of email marketing techniques ppt powerpoint presentation file format pdf. The topics addressed in these templates are advertisement, automation, drip campaign, transactional. All the content presented in this PPT design is completely editable. Download it and make adjustments in color, background, font etc. as per your unique business setting.


The slide outlines different type of KPIs which can assist marketer to track the results of ecommerce business strategy. It includes KPIs such as conversion rate, net profit, cart abandonment rate, customer retention rate, monthly revenue per visitor and customer satisfaction. Pitch your topic with ease and precision using this various kpis to measure results of e business strategy elements pdf. This layout presents information on various kpis to measure results of e business strategy. It is also available for immediate download and adjustment. So, changes can be made in the color, design, graphics or any other component to create a unique layout.


Deliver and pitch your topic in the best possible manner with this non rural water resource administration water management kpi dashboard showing water quality test results clipart pdf. Use them to share invaluable insights on water management kpi dashboard showing water quality test results and impress your audience. This template can be altered and modified as per your expectations. So, grab it now.


Deliver and pitch your topic in the best possible manner with this water quality management water management kpi dashboard showing water quality test results formats pdf. Use them to share invaluable insights on water management kpi dashboard showing water quality test results and impress your audience. This template can be altered and modified as per your expectations. So, grab it now.


Deliver and pitch your topic in the best possible manner with this water management KPI dashboard showing water quality test results topics pdf. Use them to share invaluable insights on samples exceeding health guidelines, water quality test results, 2018 to 2021 and impress your audience. This template can be altered and modified as per your expectations. So, grab it now.


Deliver and pitch your topic in the best possible manner with this ocean water supervision water management kpi dashboard showing water quality test results ppt summary themes pdf. Use them to share invaluable insights on water management kpi dashboard showing water quality test results and impress your audience. This template can be altered and modified as per your expectations. So, grab it now.


Deliver and pitch your topic in the best possible manner with this kpi dashboards per industry market research survey results dashboard ppt powerpoint presentation infographic template layout ideas pdf. Use them to share invaluable insights on overall rating, quick stats, critical factors, preferred channel and impress your audience. This template can be altered and modified as per your expectations. So, grab it now.


Presenting this set of slides with name water nrm water management kpi dashboard showing water quality test results information pdf. The topics discussed in these slides are contaminants causing epa non compliance, water quality, water quality test results, samples exceeding health guidelines samples with unregulated contaminates detected. This is a completely editable PowerPoint presentation and is available for immediate download. Download now and impress your audience.


Presenting this set of slides with name monitoring and evaluating water quality water management kpi dashboard showing water quality test results ppt professional vector pdf. The topics discussed in these slides are contaminants causing epa non compliance, water quality, water quality test results, samples exceeding health guidelines. This is a completely editable PowerPoint presentation and is available for immediate download. Download now and impress your audience.


Presenting this set of slides with name managing agriculture land and water water management kpi dashboard showing water quality test results download pdf. The topics discussed in these slides are contaminants causing epa non compliance, water quality, water quality test results, samples exceeding health guidelines. This is a completely editable PowerPoint presentation and is available for immediate download. Download now and impress your audience.
Presenting this set of slides with name optimization of water usage water management kpi dashboard showing water quality test results ppt icon themes pdf. The topics discussed in these slides are contaminants causing epa non compliance, water quality, water quality test results, samples exceeding health guidelines. This is a completely editable PowerPoint presentation and is available for immediate download. Download now and impress your audience.


Presenting this set of slides with name wqm system water management kpi dashboard showing water quality test results ppt powerpoint presentation outline portfolio pdf. The topics discussed in these slides are contaminants causing epa non compliance, water quality, water quality test results, samples exceeding health guidelines. This is a completely editable PowerPoint presentation and is available for immediate download. Download now and impress your audience.


Presenting this set of slides with name integrated water resource management water management kpi dashboard showing water quality test results structure pdf. The topics discussed in these slides are contaminants causing epa non compliance, water quality, water quality test results, samples exceeding health guidelines. This is a completely editable PowerPoint presentation and is available for immediate download. Download now and impress your audience.


This slide showcases KPIs that can help organization in measure the results of personalized video marketing campaign. KPIs include number of clicks, video through rates, bounce rate, returning users, number of views and watch time. Are you searching for a Kpis To Track Personalized Video Marketing Campaign Results Ppt PowerPoint Presentation File Ideas PDF that is uncluttered, straightforward, and original Its easy to edit, and you can change the colors to suit your personal or business branding. For a presentation that expresses how much effort you have put in, this template is ideal. With all of its features, including tables, diagrams, statistics, and lists, its perfect for a business plan presentation. Make your ideas more appealing with these professional slides. Download Kpis To Track Personalized Video Marketing Campaign Results Ppt PowerPoint Presentation File Ideas PDF from Slidegeeks today.


This slide showcases KPIs that can help organization in measure the results of personalized social media marketing campaign. KPIs include audience growth rate, engagement rate, conversion rate, customer satisfaction score and click through rate. The Kpis To Track Personalized Social Media Marketing Campaign Results Ppt PowerPoint Presentation Diagram Images PDF is a compilation of the most recent design trends as a series of slides. It is suitable for any subject or industry presentation, containing attractive visuals and photo spots for businesses to clearly express their messages. This template contains a variety of slides for the user to input data, such as structures to contrast two elements, bullet points, and slides for written information. Slidegeeks is prepared to create an impression.


This slide showcases KPIs that can help organization in measure the results of personalized mobile application marketing campaign. KPIs include audience growth rate, engagement rate, conversion rate, customer satisfaction score and click through rate. The best PPT templates are a great way to save time, energy, and resources. Slidegeeks have 100 percent editable powerpoint slides making them incredibly versatile. With these quality presentation templates, you can create a captivating and memorable presentation by combining visually appealing slides and effectively communicating your message. Download Kpis To Track Personalized Mobile Application Marketing Campaign Results Ppt PowerPoint Presentation File Ideas PDF from Slidegeeks and deliver a wonderful presentation.


This slide showcases KPIs that can help organization in measure the results of personalized email marketing campaigns. KPIs include conversion rate, click through rate, click to open rate, revenue per subscriber and revenue per email. Explore a selection of the finest Kpis To Track Personalized Email Marketing Campaign Results Ppt PowerPoint Presentation File Diagrams PDF here. With a plethora of professionally designed and pre made slide templates, you can quickly and easily find the right one for your upcoming presentation. You can use our Kpis To Track Personalized Email Marketing Campaign Results Ppt PowerPoint Presentation File Diagrams PDF to effectively convey your message to a wider audience. Slidegeeks has done a lot of research before preparing these presentation templates. The content can be personalized and the slides are highly editable. Grab templates today from Slidegeeks.


This slide showcases KPIs that can help organization in measure the results of personalized website marketing campaigns. KPIs include number of sessions, bounce rate, average session duration, number of signups, visit to signup rate and sales generated. Welcome to our selection of the Kpis To Measure Personalized Website Marketing Campaign Results Ppt PowerPoint Presentation File Show PDF. These are designed to help you showcase your creativity and bring your sphere to life. Planning and Innovation are essential for any business that is just starting out. This collection contains the designs that you need for your everyday presentations. All of our PowerPoints are 100 percent editable, so you can customize them to suit your needs. This multi purpose template can be used in various situations. Grab these presentation templates today.
SHOW
- 60
- 120
- 180
DISPLAYING: 60 of 117 Item(s)
Page