 AI PPT Maker
 Templates
 PPT Bundles
 Design Services
 Business PPTs
 Business Plan
 Management
 Strategy
 Introduction PPT
 Roadmap
 Self Introduction
 Timelines
 Process
 Marketing
 Agenda
 Technology
 Medical
 Startup Business Plan
 Cyber Security
 Dashboards
 SWOT
SWOT Proposals
 Education
 Pitch Deck
 Digital Marketing
 KPIs
KPIs Project Management
 Product Management
 Artificial Intelligence
 Target Market
 Communication
 Supply Chain
 Google Slides
 Research Services
 One Pagers
 All Categories
Profitability analysis PowerPoint Presentation Templates and Google Slides
SHOW
- 60
- 120
- 180
DISPLAYING: 60 of 302 Item(s)
Page


This financial performance analysis growth profitability ppt powerpoint presentation complete deck with slides acts as backup support for your ideas, vision, thoughts, etc. Use it to present a thorough understanding of the topic. This PPT slideshow can be utilized for both in-house and outside presentations depending upon your needs and business demands. Entailing twelve slides with a consistent design and theme, this template will make a solid use case. As it is intuitively designed, it suits every business vertical and industry. All you have to do is make a few tweaks in the content or any other component to design unique presentations. The biggest advantage of this complete deck is that it can be personalized multiple times once downloaded. The color, design, shapes, and other elements are free to modify to add personal touches. You can also insert your logo design in this PPT layout. Therefore a well-thought and crafted presentation can be delivered with ease and precision by downloading this financial performance analysis growth profitability ppt powerpoint presentation complete deck with slides PPT slideshow.


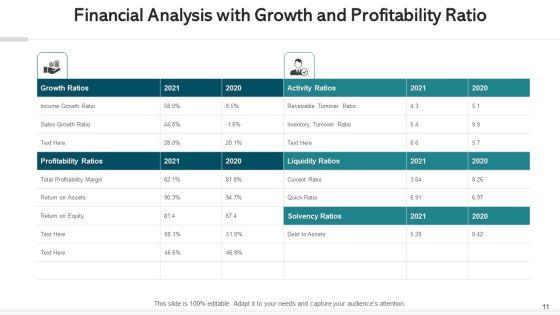
Presenting this set of slides with name financial performance analysis for growth profitability and efficiency ppt powerpoint presentation ideas designs. The topics discussed in these slides are financial targets, financial goals, growth profitability. This is a completely editable PowerPoint presentation and is available for immediate download. Download now and impress your audience.
Presenting this set of slides with name five stages bar chart for business profitability analysis ppt powerpoint presentation icon guide. The topics discussed in these slides are education, growth, pencil bar graph. This is a completely editable PowerPoint presentation and is available for immediate download. Download now and impress your audience.


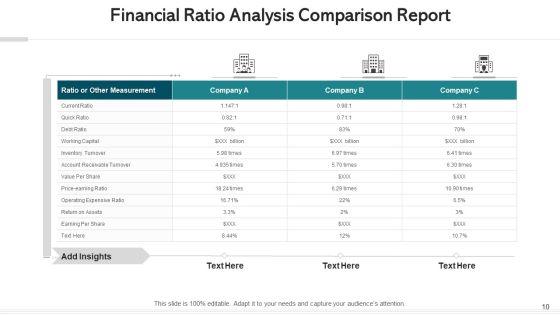
Presenting this set of slides with name ratio analysis gross profit ratio ppt powerpoint presentation gallery inspiration. The topics discussed in these slides are current ratio, investment, ratio analysis, management, strategy. This is a completely editable PowerPoint presentation and is available for immediate download. Download now and impress your audience.


Our MBA Models And Frameworks Profit Percentage Analysis Diagram Strategic Management Powerpoint Templates Abhor Doodling. They Never Let The Interest Flag. Our MBA Models And Frameworks Profit Percentage Analysis Diagram Strategic Management Powerpoint Templates Make Good Beasts Of Burden. Place All Your Demands On Them.


Be The Doer With Our Business Diagram Profit And Financial Analysis Diagram MBA Models And Frameworks Powerpoint Templates. Put Your Thoughts Into Practice. Your Ideas Will Do The Trick. Wave The Wand With Our Business Diagram Profit And Financial Analysis Diagram MBA Models And Frameworks Powerpoint Templates.


We present our ideas business analysis 8 stages ppt profit plan template PowerPoint Slides.Present our Technology PowerPoint Templates because You can Connect the dots. Fan expectations as the whole picture emerges. Download our Marketing PowerPoint Templates because Our PowerPoint Templates and Slides are the chords of your song. String them along and provide the lilt to your views. Download our Circle Charts PowerPoint Templates because Your audience will believe you are the cats whiskers. Download our Light Bulbs PowerPoint Templates because Our PowerPoint Templates and Slides will definately Enhance the stature of your presentation. Adorn the beauty of your thoughts with their colourful backgrounds. Download and present our Business PowerPoint Templates because You are well armed with penetrative ideas. Our PowerPoint Templates and Slides will provide the gunpowder you need.Use these PowerPoint slides for presentations relating to Pie, chart, graphicbusiness, finance, marketing, bulb, vector, symbol, lightbulb, diagram, orange, light, process, element, traditional, idea, graph, illustration, icon, energy, circular, round, clipart, planning, design, clip, set, success, infographic, transparency, technology, art, conceptual. The prominent colors used in the PowerPoint template are Green, Gray, Black. Be batman with our Ideas Business Analysis 8 Stages Ppt Profit Plan Template PowerPoint Slides. You will come out on top.


We present our data analysis 8 stages ppt business plans for non profit organizations PowerPoint templates.Present our Process and Flows PowerPoint Templates because Our PowerPoint Templates and Slides will definately Enhance the stature of your presentation. Adorn the beauty of your thoughts with their colourful backgrounds. Present our Circle Charts PowerPoint Templates because you can Set pulses racing with our PowerPoint Templates and Slides. They will raise the expectations of your team. Download our Business PowerPoint Templates because Our PowerPoint Templates and Slides will let you Leave a lasting impression to your audiences. They possess an inherent longstanding recall factor. Use our Spheres PowerPoint Templates because our PowerPoint Templates and Slides are the string of your bow. Fire of your ideas and conquer the podium. Use our Shapes PowerPoint Templates because Our PowerPoint Templates and Slides are effectively colour coded to prioritise your plans They automatically highlight the sequence of events you desire.Use these PowerPoint slides for presentations relating to Design, isolated, statistics, model, statement, interface, business, vector, presentation, glossy, internet, diagram, circle,brochure, description, report, marketing, level, abstract, steps, illustration, pie, chart, sphere, registry, catalog, section, futuristic, web, text,information,eight space, demonstration, navigation, pattern, structure, multiple. The prominent colors used in the PowerPoint template are Green, Gray, Black. Display your faith in your team with our Data Analysis 8 Stages Ppt Business Plans For Non Profit Organizations PowerPoint Templates. Demonstrate your strong belief in them.


This slide focuses on financial highlights of Web design company which represents revenue and net profit for last five years from 2018 to 2022. There are so many reasons you need a Website Design And Development Services Company Profile Revenue And Net Profit Analysis Formats PDF. The first reason is you can not spend time making everything from scratch, Thus, Slidegeeks has made presentation templates for you too. You can easily download these templates from our website easily.


Following slide showcase comprehensive stock market dashboard which will assist companies for the comparison purpose. The metrics covered in the slide are top stocks by market capitalization, EPS, net profit and PE ratio. Pitch your topic with ease and precision using this Stock Market Analysis Dashboard With Market Capitalization And Net Profit Elements PDF. This layout presents information on Company, Net Profit, Market Capitalization. It is also available for immediate download and adjustment. So, changes can be made in the color, design, graphics or any other component to create a unique layout.


Following slide indicates stock market dashboard highlighting key statistics of company financials. This slide provides information about debt-to-capital ratio, quick ratio, interest coverage ratio, earning analysis, margins analysis etc. Showcasing this set of slides titled Share Market Dashboard Highlighting Cash Flow And Profitability Analysis Information PDF. The topics addressed in these templates are Profitability Analysis, Earnings Analysis, Growth Analysis. All the content presented in this PPT design is completely editable. Download it and make adjustments in color, background, font etc. as per your unique business setting.


This one page covers annual income statement summary with revenue generated , cost of sales and gross profit with margin. Further, this template includes details about adjusted operating profit. Presenting you a fantastic Financial Year Income Statement With Operating Profit Analysis One Pager Documents. This piece is crafted on hours of research and professional design efforts to ensure you have the best resource. It is completely editable and its design allow you to rehash its elements to suit your needs. Get this Financial Year Income Statement With Operating Profit Analysis One Pager Documents A4 One-pager now.


The following slide highlights some key performance indicators to measure the effectiveness of sales risk evaluation on revenue performance. It includes elements such as opportunities, win rate, average time to win, sales velocity along with key insights etc. Get a simple yet stunning designed Sales Risk Assessment For Profit Maximization Key Metrics To Assess Effectiveness Of Sales Risk Analysis Ideas PDF. It is the best one to establish the tone in your meetings. It is an excellent way to make your presentations highly effective. So, download this PPT today from Slidegeeks and see the positive impacts. Our easy to edit Sales Risk Assessment For Profit Maximization Key Metrics To Assess Effectiveness Of Sales Risk Analysis Ideas PDF can be your go to option for all upcoming conferences and meetings. So, what are you waiting for Grab this template today.
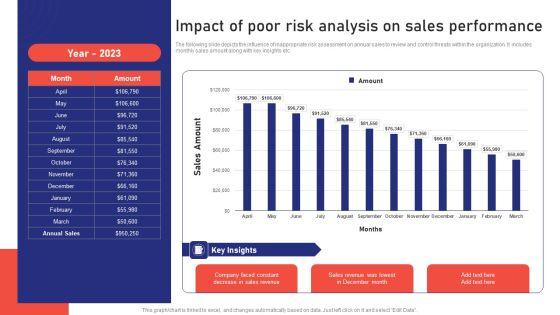

The following slide depicts the influence of inappropriate risk assessment on annual sales to review and control threats within the organization. It includes monthly sales amount along with key insights etc. Do you have to make sure that everyone on your team knows about any specific topic I yes, then you should give Sales Risk Assessment For Profit Maximization Impact Of Poor Risk Analysis On Sales Performance Portrait PDF a try. Our experts have put a lot of knowledge and effort into creating this impeccable Sales Risk Assessment For Profit Maximization Impact Of Poor Risk Analysis On Sales Performance Portrait PDF. You can use this template for your upcoming presentations, as the slides are perfect to represent even the tiniest detail. You can download these templates from the Slidegeeks website and these are easy to edit. So grab these today.


The following slide showcases the competitive assessment of organizations sales and revenues to evaluate the gap and compare metrics. It includes pie chart representing performance along with key insights etc. Slidegeeks is one of the best resources for PowerPoint templates. You can download easily and regulate Sales Risk Assessment For Profit Maximization Competitive Analysis Of Sales And Revenue Performance Introduction PDF for your personal presentations from our wonderful collection. A few clicks is all it takes to discover and get the most relevant and appropriate templates. Use our Templates to add a unique zing and appeal to your presentation and meetings. All the slides are easy to edit and you can use them even for advertisement purposes.


The following slide depicts the analysis of projected and actual sales performance post risk management to evaluate its success. It mainly includes revenue generated during 2021 and 2022 along with gross profit margin etc. Create an editable Sales Risk Assessment For Profit Maximization Comparative Analysis Of Budgeted And Actual Sales Microsoft PDF that communicates your idea and engages your audience. Whether you are presenting a business or an educational presentation, pre designed presentation templates help save time. Sales Risk Assessment For Profit Maximization Comparative Analysis Of Budgeted And Actual Sales Microsoft PDF is highly customizable and very easy to edit, covering many different styles from creative to business presentations. Slidegeeks has creative team members who have crafted amazing templates. So, go and get them without any delay.


This slide covers financial impact of new distribution strategies on revenue, gross profit margins, net profit margins and distribution and logistics cost. Company revenues has increased, profit margins have improved and distribution cost has decreased. This modern and well-arranged Maximizing Profit Returns With Right Distribution Source Impact Analysis Of New Distribution Strategies Structure PDF provides lots of creative possibilities. It is very simple to customize and edit with the Powerpoint Software. Just drag and drop your pictures into the shapes. All facets of this template can be edited with Powerpoint no extra software is necessary. Add your own material, put your images in the places assigned for them, adjust the colors, and then you can show your slides to the world, with an animated slide included.


The slide showcases the underwriting profit along with margin for insurance company in last five financial years. It depicts consistent growth in underwriting profit highlighting profitability from insurance business. This Insurance Business Financial Analysis Underwriting Profit And Margin Ppt Portfolio Sample PDF is perfect for any presentation, be it in front of clients or colleagues. It is a versatile and stylish solution for organizing your meetings. The Insurance Business Financial Analysis Underwriting Profit And Margin Ppt Portfolio Sample PDF features a modern design for your presentation meetings. The adjustable and customizable slides provide unlimited possibilities for acing up your presentation. Slidegeeks has done all the homework before launching the product for you. So, dont wait, grab the presentation templates today.


The slide showcases operating profit trend last five financial years along with profitability margin along with the key insights and reasons impacting operating margin. Formulating a presentation can take up a lot of effort and time, so the content and message should always be the primary focus. The visuals of the PowerPoint can enhance the presenters message, so our Insurance Business Financial Analysis Operating Profit And Margin Ppt Styles Structure PDF was created to help save time. Instead of worrying about the design, the presenter can concentrate on the message while our designers work on creating the ideal templates for whatever situation is needed. Slidegeeks has experts for everything from amazing designs to valuable content, we have put everything into Insurance Business Financial Analysis Operating Profit And Margin Ppt Styles Structure PDF.


The slide showcases the bottom line for insurance company along with net profit margin for last five financial year. It also provides insights into the factors affecting company profitability. Make sure to capture your audiences attention in your business displays with our gratis customizable Insurance Business Financial Analysis Net Profit And Margin Ppt Gallery Ideas PDF. These are great for business strategies, office conferences, capital raising or task suggestions. If you desire to acquire more customers for your tech business and ensure they stay satisfied, create your own sales presentation with these plain slides.


This slide provides details about how customer profitability is analyzed based upon the amount of sales generated, invoice value, etc. If you are looking for a format to display your unique thoughts, then the professionally designed Profitability Modelling Framework Determining Customer Profitability Analysis Download PDF is the one for you. You can use it as a Google Slides template or a PowerPoint template. Incorporate impressive visuals, symbols, images, and other charts. Modify or reorganize the text boxes as you desire. Experiment with shade schemes and font pairings. Alter, share or cooperate with other people on your work. Download Profitability Modelling Framework Determining Customer Profitability Analysis Download PDF and find out how to give a successful presentation. Present a perfect display to your team and make your presentation unforgettable.


This slide represents dashboard of the organization showing the analysis of the corporate budget. It shows income and expenses, net profit margin, income statement, accounts receivable and payable, quick and current ratio of the business etc. Showcasing this set of slides titled Enterprise Budget Analysis Dashboard Highlighting Net Profit Margin Clipart PDF. The topics addressed in these templates are Income And Expenses, Net Profit Margin, Income Budget. All the content presented in this PPT design is completely editable. Download it and make adjustments in color, background, font etc. as per your unique business setting.


This slide represents the companys net profit and margin for five years which shows strong position due to reduced operating expenses, increased revenue, etc. that allow creditors to know about companys health.Are you searching for a Net Profit And Margin Analysis Residential And Commercial Building Construction Company Profile Elements PDF that is uncluttered, straightforward, and original Its easy to edit, and you can change the colors to suit your personal or business branding. For a presentation that expresses how much effort you ve put in, this template is ideal With all of its features, including tables, diagrams, statistics, and lists, its perfect for a business plan presentation. Make your ideas more appealing with these professional slides. Download Net Profit And Margin Analysis Residential And Commercial Building Construction Company Profile Elements PDF from Slidegeeks today.


This slide shows a monthly profit and loss statement dashboard. The constituting elements herein are total net revenue, cost of goods sold and gross profit.Pitch your topic with ease and precision using this Monthly Profit And Loss Statement Reports Analysis Dashboard Brochure PDF. This layout presents information on Costs Good Sold, Earnings Before, Interest Expense. It is also available for immediate download and adjustment. So, changes can be made in the color, design, graphics or any other component to create a unique layout.


This slide includes profit and loss analysis dashboard with cost breakdown KPI. The kpis used herein are revenue, COGS, expenditure and net profit.Pitch your topic with ease and precision using this Monthly Profit And Loss Analysis Reports Dashboard With Cost Breakdown Kpi Structure PDF. This layout presents information on Revenue Expenditure, Net Profit, Total Exprnses. It is also available for immediate download and adjustment. So, changes can be made in the color, design, graphics or any other component to create a unique layout.
SHOW
- 60
- 120
- 180
DISPLAYING: 60 of 302 Item(s)
Page