 AI PPT Maker
 Templates
 PPT Bundles
 Design Services
 Business PPTs
 Business Plan
 Management
 Strategy
 Introduction PPT
 Roadmap
 Self Introduction
 Timelines
 Process
 Marketing
 Agenda
 Technology
 Medical
 Startup Business Plan
 Cyber Security
 Dashboards
 SWOT
SWOT Proposals
 Education
 Pitch Deck
 Digital Marketing
 KPIs
KPIs Project Management
 Product Management
 Artificial Intelligence
 Target Market
 Communication
 Supply Chain
 Google Slides
 Research Services
 One Pagers
 All Categories
Productivity graph PowerPoint Presentation Templates and Google Slides
SHOW
- 60
- 120
- 180
DISPLAYING: 60 of 146 Item(s)
Page


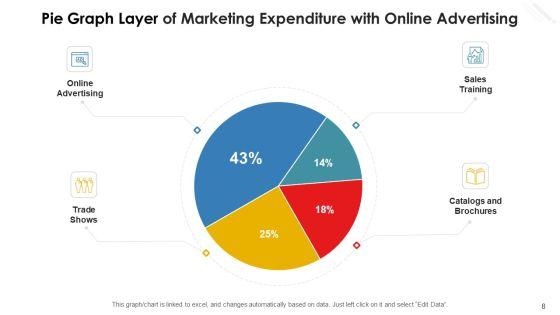


Boost your confidence and team morale with this well-structured pie graph layer marketing expenditure production process ppt powerpoint presentation complete deck with slides. This prefabricated set gives a voice to your presentation because of its well-researched content and graphics. Our experts have added all the components very carefully, thus helping you deliver great presentations with a single click. Not only that, it contains a set of twelve slides that are designed using the right visuals, graphics, etc. Various topics can be discussed, and effective brainstorming sessions can be conducted using the wide variety of slides added in this complete deck. Apart from this, our PPT design contains clear instructions to help you restructure your presentations and create multiple variations. The color, format, design anything can be modified as deemed fit by the user. Not only this, it is available for immediate download. So, grab it now.


Presenting this set of slides with name bar graph product ppt powerpoint presentation icon layout. The topics discussed in these slides are finance, marketing, management, investment, analysis. This is a completely editable PowerPoint presentation and is available for immediate download. Download now and impress your audience.


Presenting this set of slides with name innovation model of productivity enhancement ppt powerpoint presentation infographics graphics pictures. This is a four stage process. The stages in this process are productivity improvement, output improvement, productivity enhancement. This is a completely editable PowerPoint presentation and is available for immediate download. Download now and impress your audience.


Presenting this set of slides with name factors that effect productivity ppt powerpoint presentation layouts graphics. This is a seven stage process. The stages in this process are productivity improvement, output improvement, productivity enhancement. This is a completely editable PowerPoint presentation and is available for immediate download. Download now and impress your audience.


Presenting this set of slides with name workplace productivity ppt powerpoint presentation show graphics tutorials. This is an editable Powerpoint twelve stages graphic that deals with topics like workplace productivity to help convey your message better graphically. This product is a premium product available for immediate download, and is 100 percent editable in Powerpoint. Download this now and use it in your presentations to impress your audience.


Presenting this set of slides with name technology team productivity ppt powerpoint presentation inspiration graphic tips. This is an editable Powerpoint five stages graphic that deals with topics like technology team productivity to help convey your message better graphically. This product is a premium product available for immediate download, and is 100 percent editable in Powerpoint. Download this now and use it in your presentations to impress your audience.
Presenting this set of slides with name establish baselines resources productivity ppt powerpoint presentation icon graphics download. This is a stage process. The stages in this process are business, management, planning, strategy, marketing. This is a completely editable PowerPoint presentation and is available for immediate download. Download now and impress your audience.


Presenting this set of slides with name productivity performance ppt powerpoint presentation infographic template graphics download cpb. This is a two stage process. The stages in this process are productivity performance. This is a completely editable PowerPoint presentation and is available for immediate download. Download now and impress your audience.


Presenting this set of slides with name product life cycle graph ppt powerpoint presentation pictures elements cpb. This is a four stage process. The stages in this process are product life cycle graph. This is a completely editable PowerPoint presentation and is available for immediate download. Download now and impress your audience.


This is a Table Of Contents For Employee Engagement Strategy Deployment To Enhance Retention And Productivity Rate Graphics PDF template with various stages. Focus and dispense information on four stages using this creative set, that comes with editable features. It contains large content boxes to add your information on topics like Dashboard, Employee Training, Employee Engagement. You can also showcase facts, figures, and other relevant content using this PPT layout. Grab it now.


Products Sale Graph Business PowerPoint Templates And PowerPoint Themes 0912-Microsoft Powerpoint Templates and Background with business graph-Business graph, competition, business, finance, sales, Money Your audience deserves the absolute best. Give them better than that with our Products Sale Graph Business PowerPoint Templates And PowerPoint Themes 0912.


Graph Of Products Sale Business PowerPoint Templates And PowerPoint Themes Presentations-Microsoft Powerpoint Templates and Background with graph of products sale-Graph Of Products Sale Business PowerPoint Templates And PowerPoint Themes PresentationsThis PPT can be used for presentations relating to-Graph of products sale, business, cylinders, success, finance, shapes Be bold and dramatic with our Graph Of Products Sale Business PowerPoint Templates And PowerPoint Themes 0912. State the facts with elan.


Products Sale Graph Business PowerPoint Templates And PowerPoint Themes 0812-Microsoft Powerpoint Templates and Background with sales growth business chart Face up to any adversity with our Products Sale Graph Business PowerPoint Templates And PowerPoint Themes 0812. They will help your ideas dominate.


The following slide showcases he employees productivity and efficiency graph for last years which shows that employees productivity has declined during this time period because of lack of training programs and high attrition rate. Make sure to capture your audiences attention in your business displays with our gratis customizable Corporate Training Program Employee Productivity And Efficiency Graph For Last 5 Years Elements PDF. These are great for business strategies, office conferences, capital raising or task suggestions. If you desire to acquire more customers for your tech business and ensure they stay satisfied, create your own sales presentation with these plain slides.


Problems Related To Current Product Positioning Ppt PowerPoint Presentation Diagram Graph Charts PDF
This slide highlights the problems related to current product positioning which showcases in graphical format depicting downgrading product sales and changing consumer trends. Do you have an important presentation coming up Are you looking for something that will make your presentation stand out from the rest Look no further than Problems Related To Current Product Positioning Ppt PowerPoint Presentation Diagram Graph Charts PDF. With our professional designs, you can trust that your presentation will pop and make delivering it a smooth process. And with Slidegeeks, you can trust that your presentation will be unique and memorable. So why wait Grab Problems Related To Current Product Positioning Ppt PowerPoint Presentation Diagram Graph Charts PDF today and make your presentation stand out from the rest


This slide highlights the reasons for product repositioning which includes declining sales, increased competition, wrong positioning, future plans, evolved products and change strategic direction. Do you have to make sure that everyone on your team knows about any specific topic I yes, then you should give Major Reasons For Product Repositioning Ppt PowerPoint Presentation Diagram Graph Charts PDF a try. Our experts have put a lot of knowledge and effort into creating this impeccable Major Reasons For Product Repositioning Ppt PowerPoint Presentation Diagram Graph Charts PDF. You can use this template for your upcoming presentations, as the slides are perfect to represent even the tiniest detail. You can download these templates from the Slidegeeks website and these are easy to edit. So grab these today
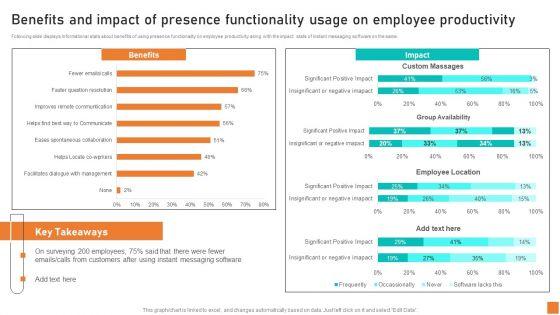
Following slide displays informational stats about benefits of using presence functionality on employee productivity along with the impact stats of instant messaging software on the same. Find highly impressive Benefits And Impact Of Presence Functionality Usage On Employee Productivity Ppt Slides Graphics Pictures PDF on Slidegeeks to deliver a meaningful presentation. You can save an ample amount of time using these presentation templates. No need to worry to prepare everything from scratch because Slidegeeks experts have already done a huge research and work for you. You need to download Benefits And Impact Of Presence Functionality Usage On Employee Productivity Ppt Slides Graphics Pictures PDF for your upcoming presentation. All the presentation templates are 100 percent editable and you can change the color and personalize the content accordingly. Download now


The following slide showcases he employees productivity and efficiency graph for last years which shows that employees productivity has declined during this time period because of lack of training programs and high attrition rate. Whether you have daily or monthly meetings, a brilliant presentation is necessary. Business Development Program Employee Productivity And Efficiency Graph For Last 5 Years Ideas PDF can be your best option for delivering a presentation. Represent everything in detail using Business Development Program Employee Productivity And Efficiency Graph For Last 5 Years Ideas PDF and make yourself stand out in meetings. The template is versatile and follows a structure that will cater to your requirements. All the templates prepared by Slidegeeks are easy to download and edit. Our research experts have taken care of the corporate themes as well. So, give it a try and see the results.
This slide showcases a dashboard for tracking and managing warehouse productivity to optimize logistics operations. It includes key components such as warehouse operating costs, perfect order rate, total shipments by country and on time shipments. Showcasing this set of slides titled Storage Facility Productivity Tracking KPI Dashboard Graphics PDF. The topics addressed in these templates are Warehouse Operating Costs, Perfect Order Rate, Total Shipment Country. All the content presented in this PPT design is completely editable. Download it and make adjustments in color, background, font etc. as per your unique business setting.


The following slide showcases he employees productivity and efficiency graph for last years which shows that employees productivity has declined during this time period because of lack of training programs and high attrition rate. Do you know about Slidesgeeks Employee Training And Development Strategy Employee Productivity And Efficiency Graph For Last 5 Years Graphics PDF These are perfect for delivering any kind od presentation. Using it, create PowerPoint presentations that communicate your ideas and engage audiences. Save time and effort by using our pre designed presentation templates that are perfect for a wide range of topic. Our vast selection of designs covers a range of styles, from creative to business, and are all highly customizable and easy to edit. Download as a PowerPoint template or use them as Google Slides themes.


Pitch your topic with ease and precision using this Harvey Ball Graph For Product Users Demographics Portrait PDF. This layout presents information on Harvey Ball Graph, For Product, Users Demographics. It is also available for immediate download and adjustment. So, changes can be made in the color, design, graphics or any other component to create a unique layout.


Showcasing this set of slides titled Harvey Ball Graph For Product Market Penetration Clipart PDF. The topics addressed in these templates are Harvey Ball Graph, For Product, Market Penetration. All the content presented in this PPT design is completely editable. Download it and make adjustments in color, background, font etc. as per your unique business setting.


Showcasing this set of slides titled Harvey Ball Graph For Product Evaluation Microsoft PDF. The topics addressed in these templates are Ease Of Use, Cost Effectiveness, Level Of Efficacy. All the content presented in this PPT design is completely editable. Download it and make adjustments in color, background, font etc. as per your unique business setting.
Showcasing this set of slides titled Profits And Discounts On Products Clustered Bar Graph Icons PDF. The topics addressed in these templates are Profits And Discounts, Less Discounts, Market Penetration. All the content presented in this PPT design is completely editable. Download it and make adjustments in color, background, font etc. as per your unique business setting.


This slide shows sales quantities of various products to analyze company profits. It includes quantity and types of products. Pitch your topic with ease and precision using this Product Sales Comparison On Bar Graph Sample PDF. This layout presents information on Unique Value Proposition, Excellent Marketing Skills, Ignoring The Compet. It is also available for immediate download and adjustment. So, changes can be made in the color, design, graphics or any other component to create a unique layout.


This slide illustrates the productivity chart of manufacturing of a company. It includes quantity produced in million units against the time period. Pitch your topic with ease and precision using this Manufacturing Productivity Analysis Bar Graph Introduction PDF. This layout presents information on Manufacturing Productivity, Production Decreased, Closure Of Companies. It is also available for immediate download and adjustment. So, changes can be made in the color, design, graphics or any other component to create a unique layout.


This slide displays graphical representation of targeted and achieved production variance. It also includes critical insights such as target units, achieved production, achieved percentage, overachieved percentage, etc. Pitch your topic with ease and precision using this Attain Production Goals And Objectives Graph And Table Ppt Infographic Template Visuals PDF. This layout presents information on Target Vs Achieved, Key insight Table, Quarterly. It is also available for immediate download and adjustment. So, changes can be made in the color, design, graphics or any other component to create a unique layout.


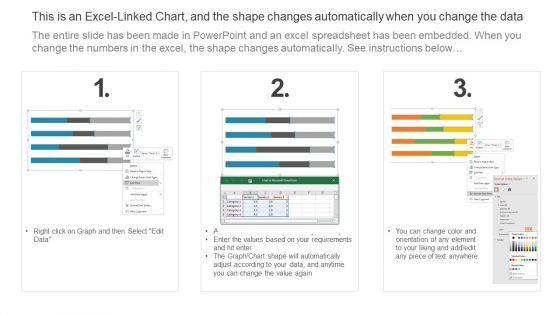
This graph or chart is linked to excel, and changes automatically based on data. Just left click on it and select Edit Data. Showcasing this set of slides titled Doughnut Graph Highlighting Production Volume Of Multiple Manufacturing Units Guidelines PDF. The topics addressed in these templates are Total Production, Manufacturing Unit, Washington. All the content presented in this PPT design is completely editable. Download it and make adjustments in color, background, font etc. as per your unique business setting.


This slide represent graphical presentation of annual sales review of various products sold by an organization within 5 years showing difference in revenue generated .It shows report of following years 2018,2019,2020,and 2021. Showcasing this set of slides titled Yearly Sales Assessment Of Products With Bar Graph Structure PDF. The topics addressed in these templates are Product, Sales Of Product, Product Demand. All the content presented in this PPT design is completely editable. Download it and make adjustments in color, background, font etc. as per your unique business setting.


This slide can be used to show improvement in employee productivity over past four years. The main reason for productivity improvement is the managerial and organizational support provided to employees. Pitch your topic with ease and precision using this Annual Staff Productivity Enhancement Graph Ppt PowerPoint Presentation Styles Aids PDF. This layout presents information on Employee Productivity, Improved Last, Due Continuous. It is also available for immediate download and adjustment. So, changes can be made in the color, design, graphics or any other component to create a unique layout.


Pitch your topic with ease and precision using this Trend Chart Depicting Diminishing Graph And Chart Sales And Production Structure PDF. This layout presents information on Trend Chart Depicting, Diminishing Graph, Chart Sales And Production. It is also available for immediate download and adjustment. So, changes can be made in the color, design, graphics or any other component to create a unique layout.


The below slide highlights the product wise revenue data of an organization to analyze the particular product success. It also includes key insights for reference. Pitch your topic with ease and precision using this Quarterly Product Wise Revenue Graph Evaluation Brochure PDF. This layout presents information on Products, Average Revenue. It is also available for immediate download and adjustment. So, changes can be made in the color, design, graphics or any other component to create a unique layout.


Pitch your topic with ease and precision using this Sales Growth Graph Showing Annual Product Performance Slides PDF. This layout presents information on Sales Growth, Product Performance. It is also available for immediate download and adjustment. So, changes can be made in the color, design, graphics or any other component to create a unique layout.


Showcasing this set of slides titled Product Performance Comparison Graph Showing Revenue Growth Portrait PDF. The topics addressed in these templates are Sales Revenue, Product. All the content presented in this PPT design is completely editable. Download it and make adjustments in color, background, font etc. as per your unique business setting.


This slide covers 360 degree employee feedback form. It includes evaluation KPIs based on productivity, leadership, communication, and personal development. Showcasing this set of slides titled 360 Degree Performance Review Sheet With Productivity And Leadership Kpis Graphics PDF The topics addressed in these templates are Productivity, Communication, Personal Development All the content presented in this PPT design is completely editable. Download it and make adjustments in color, background, font etc. as per your unique business setting.
Persuade your audience using this Employee Productivity Enhancement Plan Icon With Bar Graph Slides PDF This PPT design covers three stages, thus making it a great tool to use. It also caters to a variety of topics including Employee Productivity, Enhancement Plan, Bar Graph Download this PPT design now to present a convincing pitch that not only emphasizes the topic but also showcases your presentation skills.


This slide shows the 90 day improvement plan for improving the performance of a manufacturing firm so that they can manufacture a lot better amount of products and increase their revenue.Presenting 90 Day Productivity Enhancement Plan Graphics PDF to dispense important information. This template comprises seven stages. It also presents valuable insights into the topics including Plan Conclusion, Manufacturing, Performance This is a completely customizable PowerPoint theme that can be put to use immediately. So, download it and address the topic impactfully.


This slide showcases launch graph of product A and B representing essential metrics such as investment, time, profit maximization and prolong lifecycle. Key stages include development, introduction, growth, maturity and decline.Showcasing this set of slides titled New Product Introduction Process Comparison Graph Slides PDF The topics addressed in these templates are Product Development, Improper Planning, Minimize Investment All the content presented in this PPT design is completely editable. Download it and make adjustments in color, background, font etc. as per your unique business setting.


Mentioned slide displays informational stats about the impact of doing PSM training on workplace productivity. It includes before and after stats of productivity. Deliver an awe inspiring pitch with this creative Professional Scrum Master Estimated Impact Of Psm Training On Workplace Productivity Graphics PDF bundle. Topics like Project Delay Events, Team Conflicts, PSM training, Frequently, Occasionally can be discussed with this completely editable template. It is available for immediate download depending on the needs and requirements of the user.
SHOW
- 60
- 120
- 180
DISPLAYING: 60 of 146 Item(s)
Page