 AI PPT Maker
 Templates
 PPT Bundles
 Design Services
 Business PPTs
 Business Plan
 Management
 Strategy
 Introduction PPT
 Roadmap
 Self Introduction
 Timelines
 Process
 Marketing
 Agenda
 Technology
 Medical
 Startup Business Plan
 Cyber Security
 Dashboards
 SWOT
SWOT Proposals
 Education
 Pitch Deck
 Digital Marketing
 KPIs
KPIs Project Management
 Product Management
 Artificial Intelligence
 Target Market
 Communication
 Supply Chain
 Google Slides
 Research Services
 One Pagers
 All Categories
Product Sales Performance PowerPoint Presentation Templates and Google Slides
SHOW
- 60
- 120
- 180
DISPLAYING: 60 of 120 Item(s)
Page


Presenting this set of slides with name sales product performance dashboard ppt powerpoint presentation styles files. The topics discussed in these slides are finance, marketing, management, investment, analysis. This is a completely editable PowerPoint presentation and is available for immediate download. Download now and impress your audience.


Presenting this set of slides with name sales product performance dashboard ppt powerpoint presentation pictures deck. The topics discussed in these slides are finance, marketing, management, investment, analysis. This is a completely editable PowerPoint presentation and is available for immediate download. Download now and impress your audience.


Presenting this set of slides with name sales product performance dashboard ppt powerpoint presentation infographic template format ideas. The topics discussed in these slides are marketing, business, management, planning, strategy. This is a completely editable PowerPoint presentation and is available for immediate download. Download now and impress your audience.


Presenting this set of slides with name sales performance by product ppt powerpoint presentation outline graphics download. The topics discussed in these slides are finance, marketing, management, investment, analysis. This is a completely editable PowerPoint presentation and is available for immediate download. Download now and impress your audience.


Presenting this set of slides with name sales performance by product ppt powerpoint presentation infographic template infographic template. The topics discussed in these slides are finance, marketing, management, investment, analysis. This is a completely editable PowerPoint presentation and is available for immediate download. Download now and impress your audience.


Presenting this set of slides with name sales performance by product four years ppt powerpoint presentation ideas samples. The topics discussed in these slides are marketing, business, management, planning, strategy. This is a completely editable PowerPoint presentation and is available for immediate download. Download now and impress your audience.


Measuring Sales Performance And Productivity Ppt PowerPoint Presentation Infographic Template Sample
This is a measuring sales performance and productivity ppt powerpoint presentation infographic template sample. This is a eight stage process. The stages in this process are sales objectives, sales goal, achieving sales target.


The following slide show by how what margin will the new marketing plan will boost the companys sale in the upcoming year.Deliver an awe inspiring pitch with this creative Yearly Product Performance Assessment Repor Sales Historical And Forecasted Contd Information PDF bundle. Topics like Historical Data, Forecasted Data, Tons Produced can be discussed with this completely editable template. It is available for immediate download depending on the needs and requirements of the user.


The following slide highlights the comparative assessment of vegan protein and traditional sales for multiple products. The products included are packaged products, snacks, nutritional beverages, frozen meals, frozen snacks, and pizza. Create an editable Food Company Financial Performance Summary Sales Contribution From Vegan Proteins Products Topics PDF that communicates your idea and engages your audience. Whether you are presenting a business or an educational presentation, pre-designed presentation templates help save time. Food Company Financial Performance Summary Sales Contribution From Vegan Proteins Products Topics PDF is highly customizable and very easy to edit, covering many different styles from creative to business presentations. Slidegeeks has creative team members who have crafted amazing templates. So, go and get them without any delay.
The following slide shows the comparative sales growth of agricultural products and processed foods. It shows the product sales from more than three decades to assess the change in demand of company products. This Food Company Financial Performance Summary Historical Food Product Sales Chart Icons PDF from Slidegeeks makes it easy to present information on your topic with precision. It provides customization options, so you can make changes to the colors, design, graphics, or any other component to create a unique layout. It is also available for immediate download, so you can begin using it right away. Slidegeeks has done good research to ensure that you have everything you need to make your presentation stand out. Make a name out there for a brilliant performance.
This slide provides information regarding product branding performance tracking dashboard in terms of revenues, new customers, customer satisfaction rate. Make sure to capture your audiences attention in your business displays with our gratis customizable Product Branding To Enhance Product Sales Performance Tracking Dashboard Infographics PDF. These are great for business strategies, office conferences, capital raising or task suggestions. If you desire to acquire more customers for your tech business and ensure they stay satisfied, create your own sales presentation with these plain slides.


This slide showcases dashboard that can help organization to analyse the sales of product after entering into niche market. Its key elements are sales, sales target, sales growth, sales by channel, inventory days outstanding etc. Presenting this PowerPoint presentation, titled Price Leadership Technique Dashboard To Track Product Sales Performance Professional PDF, with topics curated by our researchers after extensive research. This editable presentation is available for immediate download and provides attractive features when used. Download now and captivate your audience. Presenting this Price Leadership Technique Dashboard To Track Product Sales Performance Professional PDF. Our researchers have carefully researched and created these slides with all aspects taken into consideration. This is a completely customizable Price Leadership Technique Dashboard To Track Product Sales Performance Professional PDF that is available for immediate downloading. Download now and make an impact on your audience. Highlight the attractive features available with our PPTs.


This slide displays sales analysis for different products and regions in each quarter. t also includes inter year comparisons. Pitch your topic with ease and precision using this Quarterly Sales Performance Of Business Dashboard With Region And Product Wise Comparison Guidelines PDF. This layout presents information on Product Wise Quarterly Sales, Comparison. It is also available for immediate download and adjustment. So, changes can be made in the color, design, graphics or any other component to create a unique layout.


This slide showcases dashboard that can help organization to analyse the sales of product after entering into niche market. Its key elements are sales, sales target, sales growth, sales by channel, inventory days outstanding etc. Are you in need of a template that can accommodate all of your creative concepts This one is crafted professionally and can be altered to fit any style. Use it with Google Slides or PowerPoint. Include striking photographs, symbols, depictions, and other visuals. Fill, move around, or remove text boxes as desired. Test out color palettes and font mixtures. Edit and save your work, or work with colleagues. Download Product Rollout Techniques Dashboard To Track Product Sales Performance Infographics PDF and observe how to make your presentation outstanding. Give an impeccable presentation to your group and make your presentation unforgettable.


The following slide highlights the KPIs of product sales to assess sales performance over the past few years to formulate new strategy. It includes elements such as revenue, offline and online sales, monthly cost analysis etc. Pitch your topic with ease and precision using this Description Product Sales Performance Analysis Dashboard Ppt PowerPoint Presentation File Samples PDF. This layout presents information on Product Wise Revenue, Monthly Cost Analysis, Sales Revenue, Different Strategies. It is also available for immediate download and adjustment. So, changes can be made in the color, design, graphics or any other component to create a unique layout.


This slide showcases dashboard that can help organization to analyse the sales of product after entering into niche market. Its key elements are sales, sales target, sales growth, sales by channel, inventory days outstanding etc. Presenting this PowerPoint presentation, titled Porters Strategies For Targeted Client Segment Dashboard To Track Product Sales Performance Clipart PDF, with topics curated by our researchers after extensive research. This editable presentation is available for immediate download and provides attractive features when used. Download now and captivate your audience. Presenting this Porters Strategies For Targeted Client Segment Dashboard To Track Product Sales Performance Clipart PDF. Our researchers have carefully researched and created these slides with all aspects taken into consideration. This is a completely customizable Porters Strategies For Targeted Client Segment Dashboard To Track Product Sales Performance Clipart PDF that is available for immediate downloading. Download now and make an impact on your audience. Highlight the attractive features available with our PPTs.


This slide showcases dashboard that can help organization to analyse the sales of product after entering into niche market. Its key elements are sales, sales target, sales growth, sales by channel, inventory days outstanding etc. Do you have to make sure that everyone on your team knows about any specific topic I yes, then you should give Dashboard To Track Product Sales Performance Market Focused Product Launch Strategy Graphics PDF a try. Our experts have put a lot of knowledge and effort into creating this impeccable Dashboard To Track Product Sales Performance Market Focused Product Launch Strategy Graphics PDF. You can use this template for your upcoming presentations, as the slides are perfect to represent even the tiniest detail. You can download these templates from the Slidegeeks website and these are easy to edit. So grab these today


This slide showcases dashboard that can help organization to analyse the sales of product after entering into niche market. Its key elements are sales, sales target, sales growth, sales by channel, inventory days outstanding etc. Create an editable Dashboard To Track Product Sales Performance Cost Leadership Differentiation Strategy Ideas PDF that communicates your idea and engages your audience. Whether you are presenting a business or an educational presentation, pre-designed presentation templates help save time. Dashboard To Track Product Sales Performance Cost Leadership Differentiation Strategy Ideas PDF is highly customizable and very easy to edit, covering many different styles from creative to business presentations. Slidegeeks has creative team members who have crafted amazing templates. So, go and get them without any delay.


Following slide provides information regarding ecommerce dashboard which organizations design to address sales challenges and maximize market opportunities. Product sales revenue, overall status, monthly trends, conversion rate, etc. are key elements demonstrated in this slide. Showcasing this set of slides titled Online Product Sales Performance Dashboard Designs PDF. The topics addressed in these templates are Revenue Generated From Sales, Daily Sales Revenue, Costumer Conversion Rate. All the content presented in this PPT design is completely editable. Download it and make adjustments in color, background, font etc. as per your unique business setting.


The mentioned slide presents the performance report of number of watches sold and revenue generated quarterly over the course of past 2 years. It showcases the sales and the profit earned quarterly. Showcasing this set of slides titled Product Periodic Sale And Profit Performance Report Topics PDF. The topics addressed in these templates are Product Category, Sub Category, Product . All the content presented in this PPT design is completely editable. Download it and make adjustments in color, background, font etc. as per your unique business setting.


This slide showcases dashboard that can help organization to analyse the sales of product after entering into niche market. Its key elements are sales, sales target, sales growth, sales by channel, inventory days outstanding etc. Crafting an eye-catching presentation has never been more straightforward. Let your presentation shine with this tasteful yet straightforward Dashboard To Track Product Sales Performance Gaining Competitive Advantage And Capturing Sample PDF template. It offers a minimalistic and classy look that is great for making a statement. The colors have been employed intelligently to add a bit of playfulness while still remaining professional. Construct the ideal Dashboard To Track Product Sales Performance Gaining Competitive Advantage And Capturing Sample PDF that effortlessly grabs the attention of your audience Begin now and be certain to wow your customers.


The following slide exhibits weekly sales data of proportion of selected healthy food products as function of total number of food products. It presents information related to week number. Showcasing this set of slides titled Weekly Sales Performance Data Of Proportionated Food Products Structure PDF. The topics addressed in these templates are Proportion Selected, Food Products, Week Number, Sales Highest. All the content presented in this PPT design is completely editable. Download it and make adjustments in color, background, font etc. as per your unique business setting.


This slide shows the dashboard the data related to the sales performance of the products manufactured by the organization in order to effectively measure and monitor the performance of the sales team. It shows details related to revenue generated and units sold etc.Pitch your topic with ease and precision using this Manufactured Products Sales Performance Monitoring Dashboard Information PDF. This layout presents information on Monthly Revenue, Manufactured Products, Sales Performance Monitoring. It is also available for immediate download and adjustment. So, changes can be made in the color, design, graphics or any other component to create a unique layout.


This slide showcases dashboard that can help organization to measure product sales performance after dual branding campaign. Its key components are sales, sales target, gross profit, sales by channel, inventory days outstanding, sales growth etc From laying roadmaps to briefing everything in detail, our templates are perfect for you. You can set the stage with your presentation slides. All you have to do is download these easy to edit and customizable templates. Dashboard For Measuring Product Sales Performance Multi Brand Promotion Campaign For Customer Engagement Professional PDF will help you deliver an outstanding performance that everyone would remember and praise you for. Do download this presentation today.


This slide showcases dashboard that can help organization to measure performance after launching dual branding campaign. Its key components are sales comparison, revenue by client, revenue by source and new customers by source. The best PPT templates are a great way to save time, energy, and resources. Slidegeeks have 100 percent editable powerpoint slides making them incredibly versatile. With these quality presentation templates, you can create a captivating and memorable presentation by combining visually appealing slides and effectively communicating your message. Download Dual Branding Campaign To Boost Sales Of Product Or Services Dashboard For Dual Branding Campaign Performance Infographics PDF from Slidegeeks and deliver a wonderful presentation.


This slide shows the KPI dashboard of client and product sales comparison. It also includes sales by location and total sales. Pitch your topic with ease and precision using this KPI Dashboard Of Customer And Product Sales Performance Comparison Information PDF. This layout presents information on Product Sales, Client Sales, Tim Santana. It is also available for immediate download and adjustment. So, changes can be made in the color, design, graphics or any other component to create a unique layout.


This slide shows client and product sales Performance comparison matrix. It includes top products and Customer of the organization. Showcasing this set of slides titled Customer And Product Sales Performance Comparison Matrix Introduction PDF. The topics addressed in these templates are Top Products, Top Customers, Sales. All the content presented in this PPT design is completely editable. Download it and make adjustments in color, background, font etc. as per your unique business setting.


This slide showcases dashboard that can help organization to measure product sales performance after dual branding campaign. Its key components are sales, sales target, gross profit, sales by channel, inventory days outstanding, sales growth etc. This Dashboard For Measuring Product Sales Performance Dual Branding Marketing Campaign Information PDF from Slidegeeks makes it easy to present information on your topic with precision. It provides customization options, so you can make changes to the colors, design, graphics, or any other component to create a unique layout. It is also available for immediate download, so you can begin using it right away. Slidegeeks has done good research to ensure that you have everything you need to make your presentation stand out. Make a name out there for a brilliant performance.


This slide showcases dashboard that can help organization to measure product sales performance after dual branding campaign. Its key components are sales, sales target, gross profit, sales by channel, inventory days outstanding, sales growth etc. Create an editable Developing Dual Branding Campaign For Brand Marketing Dashboard For Measuring Product Sales Performance Clipart PDF that communicates your idea and engages your audience. Whether you are presenting a business or an educational presentation, pre designed presentation templates help save time. Developing Dual Branding Campaign For Brand Marketing Dashboard For Measuring Product Sales Performance Clipart PDF is highly customizable and very easy to edit, covering many different styles from creative to business presentations. Slidegeeks has creative team members who have crafted amazing templates. So, go and get them without any delay.


This slide showcases dashboard that can help organization to measure product sales performance after dual branding campaign. Its key components are sales, sales target, gross profit, sales by channel, inventory days outstanding, sales growth etc. Do you have an important presentation coming up Are you looking for something that will make your presentation stand out from the rest Look no further than Dashboard For Measuring Product Sales Performance Dual Branding Campaign For Product Promotion Microsoft PDF. With our professional designs, you can trust that your presentation will pop and make delivering it a smooth process. And with Slidegeeks, you can trust that your presentation will be unique and memorable. So why wait Grab Dashboard For Measuring Product Sales Performance Dual Branding Campaign For Product Promotion Microsoft PDF today and make your presentation stand out from the rest.


This slide showcases dashboard that can help organization to analyse the sales of product after entering into niche market. Its key elements are sales, sales target, sales growth, sales by channel, inventory days outstanding etc.Take your projects to the next level with our ultimate collection of Dashboard To Track Product Sales Performance Implementing Focus Strategy To Improve Designs PDF. Slidegeeks has designed a range of layouts that are perfect for representing task or activity duration, keeping track of all your deadlines at a glance. Tailor these designs to your exact needs and give them a truly corporate look with your own brand colors they all make your projects stand out from the rest.


This slide shows the key performance indicators dashboard which can be used to analyze current financial position of cosmetic business. It includes metrics such as sales, expenses, profit, cash in hand, etc. Showcasing this set of slides titled KPI Dashboard To Track Beauty Care Products Sales Performance Ppt Outline Pictures PDF. The topics addressed in these templates are Sales Number, Total Sales, Total Profit, Cost. All the content presented in this PPT design is completely editable. Download it and make adjustments in color, background, font etc. as per your unique business setting.


This slide shows the key performance indicators dashboard which can be used to analyze current financial position of cosmetic business. It includes metrics such as sales, expenses, profit, cash in hand, etc. Showcasing this set of slides titled KPI Dashboard To Monitor Beauty Care Products Sales Performance Ppt Outline Example Topics PDF. The topics addressed in these templates are Accounts Receivable, Profit Margin, Expense. All the content presented in this PPT design is completely editable. Download it and make adjustments in color, background, font etc. as per your unique business setting.


This slide shows sales performance monitoring dashboard. Metrics included in the dashboard are sales revenue, sales growth, average revenue per unit, customer lifetime value and customer acquisition cost. This modern and well arranged Creating New Product Launch Campaign Strategy Kpi Dashboard To Monitor Sales Performance Introduction PDF provides lots of creative possibilities. It is very simple to customize and edit with the Powerpoint Software. Just drag and drop your pictures into the shapes. All facets of this template can be edited with Powerpoint no extra software is necessary. Add your own material, put your images in the places assigned for them, adjust the colors, and then you can show your slides to the world, with an animated slide included.


This slide illustrates sales representative performance measurement dashboard with key metrics such as average first contact resolution rate, occupancy rate, NPS and top agents by solved tickets. Make sure to capture your audiences attention in your business displays with our gratis customizable Creating New Product Launch Campaign Strategy Dashboard To Measure Sales Rep Performance Introduction PDF. These are great for business strategies, office conferences, capital raising or task suggestions. If you desire to acquire more customers for your tech business and ensure they stay satisfied, create your own sales presentation with these plain slides.
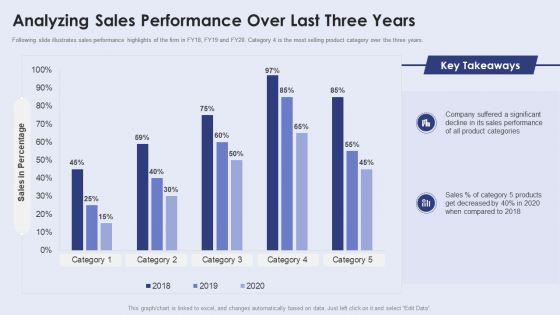
Following slide illustrates sales performance highlights of the firm in FY18, FY19 and FY20. Category 4 is the most selling product category over the three years. If your project calls for a presentation, then Slidegeeks is your go to partner because we have professionally designed, easy to edit templates that are perfect for any presentation. After downloading, you can easily edit Creating New Product Launch Campaign Strategy Analyzing Sales Performance Over Last Three Years Structure PDF and make the changes accordingly. You can rearrange slides or fill them with different images. Check out all the handy templates.


This slide displays a breakdown of sales results by particular product to monitor product demand and also to project product growth in the market. It includes units sold, annual income, and product revenue. Pitch your topic with ease and precision using this Sales Product Performance And Growth Kpis Ppt Layouts Mockup PDF. This layout presents information on Monthly Revenue, Product, Product Units. It is also available for immediate download and adjustment. So, changes can be made in the color, design, graphics or any other component to create a unique layout.


This slide depicts product annual sales performance in different regions. It includes a bar graph illustrating various trends occurred in 4 quarters with key observations. Showcasing this set of slides titled Region Wise Product Quarterly Sales Performance Chart Report Topics PDF. The topics addressed in these templates are Product Demand, Price, Low Quality. All the content presented in this PPT design is completely editable. Download it and make adjustments in color, background, font etc. as per your unique business setting.


This slide illustrates companys sales report bar graph. It includes comparison of annuals sales performance with different competitors products along with key insights. Showcasing this set of slides titled Product Wise Quarterly Sales Comparison Performance Chart Report Infographics PDF. The topics addressed in these templates are Product C Sales, Technology Upgrade, Financial Crisis. All the content presented in this PPT design is completely editable. Download it and make adjustments in color, background, font etc. as per your unique business setting.


Pitch your topic with ease and precision using this Sales Growth Graph Showing Annual Product Performance Slides PDF. This layout presents information on Sales Growth, Product Performance. It is also available for immediate download and adjustment. So, changes can be made in the color, design, graphics or any other component to create a unique layout.


Purpose of the following slide is to display the global sales of the product as it displays a world map that highlights the net sales of each region and provides the key takeaways for the same.This is a Yearly Product Performance Assessment Repor Understanding The Global Product Sales Introduction PDF template with various stages. Focus and dispense information on one stage using this creative set, that comes with editable features. It contains large content boxes to add your information on topics like Experienced Highest, Market Product, Corporation Witnessed You can also showcase facts, figures, and other relevant content using this PPT layout. Grab it now.


Purpose of the following slide is to show the product sales vs. product return ratio of the organization, the provided graph displays the sales of the product in each month in comparison to the returns.Deliver an awe inspiring pitch with this creative Yearly Product Performance Assessment Repor Product Sales Vs Product Return Information PDF bundle. Topics like Key Takeaways, Experienced Highest, Comparison Sales can be discussed with this completely editable template. It is available for immediate download depending on the needs and requirements of the user.


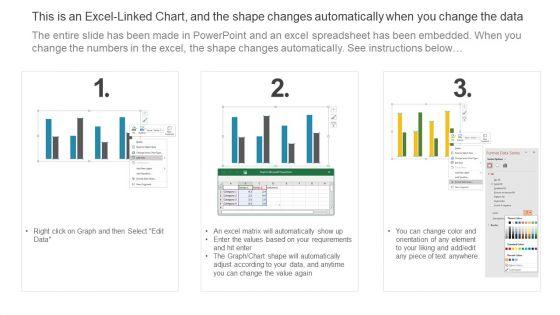
This graph or chart is linked to excel, and changes automatically based on data. Just left click on it and select Edit Data. Pitch your topic with ease and precision using this Weekly Sales Performance Highlights With Product Share Ppt File Information PDF. This layout presents information on Dashboard Summary, Weekly Sale, Product Share. It is also available for immediate download and adjustment. So, changes can be made in the color, design, graphics or any other component to create a unique layout.


This slide shows sales performance monitoring dashboard. Metrics included in the dashboard are sales revenue, sales growth, average revenue per unit, customer lifetime value and customer acquisition cost.Deliver an awe inspiring pitch with this creative Effective Sales Plan For New Product Introduction In Market KPI Dashboard To Monitor Sales Performance Portrait PDF bundle. Topics like Average Revenue, Country Performance, Customer Lifetime can be discussed with this completely editable template. It is available for immediate download depending on the needs and requirements of the user.


Following slide illustrates sales performance highlights of the firm in FY20, FY21 and FY22. Category 4 is the most selling product category over the three years.Deliver and pitch your topic in the best possible manner with this Effective Sales Plan For New Product Introduction In Market Analyzing Sales Performance Mockup PDF Use them to share invaluable insights on Company Suffered, Product Categories, Products Decreased and impress your audience. This template can be altered and modified as per your expectations. So, grab it now.


This graph or chart is linked to excel, and changes automatically based on data. Just left click on it and select Edit Data. Deliver an awe inspiring pitch with this creative State And Product Wise Sales Performance Scorecard Summary PDF bundle. Topics like State Wise Sales, Products Sale, Region Wise Sales can be discussed with this completely editable template. It is available for immediate download depending on the needs and requirements of the user.


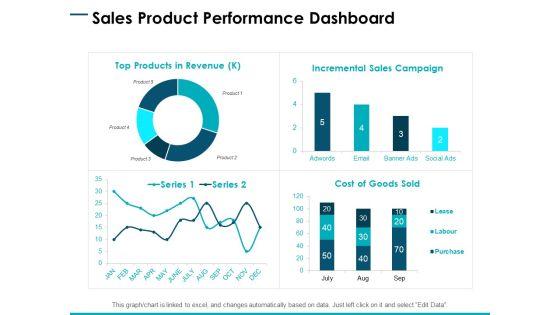
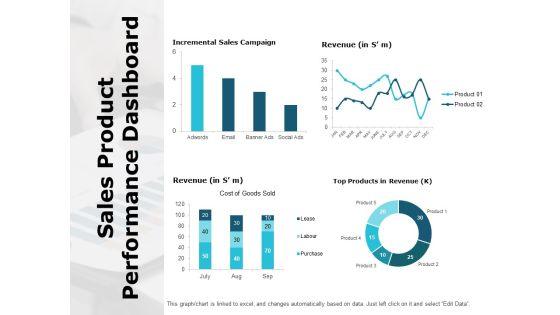
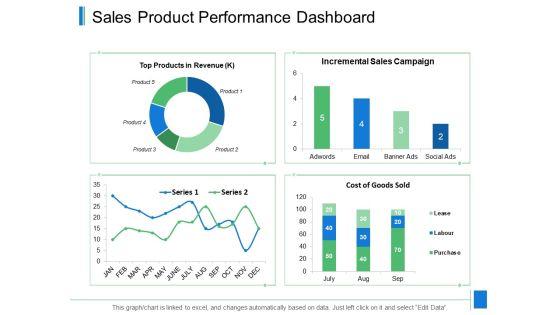
This graph or chart is linked to excel, and changes automatically based on data. Just left click on it and select Edit Data. Deliver an awe inspiring pitch with this creative Multiple Products Campaign Sales Performance Scorecard Download PDF bundle. Topics like Incremental Sales, Products Sales, Store Purchases can be discussed with this completely editable template. It is available for immediate download depending on the needs and requirements of the user.


This slide shows sales performance monitoring dashboard. Metrics included in the dashboard are sales revenue, sales growth, average revenue per unit, customer lifetime value and customer acquisition cost. Deliver an awe inspiring pitch with this creative New Product Sales Strategy And Marketing KPI Dashboard To Monitor Sales Performance Information PDF bundle. Topics like Sales Revenue, Monthly Sales Growth, Sales Country Performance can be discussed with this completely editable template. It is available for immediate download depending on the needs and requirements of the user.
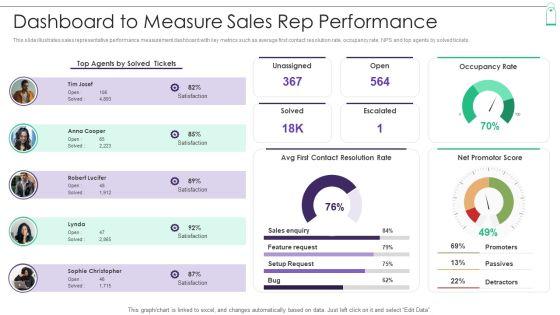
This slide illustrates sales representative performance measurement dashboard with key metrics such as average first contact resolution rate, occupancy rate, NPS and top agents by solved tickets. Deliver an awe inspiring pitch with this creative New Product Sales Strategy And Marketing Dashboard To Measure Sales Rep Performance Guidelines PDF bundle. Topics like Contact Resolution Rate, Contact Resolution Rate, Net Promoter Score can be discussed with this completely editable template. It is available for immediate download depending on the needs and requirements of the user.


Following slide illustrates sales performance highlights of the firm in FY20, FY21 and FY22. Category 5 is the most selling product category over the three years. Deliver an awe inspiring pitch with this creative New Product Sales Strategy And Marketing Analyzing Sales Performance Over Last Three Years Introduction PDF bundle. Topics like Project Management Roles, Job Opportunities, Product Categories can be discussed with this completely editable template. It is available for immediate download depending on the needs and requirements of the user.


This slide shows sales performance monitoring dashboard. Metrics included in the dashboard are sales revenue, sales growth, average revenue per unit, customer lifetime value and customer acquisition cost.Deliver an awe inspiring pitch with this creative Effective Sales Technique For New Product Launch KPI Dashboard To Monitor Sales Performance Graphics PDF bundle. Topics like Country Performance, Average Revenue, Customer Acquisition can be discussed with this completely editable template. It is available for immediate download depending on the needs and requirements of the user.


This slide illustrates sales representative performance measurement dashboard with key metrics such as average first contact resolution rate, occupancy rate, NPS and top agents by solved tickets.Deliver and pitch your topic in the best possible manner with this Effective Sales Technique For New Product Launch Dashboard To Measure Sales Rep Performance Themes PDF Use them to share invaluable insights on Contact Resolution, Feature Request, Promoters and impress your audience. This template can be altered and modified as per your expectations. So, grab it now.
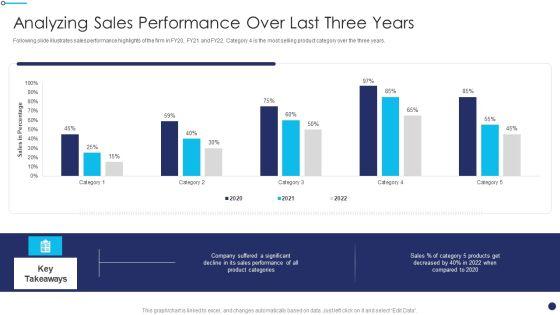

Following slide illustrates sales performance highlights of the firm in FY20, FY21 and FY22. Category 4 is the most selling product category over the three years.Deliver and pitch your topic in the best possible manner with this Effective Sales Technique For New Product Launch Analyzing Sales Performance Over Last Three Years Introduction PDF Use them to share invaluable insights on Sales Performance, Suffered Significant, Product Categories and impress your audience. This template can be altered and modified as per your expectations. So, grab it now.


This slide provides sales performance highlights in terms of net sales by business segment, geographic location and market maturity. It also covers sales performance of different brands with best selling and worst selling products. Deliver and pitch your topic in the best possible manner with this Sales Management Playbook Sales Performance Highlights For Products Offered Structure PDF Use them to share invaluable insights on Sales Performance Highlights For Products Offered and impress your audience. This template can be altered and modified as per your expectations. So, grab it now.
SHOW
- 60
- 120
- 180
DISPLAYING: 60 of 120 Item(s)
Page