 AI PPT Maker
 Templates
 PPT Bundles
 Design Services
 Business PPTs
 Business Plan
 Management
 Strategy
 Introduction PPT
 Roadmap
 Self Introduction
 Timelines
 Process
 Marketing
 Agenda
 Technology
 Medical
 Startup Business Plan
 Cyber Security
 Dashboards
 SWOT
SWOT Proposals
 Education
 Pitch Deck
 Digital Marketing
 KPIs
KPIs Project Management
 Product Management
 Artificial Intelligence
 Target Market
 Communication
 Supply Chain
 Google Slides
 Research Services
 One Pagers
 All Categories
Process kpis PowerPoint Presentation Templates and Google Slides
SHOW
- 60
- 120
- 180
DISPLAYING: 60 of 115 Item(s)
Page


This slide portrays key performance dashboard for measuring retail business performance. KPIs covered in the dashboards are average shopping time, shop visitors, average basket spend and customer retention. If you are looking for a format to display your unique thoughts, then the professionally designed Enhancing Retail Process By Effective Inventory Management KPI Dashboard For Retail Business Inspiration PDF is the one for you. You can use it as a Google Slides template or a PowerPoint template. Incorporate impressive visuals, symbols, images, and other charts. Modify or reorganize the text boxes as you desire. Experiment with shade schemes and font pairings. Alter, share or cooperate with other people on your work. Download Enhancing Retail Process By Effective Inventory Management KPI Dashboard For Retail Business Inspiration PDF and find out how to give a successful presentation. Present a perfect display to your team and make your presentation unforgettable.
This slide covers the dashboard that depicts metrics to track company sales performance that focuses on number of sales, cost breakdown, accumulated revenues, incremental sales, etc. Boost your pitch with our creative Implementing Change Management Strategy To Transform Business Processes Dashboard Depicting Kpis To Track Icons PDF. Deliver an awe-inspiring pitch that will mesmerize everyone. Using these presentation templates you will surely catch everyones attention. You can browse the ppts collection on our website. We have researchers who are experts at creating the right content for the templates. So you do not have to invest time in any additional work. Just grab the template now and use them.
This slide showcases the KPIs that would help a business organization to track the improvements in the new recruitment process. It includes technical hiring, non-technical hiring, current hiring pipeline, etc. This Tracking The Improvements In HR Recruitment Process With KPI Dashboard Introduction PDF from Slidegeeks makes it easy to present information on your topic with precision. It provides customization options, so you can make changes to the colors, design, graphics, or any other component to create a unique layout. It is also available for immediate download, so you can begin using it right away. Slidegeeks has done good research to ensure that you have everything you need to make your presentation stand out. Make a name out there for a brilliant performance.


Following slide depicts the IT industry KPI dashboard which will assist in generating more of profit by improving strategic plan according to changing environment with clients preferences .The KPI mentioned in a slide are such as risk analysis, outstanding task , upcoming task, budget analysis, etc. Pitch your topic with ease and precision using this Continuous Process Improvement KPI Dashboard For IT Industry Clipart PDF. This layout presents information on Overall Progress, Risk Analysis, Budget Analysis. It is also available for immediate download and adjustment. So, changes can be made in the color, design, graphics or any other component to create a unique layout.


Following slides shows the complete outline of healthcare business process improvement KPI dashboard which will assist in providing better services to patients . The major metrics mentioned in a slide are such as average patients discharge by hour or on weekly basis Showcasing this set of slides titled Business Continuous Process Improvement KPI Dashboard In Healthcare Industry Guidelines PDF. The topics addressed in these templates are Patients, Discharge List, Healthcare Industry. All the content presented in this PPT design is completely editable. Download it and make adjustments in color, background, font etc. as per your unique business setting.


This slide covers dashboard providing an insight related to how subscribers and resonating with email marketing campaign. It key performance metrics such as sessions from email, sessions from email by campaign, sessions by email by date etc. This Implementing Management System To Enhance Ecommerce Processes Email Campaign Performance KPI Dashboard Download PDF from Slidegeeks makes it easy to present information on your topic with precision. It provides customization options, so you can make changes to the colors, design, graphics, or any other component to create a unique layout. It is also available for immediate download, so you can begin using it right away. Slidegeeks has done good research to ensure that you have everything you need to make your presentation stand out. Make a name out there for a brilliant performance.
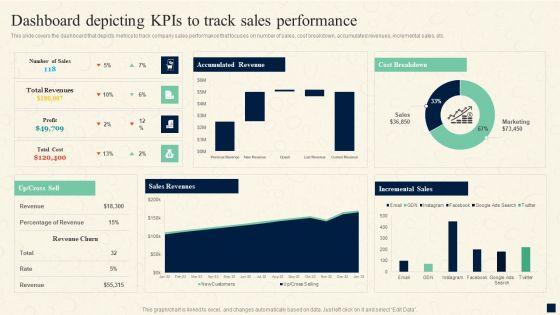
This slide covers the dashboard that depicts metrics to track company sales performance that focuses on number of sales, cost breakdown, accumulated revenues, incremental sales, etc. From laying roadmaps to briefing everything in detail, our templates are perfect for you. You can set the stage with your presentation slides. All you have to do is download these easy-to-edit and customizable templates. Change Management Process Dashboard Depicting Kpis To Track Sales Performance Introduction PDF will help you deliver an outstanding performance that everyone would remember and praise you for. Do download this presentation today.
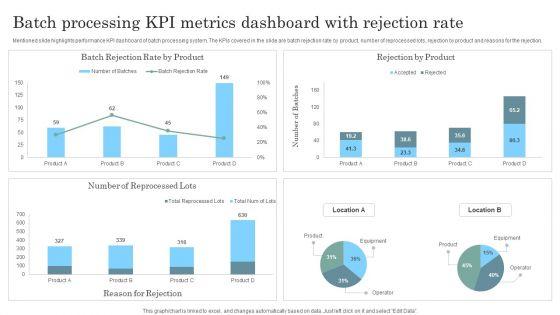
Mentioned slide highlights performance KPI dashboard of batch processing system. The KPIs covered in the slide are batch rejection rate by product, number of reprocessed lots, rejection by product and reasons for the rejection. Pitch your topic with ease and precision using this Batch Processing KPI Metrics Dashboard With Rejection Rate Topics PDF. This layout presents information on Batch Processing KPI Metrics, Dashboard Rejection Rate. It is also available for immediate download and adjustment. So, changes can be made in the color, design, graphics or any other component to create a unique layout.


This slide covers score for data obtained from core business activities and process. It includes quality metrics such as accuracy, completeness, consistency, integrity, timeliness, uniqueness and validity for data from business partners, finance, material management, sales, etc. Showcasing this set of slides titled Data Quality Kpis Metrics Scorecard For Core Business Processes Topics PDF. The topics addressed in these templates are Data Quality, Errors, Reports. All the content presented in this PPT design is completely editable. Download it and make adjustments in color, background, font etc. as per your unique business setting.


This slide depicts a dashboard to track the key performance metrics in sales and operations process of a manufacturing enterprise to analyze deviations in the actual and planned output. The key performing indicators are percentage deviation, dollar deviation, inventory in hand etc.Pitch your topic with ease and precision using this KPI Dashboard To Track Sales And Operations Process Of Manufacturing Enterprise Brochure PDF. This layout presents information on Planned Output, Yearly Growth, Inventory Hand. It is also available for immediate download and adjustment. So, changes can be made in the color, design, graphics or any other component to create a unique layout.


This slide shows KPI dashboard to monitor performance of recruitment process outsourcing. It includes metrics such as total applicants, shortlisted applicants, hired candidates, positions available, etc. Showcasing this set of slides titled KPI Dashboard To Track Recruitment Process Outsourcing Performance Information PDF. The topics addressed in these templates are Shortlisted Candidates, Hired Candidates, Rejected Candidates. All the content presented in this PPT design is completely editable. Download it and make adjustments in color, background, font etc. as per your unique business setting.


This slide depicts a dashboard for business managers to keep the track of performance order to cash process for effective decision making. The key elements are orders received, cash receivables, order to cash key performance indicators, days of inventory outstanding etc. Showcasing this set of slides titled KPI Dashboard To Track Performance Of Sales To Cash Process Download PDF. The topics addressed in these templates are Orders Received, Cash Receivables, Days Inventory Outstanding. All the content presented in this PPT design is completely editable. Download it and make adjustments in color, background, font etc. as per your unique business setting.


This slide showcase Robotic process automation KPI dashboard for tracking the impact of robots failure. It also include metrics such as total bots, successful bots, failed bots, average execution time, bots success rate, etc. Showcasing this set of slides titled Robotic Process Automation Metrics Performance Overview KPI Dashboard Download PDF. The topics addressed in these templates are Robotic Process Automation, Metrics Performance Overview, Kpi Dashboard. All the content presented in this PPT design is completely editable. Download it and make adjustments in color, background, font etc. as per your unique business setting.


This slide covers dashboard for service cases management with RPA deployment. It include metrics such as service cases by status, assignments within service level agreement, average handle time, NPS across channels, open cases past SLA, etc. Showcasing this set of slides titled Robotic Process Automation Metrics KPI Dashboard Themes PDF. The topics addressed in these templates are Average, Service Cases, Customer Satisfaction. All the content presented in this PPT design is completely editable. Download it and make adjustments in color, background, font etc. as per your unique business setting.


This slide showcases metrics tracker for managing robot utilization. It also include KPIs for analysis such as total utilization, robot types, average utilization per robot, robots with error, etc. Pitch your topic with ease and precision using this Robotic Process Automation Metrics Dashboard With Robot Utilization Kpis Background PDF. This layout presents information on Average Utilization, Robot Utilization, Automation Metrics Dashboard. It is also available for immediate download and adjustment. So, changes can be made in the color, design, graphics or any other component to create a unique layout.


This slide illustrates robotic process automation dashboard. It also includes tracking metrics such as robot run minutes, monthly FTE savings, monthly operation cost, ROI, Processes running, success rate per process. Showcasing this set of slides titled Robotic Process Automation Metrics Dashboard With Process Success Rate KPI Professional PDF The topics addressed in these templates are Processes Run, Monthly Operation Cost, Customer Service Bot. All the content presented in this PPT design is completely editable. Download it and make adjustments in color, background, font etc. as per your unique business setting.


This slide illustrates the KPI dashboard for tracking automation program data. It also include metrics such as idea velocity, forecasted savings, benefits deployed, benefits in pipeline, etc. Showcasing this set of slides titled Robotic Process Automation Metrics Accelerator Executive KPI Dashboard Formats PDF. The topics addressed in these templates are Opportunities, Benefit In Development, Value. All the content presented in this PPT design is completely editable. Download it and make adjustments in color, background, font etc. as per your unique business setting.
This slide covers RPA metrics for analyzing test execution on automated platforms. It also includes test execution metrics such as total test executed, test status, tests executed daily for different operation systems, etc. Pitch your topic with ease and precision using this Robotic Process Automation Dashboard With Monthly Test Execution KPI Icons PDF. This layout presents information on Robotic Process Automation Dashboard, Monthly Test Execution Kpi. It is also available for immediate download and adjustment. So, changes can be made in the color, design, graphics or any other component to create a unique layout.


This slide covers KPI dashboard for measuring the impact of RPA deployment on the HR department. It also include metrics such as automated processes, success rate, robot utilization, robot productivity, average processes duration in hours, etc. Showcasing this set of slides titled Human Resource Robotic Process Automation Metrics Operations Kpis With Success Rate Themes PDF. The topics addressed in these templates are Processes Automated, Robot Productivity, Robot Utilization. All the content presented in this PPT design is completely editable. Download it and make adjustments in color, background, font etc. as per your unique business setting.


BI Implementation To Enhance Hiring Process Workforce Performance Analysis Kpi Dashboard Formats PDF
This slide represents the dashboard representing key metrics to analyze the performance of overall workforce. It includes details related to absence rate, benefits satisfaction, engagement index etc.Are you in need of a template that can accommodate all of your creative concepts This one is crafted professionally and can be altered to fit any style. Use it with Google Slides or PowerPoint. Include striking photographs, symbols, depictions, and other visuals. Fill, move around, or remove text boxes as desired. Test out color palettes and font mixtures. Edit and save your work, or work with colleagues. Download BI Implementation To Enhance Hiring Process Workforce Performance Analysis Kpi Dashboard Formats PDF and observe how to make your presentation outstanding. Give an impeccable presentation to your group and make your presentation unforgettable.


The following slide outlines performance key performance indicator KPI which can be used to evaluate business process automation performance in employee onboarding. The metrics highlighted in the slide are onboarding completion status, hires per office, etc. There are so many reasons you need a BPA Tools For Process Enhancement And Cost Minimization KPI Dashboard To Track Automation Performance In Employee Onboarding Graphics PDF. The first reason is you can not spend time making everything from scratch, Thus, Slidegeeks has made presentation templates for you too. You can easily download these templates from our website easily.
This slide represents the KPI dashboard to track the multiple cost associated with supply chain in food manufacturing industry. It includes information regarding cash to cash cycle in days, carry cost of inventory along with details of net sales. There are so many reasons you need a Food Processing Industry Latest Insights Trends And Analytics KPI Dashboard For Tracking Supply Chain Costs Demonstration PDF. The first reason is you can not spend time making everything from scratch, Thus, Slidegeeks has made presentation templates for you too. You can easily download these templates from our website easily.


Following slide illustrates revenue and customers overview kpi dashboard for banks. KPIs covered in the dashboard are revenue actual vs target, number of new customers, customer acquisition cost vs. customer lifetime value. This Effective BPM Tool For Business Process Management Revenues And Customers Overview KPI Dashboard For Banks Elements PDF is perfect for any presentation, be it in front of clients or colleagues. It is a versatile and stylish solution for organizing your meetings. The Effective BPM Tool For Business Process Management Revenues And Customers Overview KPI Dashboard For Banks Elements PDF features a modern design for your presentation meetings. The adjustable and customizable slides provide unlimited possibilities for acing up your presentation. Slidegeeks has done all the homework before launching the product for you. So, do not wait, grab the presentation templates today.


This slide shows dashboard which can be used to monitor the progress of recruitment process. It includes metrics such as applications received, shortlisted applicant, selected candidates, etc. Pitch your topic with ease and precision using this Kpi Dashboard To Track Applicant Selection Process Ppt PowerPoint Presentation File Graphics Template PDF. This layout presents information on Applications Received, Shortlisted Candidates, Selected Candidates. It is also available for immediate download and adjustment. So, changes can be made in the color, design, graphics or any other component to create a unique layout.


This slide shows dashboard which can be used to compare insurance sales of current and previous year. It includes metrics such as monthly policy status, quarterly premium revenue, overall policy status, etc. Pitch your topic with ease and precision using this KPI Dashboard To Track Process Products Sold By Insurance Topics PDF. This layout presents information on Overall Policy Status, Quarterly Premium Revenue, Monthly Policy Status. It is also available for immediate download and adjustment. So, changes can be made in the color, design, graphics or any other component to create a unique layout.
This slide showcase the KPI dashboard for tracking new hire onboarding completion progress. It includes KPIs such as onboarding completion status, employees per office, progress chart, hires starting in current and next week. Showcasing this set of slides titled New Staff Onboarding Process KPI Tracking Dashboard Inspiration PDF. The topics addressed in these templates are New Staff Onboarding Process, KPI Tracking Dashboard. All the content presented in this PPT design is completely editable. Download it and make adjustments in color, background, font etc. as per your unique business setting.


This slide focuses on key performance indicators to measure social media recruitment success which includes time to hire, recruitment costs, age of applicants, recruitment funnel, ratio of male and female. Deliver an awe inspiring pitch with this creative Tactical Process For Social Kpis To Measure Social Media Recruitment Success Demonstration PDF bundle. Topics like Male Female Ratio, Recruitment Funnel, Number Applicants can be discussed with this completely editable template. It is available for immediate download depending on the needs and requirements of the user.


The following slide depicts the KPAs of software release management to analyze and monitor progress. It includes KPIs such as number of projects, accomplishment rate, task and bug fixation status, planned vs actual hours etc. Showcasing this set of slides titled Release Management Process Plan With KPI Dashboard Ppt Infographic Template Structure PDF. The topics addressed in these templates are Number Of Projects, Total Resources, Tasks Accomplishment Rate. All the content presented in this PPT design is completely editable. Download it and make adjustments in color, background, font etc. as per your unique business setting.


This slide describes how sales and marketing will be boost by incorporating AI which will further lead to business growth and profits. Deliver an awe inspiring pitch with this creative Data Processing Services Delivery Kpis For Service Delivery Sales And Marketing Summary PDF bundle. Topics like Count Elasticity, Elasticity, Band and Item, Average Elasticity, Customer Segment can be discussed with this completely editable template. It is available for immediate download depending on the needs and requirements of the user.


This slide depicts the KPIs for human resource service delivery with the help of AI and how some of these KPIs will be analyzed automatically through AI. Deliver and pitch your topic in the best possible manner with this Data Processing Services Delivery Kpis For Human Resource Service Delivery Background PDF. Use them to share invaluable insights on Employees Role, Compensation, Employees Country and impress your audience. This template can be altered and modified as per your expectations. So, grab it now.


This slide represents the KPIs for financial service delivery and how machine learning and AI can help to foresee the processes, insights that can benefit the financial sector. Deliver an awe inspiring pitch with this creative Data Processing Services Delivery Kpis For Financial Service Delivery Diagrams PDF bundle. Topics like Financial KPI Dashboard, Current Working Capital, Cash Conversion can be discussed with this completely editable template. It is available for immediate download depending on the needs and requirements of the user.


This slide shows the dashboard that depicts sales KPIs to track current status which involves won and lost opportunities, revenues and pipeline by territory, sales by different products, etc.Deliver and pitch your topic in the best possible manner with this Sales Process Automation For Revenue Growth Dashboard Depicting Sales Kpis To Track Current Status Introduction PDF. Use them to share invaluable insights on Marketing Effectiveness, Forecast Accuracy, Pipeline Thickness and impress your audience. This template can be altered and modified as per your expectations. So, grab it now.


This slide showcases KPIs that can help organization to measure the impact of new recruitment action plan. It can help organization to evaluate the change in employee attrition rate and job rejection rate.This is a Action Plan To Optimize Hiring Process Kpis To Measure Recruitment Action Plan Guidelines PDF template with various stages. Focus and dispense information on one stage using this creative set, that comes with editable features. It contains large content boxes to add your information on topics like Submit To Interview, Acceptance Rate, Turnover Rate You can also showcase facts, figures, and other relevant content using this PPT layout. Grab it now.


This slide covers reporting and spend analysis waterfall model. It also includes performance comparison based on time, such as last year, last quarte etc. Deliver and pitch your topic in the best possible manner with this Purchase Assessment Process Report And Analysis Through Kpis And Waterfall Model Graphics PDF Use them to share invaluable insights on Contracts Expiring, Currency Transactions, Favorable Adjustments and impress your audience. This template can be altered and modified as per your expectations. So, grab it now.


Deliver and pitch your topic in the best possible manner with this Purchase Assessment Process Procurement KPI Performance Benchmark Formats PDF Use them to share invaluable insights on Total Cost, Average Payment, Exchange Exposure and impress your audience. This template can be altered and modified as per your expectations. So, grab it now.
This slide covers devops KPI metrics dashboard with central processing unit statistics about input output statistics , network traffic volume under during recorded sessions. Further, this template includes numbers of sessions with waiting time.Showcasing this set of slides titled Development And Operations KPI Dashboard With Central Processing Unit Statistics Icons PDF The topics addressed in these templates are Central Processing, Output Statistics, Resource Limits All the content presented in this PPT design is completely editable. Download it and make adjustments in color, background, font etc. as per your unique business setting.


This slide represents dashboard to measure talent performance in organization. It includes talent applicant status, team training methods, talented candidate status, risk for loss of potential talent pool etc. Deliver an awe inspiring pitch with this creative Workforce Management Strategies For Effective Hiring Process Kpi Dashboard To Measure Talent Performance Formats PDF bundle. Topics like Potential Candidate, Talent Performance, Learning Platform can be discussed with this completely editable template. It is available for immediate download depending on the needs and requirements of the user.


Following slide highlights KPI dashboard for solid waste management which shows metrics like total material recycled by various categories, CO2 emissions by year, savings returned etc. Management can track such metrics to ensure waste management program is on track or not.Showcasing this set of slides titled Solid Waste Management Process KPI Dashboard Pictures PDF The topics addressed in these templates are Recycled Category, Sent Recycling, Tones Recycle All the content presented in this PPT design is completely editable. Download it and make adjustments in color, background, font etc. as per your unique business setting.


Mentioned here are the reasons for restructuring the organization such as low productivity, un clear roles and responsibilities and missing daily targets Deliver an awe inspiring pitch with this creative Organizational Restructuring Process Productivity Kpis Below Market Standards Information PDF bundle. Topics like Low Productivity, Roles And Responsibilities, Barriers And Bad Design can be discussed with this completely editable template. It is available for immediate download depending on the needs and requirements of the user.


Purpose of the following slide is to show the KPIs or key performance indicators for measuring the progress of operational strategy. These KPIs can be customer satisfaction rate, net promoter score, Downtime etc. This is a Six Sigma Continuous Process Kpis To Measure The Growth Of Operational Strategy Rules PDF template with various stages. Focus and dispense information on four stages using this creative set, that comes with editable features. It contains large content boxes to add your information on topics like Customer KPIs, Employee KPIs, Production KPIs. You can also showcase facts, figures, and other relevant content using this PPT layout. Grab it now.


This is a Playbook For Improving Production Process Kpis To Measure The Growth Of Operational Strategy Summary PDF template with various stages. Focus and dispense information on four stages using this creative set, that comes with editable features. It contains large content boxes to add your information on topics like Customer KPIs, Employee KPIs, Production KPIs. You can also showcase facts, figures, and other relevant content using this PPT layout. Grab it now.


Pitch your topic with ease and precision using this customer support kpi dashboard for evaluating sales business process outsourcing performance slides pdf. This layout presents information on customer support kpi dashboard for evaluating sales business process outsourcing performance. It is also available for immediate download and adjustment. So, changes can be made in the color, design, graphics or any other component to create a unique layout.


Social Media Hiring Process Optimization Kpis To Measure Social Media Recruitment Success Sample PDF
This slide focuses on key performance indicators to measure social media recruitment success which includes time to hire, recruitment costs, age of applicants, recruitment funnel, ratio of male and female.Deliver and pitch your topic in the best possible manner with this social media hiring process optimization kpis to measure social media recruitment success sample pdf Use them to share invaluable insights on kpis to measure social media recruitment success and impress your audience. This template can be altered and modified as per your expectations. So, grab it now.
This slide illustrates process to create key performance indicator framework which includes steps such as awareness, engagement, conversion and loyalty. It also includes the different types of kpis for each stage. Persuade your audience using this multistep process to create kpi framework ppt powerpoint presentation icon styles pdf This PPT design covers four stages, thus making it a great tool to use. It also caters to a variety of topics including awareness, conversion, engagement Download this PPT design now to present a convincing pitch that not only emphasizes the topic but also showcases your presentation skills.


This slide focuses on KPIs to measure customer centricity or base used by marketeer that covers customer lifetime value, customer equity, acquisition, retention on basis of early repeat rate, etc. Deliver an awe inspiring pitch with this creative new product development process optimization kpis to measure customer background pdf bundle. Topics like collecting background data, identifying stakeholders, defining company objectives analysing alternatives can be discussed with this completely editable template. It is available for immediate download depending on the needs and requirements of the user.


The following slide highlights comprehensive employment process dashboard. The metrics covered in the dashboard are total sources of applications, vacancies statistics, recruitment decision and recruitment pipeline. Showcasing this set of slides titled recruitment process kpi dashboard with cost per hire demonstration pdf. The topics addressed in these templates are recruitment pipeline, resources, cost. All the content presented in this PPT design is completely editable. Download it and make adjustments in color, background, font etc. as per your unique business setting.


This slide focuses on key performance indicators to track transportation management system performance which includes freight cost for each unit shipped, outbound and inbound freight costs, etc. Deliver an awe inspiring pitch with this creative optimizing logistics management process kpis to track transportation management system portrait pdf bundle. Topics like transportation time, billing accuracy, inbound freight costs can be discussed with this completely editable template. It is available for immediate download depending on the needs and requirements of the user.


Following slide demonstrates team KPI dashboard for evaluating team performance based on parameters such as conflict resolution, projects completion, workload management, team motivation etc. Deliver and pitch your topic in the best possible manner with this process optimization through product life process management techniques team kpi dashboard mockup pdf Use them to share invaluable insights on projects completed, workload efficiency, team conflict summary and impress your audience. This template can be altered and modified as per your expectations. So, grab it now.


This slide shows dashboard of metrics of product such as revenue, new customers, customer satisfaction, sales comparison, revenue by customer, source , etc. Deliver an awe inspiring pitch with this creative agile product life process management dashboard showing product performance kpis inspiration pdf bundle. Topics like dashboard showing product performance kpis can be discussed with this completely editable template. It is available for immediate download depending on the needs and requirements of the user.
Following slide illustrates vendor selection factors along with their key performance indicators. Selection factors covered are strategic commitment, capability and ability to meet requirement. Presenting instigating efficient value process vendors selection factors and kpis icons pdf to provide visual cues and insights. Share and navigate important information on five stages that need your due attention. This template can be used to pitch topics like strategic commitment, requirement, capability. In addtion, this PPT design contains high resolution images, graphics, etc, that are easily editable and available for immediate download.


Deliver and pitch your topic in the best possible manner with this key banking kpi dashboard develop organizational productivity by enhancing business process topics pdf. Use them to share invaluable insights on key banking kpi dashboard and impress your audience. This template can be altered and modified as per your expectations. So, grab it now.


This slide provides the projections of key performance indicators KPIs related to customer onboarding. KPIs covered in this slide include number of customers, customer churn rate, customer retention rate etc. Deliver an awe-inspiring pitch with this creative User Onboarding Process Development Projection Of Major Kpis Related To Customer Onboarding Guidelines PDF bundle. Topics like customer churn rate, customer retention rate, key performance indicator can be discussed with this completely editable template. It is available for immediate download depending on the needs and requirements of the user.


Deliver an awe inspiring pitch with this creative steps in m and a process cash flow statement kpis introduction pdf bundle. Topics like Investing Activities, Net Increase In Cash, Financing Activities, Operations can be discussed with this completely editable template. It is available for immediate download depending on the needs and requirements of the user.
SHOW
- 60
- 120
- 180
DISPLAYING: 60 of 115 Item(s)
Page