 AI PPT Maker
 Templates
 PPT Bundles
 Design Services
 Business PPTs
 Business Plan
 Management
 Strategy
 Introduction PPT
 Roadmap
 Self Introduction
 Timelines
 Process
 Marketing
 Agenda
 Technology
 Medical
 Startup Business Plan
 Cyber Security
 Dashboards
 SWOT
SWOT Proposals
 Education
 Pitch Deck
 Digital Marketing
 KPIs
KPIs Project Management
 Product Management
 Artificial Intelligence
 Target Market
 Communication
 Supply Chain
 Google Slides
 Research Services
 One Pagers
 All Categories
Performance ratio PowerPoint Presentation Templates and Google Slides
22 Item(s)


Presenting this set of slides with name availability key performance indicator inventory turnover ratio ppt powerpoint presentation icon themes. The topics discussed in these slides are availability kpi, availability dashboard, availability metrics. This is a completely editable PowerPoint presentation and is available for immediate download. Download now and impress your audience.


Showcasing this set of slides titled Company Financial Performance Investment Information Pitchbook With Debt To Equity Ratio Background PDF. The topics addressed in these templates are Investment Information, Pitchbook With Debt. All the content presented in this PPT design is completely editable. Download it and make adjustments in color, background, font etc. as per your unique business setting.


This showcases dashboard that can help organization to analyze the financial performance and ability to pay short term debts. Its key components are global financial performance, liquidity ratios and short term assets. Pitch your topic with ease and precision using this Global Financial Performance Dashboard With Liquidity Ratio Analysis Information PDF. This layout presents information on Short Term Assets, Global Financial Performance, Liquidity Ratios. It is also available for immediate download and adjustment. So, changes can be made in the color, design, graphics or any other component to create a unique layout.


This graph or chart is linked to excel, and changes automatically based on data. Just left click on it and select Edit Data. Pitch your topic with ease and precision using this Company Financial Performance Indicators Dashboard With Liquidity And Turnover Ratios Formats PDF. This layout presents information on Cash Balance, Days Inventory Outstanding, Days Payable Outstanding. It is also available for immediate download and adjustment. So, changes can be made in the color, design, graphics or any other component to create a unique layout.


This slide contains the information of the financial sector of the company to know where it stands and what needs to be done to improve the performance.It includes multiple ratios ROA, ROE, working capital ration and debt-equity ratio. Pitch your topic with ease and precision using this Financial Unsatisfactory Performance Dashboard With Accounting Ratios Diagrams PDF. This layout presents information on Return Assets, Working Capital, Return Equity. It is also available for immediate download and adjustment. So, changes can be made in the color, design, graphics or any other component to create a unique layout.
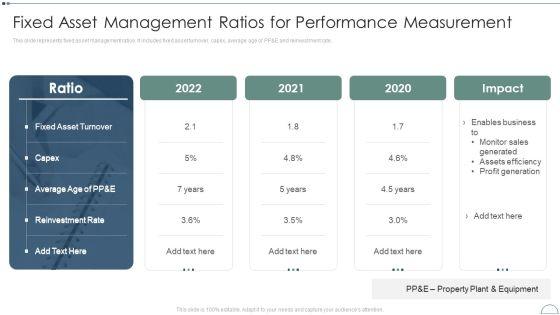

This slide represents fixed asset management ratios. It includes fixed asset turnover, capex, average age of PP E and reinvestment rate.Deliver and pitch your topic in the best possible manner with this Fixed Asset Management Framework Implementation Fixed Asset Management Ratios For Performance Measurement Topics PDF Use them to share invaluable insights on Fixed Asset, Reinvestment Rate, Average Age and impress your audience. This template can be altered and modified as per your expectations. So, grab it now.


Presenting monthly company performance analysiskey financial ratios diagrams pdf to provide visual cues and insights. Share and navigate important information on eight stages that need your due attention. This template can be used to pitch topics like price, ratio, equity. In addtion, this PPT design contains high resolution images, graphics, etc, that are easily editable and available for immediate download.


Deliver and pitch your topic in the best possible manner with this annual sales performance report with lead conversion ratio ppt ideas outfit pdf. Use them to share invaluable insights on conversion ratio, average deal size, sales team and impress your audience. This template can be altered and modified as per your expectations. So, grab it now.


Presenting this set of slides with name ratio assessment to track company performance ppt powerpoint presentation infographic template graphics pdf. The topics discussed in these slides are liquidity, capital structure, growth, profitability, gross profit margin. This is a completely editable PowerPoint presentation and is available for immediate download. Download now and impress your audience.


The following slide highlights the valuation ratio of the Food company to assess the organizations worth on the basis of share price, sales, and market capitalization, Key ratios included are enterprise value, EV per net sales, price to book value, market cap per sales, retention ratio and Earnings yield. Get a simple yet stunning designed Food Company Financial Performance Summary Food Business Firm Valuation Ratios Designs PDF. It is the best one to establish the tone in your meetings. It is an excellent way to make your presentations highly effective. So, download this PPT today from Slidegeeks and see the positive impacts. Our easy-to-edit Food Company Financial Performance Summary Food Business Firm Valuation Ratios Designs PDF can be your go-to option for all upcoming conferences and meetings. So, what are you waiting for Grab this template today.


The following slide highlights the profitability ratio of the Food company to assess the organizations capability to earn compared to its revenue. Key ratios included are EBDIT margin, EBIT margin, PBT margin, Net profit margin, and asset turnover percentage. Do you have to make sure that everyone on your team knows about any specific topic I yes, then you should give Food Company Financial Performance Summary Food Business Firm Profitability Ratios Download PDF a try. Our experts have put a lot of knowledge and effort into creating this impeccable Food Company Financial Performance Summary Food Business Firm Profitability Ratios Download PDF. You can use this template for your upcoming presentations, as the slides are perfect to represent even the tiniest detail. You can download these templates from the Slidegeeks website and these are easy to edit. So grab these today


The following slide highlights the liquidity ratio of the Food company to assess the organizations capability to pay off current debt and short term obligations. Key ratios included are current ratio, quick ratio, dividend payout, earning, and cash earning retention. There are so many reasons you need a Food Company Financial Performance Summary Food Business Firm Liquidity Ratios Icons PDF. The first reason is you can not spend time making everything from scratch, Thus, Slidegeeks has made presentation templates for you too. You can easily download these templates from our website easily.


The following slide highlights the valuation ratio of the software company to assess the organizations worth on the basis of share price, sales, and market capitalization, Key ratios included are enterprise value, EV per net sales, price to book value, market cap per sales, retention ratio and Earnings yield. Formulating a presentation can take up a lot of effort and time, so the content and message should always be the primary focus. The visuals of the PowerPoint can enhance the presenters message, so our Software Company Quarterly Valuation Ratios Financial Performance Report Of Software Firm Demonstration PDF was created to help save time. Instead of worrying about the design, the presenter can concentrate on the message while our designers work on creating the ideal templates for whatever situation is needed. Slidegeeks has experts for everything from amazing designs to valuable content, we have put everything into Software Company Quarterly Valuation Ratios Financial Performance Report Of Software Firm Demonstration PDF


The following slide highlights the profitability ratio of the software company to assess the organizations capability to earn compared to its revenue. Key ratios included are EBDIT margin, EBIT margin, PBT margin, Net profit margin, and asset turnover percentage. Make sure to capture your audiences attention in your business displays with our gratis customizable Software Company Quarterly Profitability Ratios Financial Performance Report Of Software Firm Icons PDF. These are great for business strategies, office conferences, capital raising or task suggestions. If you desire to acquire more customers for your tech business and ensure they stay satisfied, create your own sales presentation with these plain slides.


Software Company Quarterly Liquidity Ratios Financial Performance Report Of Software Firm Slides PDF
The following slide highlights the liquidity ratio of the software company to assess the organizations capability to pay off current debt and short term obligations. Key ratios included are current ratio, quick ratio, dividend payout, earning, and cash earning retention. Crafting an eye-catching presentation has never been more straightforward. Let your presentation shine with this tasteful yet straightforward Software Company Quarterly Liquidity Ratios Financial Performance Report Of Software Firm Slides PDF template. It offers a minimalistic and classy look that is great for making a statement. The colors have been employed intelligently to add a bit of playfulness while still remaining professional. Construct the ideal Software Company Quarterly Liquidity Ratios Financial Performance Report Of Software Firm Slides PDF that effortlessly grabs the attention of your audience Begin now and be certain to wow your customers.


This slide represents fixed asset management ratios. It includes fixed asset turnover, capex, average age of PPAndE and reinvestment rate.Are you searching for a Fixed Asset Management Ratios For Performance Measurement Organization Physical Assets Ideas PDF that is uncluttered, straightforward, and original Its easy to edit, and you can change the colors to suit your personal or business branding. For a presentation that expresses how much effort you ve put in, this template is ideal With all of its features, including tables, diagrams, statistics, and lists, its perfect for a business plan presentation. Make your ideas more appealing with these professional slides. Download Fixed Asset Management Ratios For Performance Measurement Organization Physical Assets Ideas PDF from Slidegeeks today.


This slide represents fixed asset management ratios. It includes fixed asset turnover, capex, average age of PPandE and reinvestment rate.Deliver an awe inspiring pitch with this creative Fixed Asset Management Ratios For Performance Measurement Implementing Fixed Asset Tracking Graphics PDF bundle. Topics like Fixed Asset, Reinvestment Rate, Profit Generation can be discussed with this completely editable template. It is available for immediate download depending on the needs and requirements of the user.


This slide represents fixed asset management ratios. It includes fixed asset turnover, capex, average age of PP And E and reinvestment rate. Deliver and pitch your topic in the best possible manner with this Implementing Fixed Asset Management Fixed Asset Management Ratios For Performance Themes PDF. Use them to share invaluable insights on Fixed Asset Turnover, Reinvestment Rate, 2020 To 2022 and impress your audience. This template can be altered and modified as per your expectations. So, grab it now.


This slide represents fixed asset management ratios. It includes fixed asset turnover, capex, average age of PP and E and reinvestment rate.Deliver and pitch your topic in the best possible manner with this Fixed Asset Management Ratios For Performance Measurement Inspiration PDF. Use them to share invaluable insights on Asset Turnover, Reinvestment Rate, Enables Business and impress your audience. This template can be altered and modified as per your expectations. So, grab it now.
22 Item(s)