 AI PPT Maker
 Templates
 PPT Bundles
 Design Services
 Business PPTs
 Business Plan
 Management
 Strategy
 Introduction PPT
 Roadmap
 Self Introduction
 Timelines
 Process
 Marketing
 Agenda
 Technology
 Medical
 Startup Business Plan
 Cyber Security
 Dashboards
 SWOT
SWOT Proposals
 Education
 Pitch Deck
 Digital Marketing
 KPIs
KPIs Project Management
 Product Management
 Artificial Intelligence
 Target Market
 Communication
 Supply Chain
 Google Slides
 Research Services
 One Pagers
 All Categories
Performance metrics dashboard PowerPoint Presentation Templates and Google Slides
SHOW
- 60
- 120
- 180
DISPLAYING: 60 of 150 Item(s)
Page


Following slide illustrates customer service dashboard covering details such as request answered, total requests, total revenue and support cost revenue. It also includes customer satisfaction score, customer retention in a 12 months format.Deliver and pitch your topic in the best possible manner with this Enterprise Sustainability Performance Metrics Customer Service Dashboard Professional PDF. Use them to share invaluable insights on Customer Satisfaction, Customer Retention, Support Revenue and impress your audience. This template can be altered and modified as per your expectations. So, grab it now.


Mentioned slide covers customer satisfaction dashboard with a 12-month format. It includes customer satisfaction details by region and by district. Deliver an awe inspiring pitch with this creative Enterprise Sustainability Performance Metrics Customer Satisfaction Dashboard Designs PDF bundle. Topics like Best Demonstrated, Worst Demonstrated, Variance Target can be discussed with this completely editable template. It is available for immediate download depending on the needs and requirements of the user.


Following slide covers cash flow dashboard covering details like beginning cash on hand, cash going in, cash going out, profit loss and ending cash on hand. It also includes detail of accounts receivable and payable.Deliver an awe inspiring pitch with this creative Enterprise Sustainability Performance Metrics Cash Flow Dashboard Inspiration PDF bundle. Topics like Accounts Receivable, Accounts Payable, Profit Loss can be discussed with this completely editable template. It is available for immediate download depending on the needs and requirements of the user.


Following slide illustrates customer service dashboard covering details such as request answered, total requests, total revenue and support cost revenue. It also includes customer satisfaction score, customer retention in a 12 months format. Deliver and pitch your topic in the best possible manner with this Metrics To Measure Business Performance Customer Service Dashboard Sample PDF. Use them to share invaluable insights on Requests Answered 2022, Total Requests 2022, Total Revenue 2022 and impress your audience. This template can be altered and modified as per your expectations. So, grab it now.


Mentioned slide covers customer satisfaction dashboard with a 12-month format. It includes customer satisfaction details by region and by district. Deliver an awe inspiring pitch with this creative Metrics To Measure Business Performance Customer Satisfaction Dashboard Summary PDF bundle. Topics like Best Demonstrated, Worst Demonstrated, 2020 can be discussed with this completely editable template. It is available for immediate download depending on the needs and requirements of the user.


Following slide covers cash flow dashboard covering details like beginning cash on hand, cash going in, cash going out, profit or loss and ending cash on hand. It also includes detail of accounts receivable and payable. Deliver an awe inspiring pitch with this creative Metrics To Measure Business Performance Cash Flow Dashboard Rules PDF bundle. Topics like Beginning Cash Hand, Cash Going Out, Accounts Payable, Accounts Receivable can be discussed with this completely editable template. It is available for immediate download depending on the needs and requirements of the user.


This slide covers dashboard to track effectiveness of referral program. It includes elements such as total revenue generation, MRR, total paying customers. It also includes total revenue earned and clicks, new referrals received, etc. This Referral Metrics Dashboard To Measure Program Performance Ppt PowerPoint Presentation Diagram Lists PDF from Slidegeeks makes it easy to present information on your topic with precision. It provides customization options, so you can make changes to the colors, design, graphics, or any other component to create a unique layout. It is also available for immediate download, so you can begin using it right away. Slidegeeks has done good research to ensure that you have everything you need to make your presentation stand out. Make a name out there for a brilliant performance.


This slide represents brand promotion dashboard highlighting performance post digital marketing. It includes sales quantity, return quantity, cost of goods, return amount etc. Do you have to make sure that everyone on your team knows about any specific topic I yes, then you should give Online Ads Strategic Plan For Effective Marketing Metric Dashboard Showcasing Brand Performance Post Themes PDF a try. Our experts have put a lot of knowledge and effort into creating this impeccable Online Ads Strategic Plan For Effective Marketing Metric Dashboard Showcasing Brand Performance Post Themes PDF. You can use this template for your upcoming presentations, as the slides are perfect to represent even the tiniest detail. You can download these templates from the Slidegeeks website and these are easy to edit. So grab these today.


This slide represents lean manufacturing dashboard for performance measurement. It covers equipment status timeline, downtime etc Want to ace your presentation in front of a live audience Our Production Metric Dashboard For Equipment Performance Measurement Slides PDF can help you do that by engaging all the users towards you. Slidegeeks experts have put their efforts and expertise into creating these impeccable powerpoint presentations so that you can communicate your ideas clearly. Moreover, all the templates are customizable, and easy to edit and downloadable. Use these for both personal and commercial use.


This slide represents brand promotion dashboard highlighting performance post digital marketing. It includes sales quantity, return quantity, cost of goods, return amount etc. There are so many reasons you need a Online Advertising Campaign For Brand Recognition Metric Dashboard Showcasing Brand Performance Structure PDF. The first reason is you cannot spend time making everything from scratch, Thus, Slidegeeks has made presentation templates for you too. You can easily download these templates from our website easily.


This slide provides information regarding essential characteristics of co-branding in terms of strategic partnership, build credibility, developing marketing strategy, develop innovation and value addition, etc. Make sure to capture your audiences attention in your business displays with our gratis customizable Performance Metrics Dashboard To Track Overall Rebranding Effectiveness Professional PDF. These are great for business strategies, office conferences, capital raising or task suggestions. If you desire to acquire more customers for your tech business and ensure they stay satisfied, create your own sales presentation with these plain slides.


This slide represents KPI dashboard for tracking supplier diversity in organization and measure performance. It provides information regarding organization spending cost, supplier count, diversity type, status etc. Pitch your topic with ease and precision using this Metric Dashboard To Track Supplier Diversity And Performance Designs PDF. This layout presents information on Diversity Type, Diversity Status, Diverse Supplier. It is also available for immediate download and adjustment. So, changes can be made in the color, design, graphics or any other component to create a unique layout.


This slide represents KPI dashboard showcasing diversity and inclusion strategy which helps in increased employee retention and higher revenue growth. It provides information regarding metrics such as qualified leads, supplier satisfaction, performance and compliance rate and gender diversity. Showcasing this set of slides titled Metric Dashboard Showcasing Diversity And Inclusion Strategy Performance Background PDF. The topics addressed in these templates are Performance, Gender Diversity, Performance. All the content presented in this PPT design is completely editable. Download it and make adjustments in color, background, font etc. as per your unique business setting.


This slide represents KPI dashboard to track product performance in the market. It covers various metrics such as customers, vendor, product category, revenue etc. Slidegeeks has constructed Management Plan For Product Life Cycle Metric Dashboard To Track Product Performance Infographics PDF after conducting extensive research and examination. These presentation templates are constantly being generated and modified based on user preferences and critiques from editors. Here, you will find the most attractive templates for a range of purposes while taking into account ratings and remarks from users regarding the content. This is an excellent jumping-off point to explore our content and will give new users an insight into our top-notch PowerPoint Templates.


This slide showcases dashboard depicting major customer service KPIs. The performance metrics covered are search exit rate, CSAT, average first response time, tickets solved, etc. Retrieve professionally designed Action Plan To Enhance Client Service Dashboard Depicting Performance Metrics Sample PDF to effectively convey your message and captivate your listeners. Save time by selecting pre made slideshows that are appropriate for various topics, from business to educational purposes. These themes come in many different styles, from creative to corporate, and all of them are easily adjustable and can be edited quickly. Access them as PowerPoint templates or as Google Slides themes. You do not have to go on a hunt for the perfect presentation because Slidegeeks got you covered from everywhere.


The purpose of this slide is to outline key performance indicator KPI dashboard which will assist the marketer to analyze mobile search engine optimization SEO performance. The key metrics mentioned in the slide are total sessions, search engine rankings etc. Take your projects to the next level with our ultimate collection of Introduction To Mobile SEM KPI Metrics Dashboard To Monitor Mobile SEO Performance Diagrams PDF. Slidegeeks has designed a range of layouts that are perfect for representing task or activity duration, keeping track of all your deadlines at a glance. Tailor these designs to your exact needs and give them a truly corporate look with your own brand colors they will make your projects stand out from the rest.


This slide provides an overview of the various KPIs tracked by the procurement department to determine the status. Major performance indicators covered are total, contracted and unlisted suppliers, rate of contract compliance, cycle time, total spending and savings. Slidegeeks has constructed Performance Metrics Dashboard Of Procurement Department Download PDF after conducting extensive research and examination. These presentation templates are constantly being generated and modified based on user preferences and critiques from editors. Here, you will find the most attractive templates for a range of purposes while taking into account ratings and remarks from users regarding the content. This is an excellent jumping off point to explore our content and will give new users an insight into our top notch PowerPoint Templates.


This slide showcases dashboard depicting major customer service KPIs. The performance metrics covered are search exit rate, CSAT, average first response time, tickets solved, etc. Take your projects to the next level with our ultimate collection of Dashboard Depicting Performance Metrics Of Customer Service Template PDF. Slidegeeks has designed a range of layouts that are perfect for representing task or activity duration, keeping track of all your deadlines at a glance. Tailor these designs to your exact needs and give them a truly corporate look with your own brand colors they will make your projects stand out from the rest.


This slide represents brand promotion dashboard highlighting performance post digital marketing. It includes sales quantity, return quantity, cost of goods, return amount etc. From laying roadmaps to briefing everything in detail, our templates are perfect for you. You can set the stage with your presentation slides. All you have to do is download these easy to edit and customizable templates. Guide Digital Advertising Optimize Lead Targeting Metric Dashboard Showcasing Brand Performance Post Slides PDF will help you deliver an outstanding performance that everyone would remember and praise you for. Do download this presentation today.


This slide showcases dashboard depicting major customer service KPIs. The performance metrics covered are search exit rate, CSAT, average first response time, tickets solved, etc. Formulating a presentation can take up a lot of effort and time, so the content and message should always be the primary focus. The visuals of the PowerPoint can enhance the presenters message, so our Techniques To Optimize UX Dashboard Depicting Performance Metrics Of Customer Clipart PDF was created to help save time. Instead of worrying about the design, the presenter can concentrate on the message while our designers work on creating the ideal templates for whatever situation is needed. Slidegeeks has experts for everything from amazing designs to valuable content, we have put everything into Techniques To Optimize UX Dashboard Depicting Performance Metrics Of Customer Clipart PDF.


The following slide outlines a comprehensive KPI dashboard which can be used to analyze the performance of Facebook video campaign. It provides information about page video views, page video views organic etc. Formulating a presentation can take up a lot of effort and time, so the content and message should always be the primary focus. The visuals of the PowerPoint can enhance the presenters message, so our KPI Metrics Dashboard To Evaluate Facebook Video Campaign Performance Introduction PDF was created to help save time. Instead of worrying about the design, the presenter can concentrate on the message while our designers work on creating the ideal templates for whatever situation is needed. Slidegeeks has experts for everything from amazing designs to valuable content, we have put everything into KPI Metrics Dashboard To Evaluate Facebook Video Campaign Performance Introduction PDF.


Mentioned slide outlines key performance indicator KPI dashboard which can be used by call center to optimize the agents performance. The major metrics covered in the template are total calls, average speed of answer, abandon rate, service level agreement SLA limit etc. Pitch your topic with ease and precision using this Metrics Dashboard Depicting Call Center Performance Pictures PDF. This layout presents information on Overall Satisfaction Score, Satisfaction Score, Performance. It is also available for immediate download and adjustment. So, changes can be made in the color, design, graphics or any other component to create a unique layout.


The purpose of this slide is to outline key performance indicator KPI dashboard which will assist the marketer to analyze mobile search engine optimization SEO performance. The key metrics mentioned in the slide are total sessions, search engine rankings etc. This Mobile Search Engine Optimization Plan KPI Metrics Dashboard To Monitor Mobile SEO Performance Inspiration PDF from Slidegeeks makes it easy to present information on your topic with precision. It provides customization options, so you can make changes to the colors, design, graphics, or any other component to create a unique layout. It is also available for immediate download, so you can begin using it right away. Slidegeeks has done good research to ensure that you have everything you need to make your presentation stand out. Make a name out there for a brilliant performance.


The following slide outlines a comprehensive KPI dashboard which can be used to analyze the performance of Facebook video campaign. It provides information about page video views, page video views organic etc. Whether you have daily or monthly meetings, a brilliant presentation is necessary. Kpi Metrics Dashboard To Evaluate Facebook Video Campaign Performance Information PDF can be your best option for delivering a presentation. Represent everything in detail using Kpi Metrics Dashboard To Evaluate Facebook Video Campaign Performance Information PDF and make yourself stand out in meetings. The template is versatile and follows a structure that will cater to your requirements. All the templates prepared by Slidegeeks are easy to download and edit. Our research experts have taken care of the corporate themes as well. So, give it a try and see the results.


This slide showcases dashboard depicting major customer service KPIs. The performance metrics covered are search exit rate, CSAT, average first response time, tickets solved, etc. There are so many reasons you need a Enhancing Client Experience Dashboard Depicting Performance Metrics Of Customer Service Structure PDF. The first reason is you cant spend time making everything from scratch, Thus, Slidegeeks has made presentation templates for you too. You can easily download these templates from our website easily.

This slide showcases dashboard depicting major customer service KPIs. The performance metrics covered are search exit rate, CSAT, average first response time, tickets solved, etc. There are so many reasons you need a Enhance Customer Engagement Through After Sales Activities Dashboard Depicting Performance Metrics Formats PDF. The first reason is you can not spend time making everything from scratch, Thus, Slidegeeks has made presentation templates for you too. You can easily download these templates from our website easily.


This slide provides an overview of customer feedback survey conducted to evaluate their satisfaction level. It includes description, steps and benefits which are measure customer satisfaction This modern and well arranged Service Improvement Techniques For Client Retention Dashboard Depicting Performance Metrics Diagrams PDF provides lots of creative possibilities. It is very simple to customize and edit with the Powerpoint Software. Just drag and drop your pictures into the shapes. All facets of this template can be edited with Powerpoint no extra software is necessary. Add your own material, put your images in the places assigned for them, adjust the colors, and then you can show your slides to the world, with an animated slide included.
Showcasing this set of slides titled Shipping Performance Analysis Tracking Metrics Dashboard Rules PDF. The topics addressed in these templates are Analysis Tracking Metrics Dashboard. All the content presented in this PPT design is completely editable. Download it and make adjustments in color, background, font etc. as per your unique business setting.


This slide presents a dashboard to measure and track performance of digital marketing activities using various metrics. It highlights element such as leads, users, users to leads, leads to MQLs, MQLs to SQLs, SQLs to opportunities, social events and social interactions. Retrieve professionally designed Strategic Guide To Perform Marketing Digital Marketing Metrics Dashboard To Track Diagrams PDF to effectively convey your message and captivate your listeners. Save time by selecting pre-made slideshows that are appropriate for various topics, from business to educational purposes. These themes come in many different styles, from creative to corporate, and all of them are easily adjustable and can be edited quickly. Access them as PowerPoint templates or as Google Slides themes. You dont have to go on a hunt for the perfect presentation because Slidegeeks got you covered from everywhere.


Presenting this PowerPoint presentation, titled Digital Marketing Approach For Brand Awareness Metric Dashboard Showcasing Brand Performance Post Marketing Mockup This slide represents brand promotion dashboard highlighting performance post digital marketing. It includes sales quantity, return quantity, cost of goods, return amount etc. PDF, with topics curated by our researchers after extensive research. This editable presentation is available for immediate download and provides attractive features when used. Download now and captivate your audience. Presenting this Digital Marketing Approach For Brand Awareness Metric Dashboard Showcasing Brand Performance Post Marketing Mockup PDF. Our researchers have carefully researched and created these slides with all aspects taken into consideration. This is a completely customizable Digital Marketing Approach For Brand Awareness Metric Dashboard Showcasing Brand Performance Post Marketing Mockup PDF that is available for immediate downloading. Download now and make an impact on your audience. Highlight the attractive features available with our PPTs.

Showcasing this set of slides titled Call Center Quality Key Performance Assurance Indicator Metrics Dashboard Portrait PDF. The topics addressed in these templates are Key Performance, Assurance Indicator, Metrics Dashboard. All the content presented in this PPT design is completely editable. Download it and make adjustments in color, background, font etc. as per your unique business setting.


This slide represents the dashboard prepared with the help of a PRM software. It includes details related to partner opportunity pipeline, MDF budget, leads, demo units, co brand requests, certified partners, partners logins etc. Showcasing this set of slides titled Partner Relationship Management Performance Metrics Dashboard Pictures PDF. The topics addressed in these templates are Partner Opportunity Pipeline, MDF Budget, Performance Metrics Dashboard. All the content presented in this PPT design is completely editable. Download it and make adjustments in color, background, font etc. as per your unique business setting.


This slide represents brand promotion dashboard highlighting performance post digital marketing. It includes sales quantity, return quantity, cost of goods, return amount etc. From laying roadmaps to briefing everything in detail, our templates are perfect for you. You can set the stage with your presentation slides. All you have to do is download these easy-to-edit and customizable templates. Deploying Online Marketing Metric Dashboard Showcasing Brand Performance Microsoft PDF will help you deliver an outstanding performance that everyone would remember and praise you for. Do download this presentation today.


The following slide outlines a comprehensive KPI dashboard which can be used by the organization to measure the automation performance in customer support department. It covers KPIs such as customer retention, costs per support, customer satisfaction, etc. This Introducing AI Tools KPI Metrics Dashboard To Measure Automation Performance Formats PDF is perfect for any presentation, be it in front of clients or colleagues. It is a versatile and stylish solution for organizing your meetings. The Introducing AI Tools KPI Metrics Dashboard To Measure Automation Performance Formats PDF features a modern design for your presentation meetings. The adjustable and customizable slides provide unlimited possibilities for acing up your presentation. Slidegeeks has done all the homework before launching the product for you. So, dont wait, grab the presentation templates today.


This slide represents brand promotion dashboard highlighting performance post digital marketing. It includes sales quantity, return quantity, cost of goods, return amount etc. Slidegeeks has constructed Implementation Of Digital Marketing Metric Dashboard Showcasing Brand Performance Diagrams PDF after conducting extensive research and examination. These presentation templates are constantly being generated and modified based on user preferences and critiques from editors. Here, you will find the most attractive templates for a range of purposes while taking into account ratings and remarks from users regarding the content. This is an excellent jumping-off point to explore our content and will give new users an insight into our top-notch PowerPoint Templates.


This slide provides information regarding essential characteristics of co-branding in terms of strategic partnership, build credibility, developing marketing strategy, develop innovation and value addition, etc. Coming up with a presentation necessitates that the majority of the effort goes into the content and the message you intend to convey. The visuals of a PowerPoint presentation can only be effective if it supplements and supports the story that is being told. Keeping this in mind our experts created Strengthening Brand Performance Metrics Dashboard To Track Overall Rebranding Themes PDF to reduce the time that goes into designing the presentation. This way, you can concentrate on the message while our designers take care of providing you with the right template for the situation.


This slide showcases dashboard depicting major customer service KPIs. The performance metrics covered are search exit rate, CSAT, average first response time, tickets solved, etc. Coming up with a presentation necessitates that the majority of the effort goes into the content and the message you intend to convey. The visuals of a PowerPoint presentation can only be effective if it supplements and supports the story that is being told. Keeping this in mind our experts created Customer Support Services Dashboard Depicting Performance Metrics Of Customer Designs PDF to reduce the time that goes into designing the presentation. This way, you can concentrate on the message while our designers take care of providing you with the right template for the situation.


This slide shows dashboard of the human resource analytics software. It includes details related to open positions, conversion ratio, offer accepted, cost of hiring by grade etc. Do you have to make sure that everyone on your team knows about any specific topic I yes, then you should give Analyzing And Deploying Human Resource Analytics Key Performance Metrics Dashboard Themes PDF a try. Our experts have put a lot of knowledge and effort into creating this impeccable Analyzing And Deploying Human Resource Analytics Key Performance Metrics Dashboard Themes PDF. You can use this template for your upcoming presentations, as the slides are perfect to represent even the tiniest detail. You can download these templates from the Slidegeeks website and these are easy to edit. So grab these today.


This slide shows supply chain inventory performance dashboard for analyzing supply trends over the years. It include metric such as inventory turnover, Percent of stock items and carrying cot MTD etc . Pitch your topic with ease and precision using this Supply Chain Stock Performance Metrics Dashboard Mockup PDF. This layout presents information on Supply Chain Stock, Performance Metrics Dashboard. It is also available for immediate download and adjustment. So, changes can be made in the color, design, graphics or any other component to create a unique layout.


This template covers KPI dashboard for measuring the impact of RPA on support team performance. It also include metrics such as average NPS, average desktop focus, application utilization, etc. Showcasing this set of slides titled Service Teams Performance Analysis Robotic Process Automation Metrics Dashboard Brochure PDF. The topics addressed in these templates are Opportunity, Production Goal Strategically, Application Utilization. All the content presented in this PPT design is completely editable. Download it and make adjustments in color, background, font etc. as per your unique business setting.


This slide showcase Robotic process automation KPI dashboard for tracking the impact of robots failure. It also include metrics such as total bots, successful bots, failed bots, average execution time, bots success rate, etc. Showcasing this set of slides titled Robotic Process Automation Metrics Performance Overview KPI Dashboard Download PDF. The topics addressed in these templates are Robotic Process Automation, Metrics Performance Overview, Kpi Dashboard. All the content presented in this PPT design is completely editable. Download it and make adjustments in color, background, font etc. as per your unique business setting.


This slide covers project engineering KPI dashboard on yearly basis. It involves KPIs such as total revenue, support cost, research and development cost and units economics. Pitch your topic with ease and precision using this Yearly Project Engineering Performance Metrics Dashboard Information PDF. This layout presents information on Support Cost, Revenue, Measures. It is also available for immediate download and adjustment. So, changes can be made in the color, design, graphics or any other component to create a unique layout.


This slide covers software engineering KPI dashboard to improve results and efficiency. It involves details such as new issues of last week, number of remaining issues, daily pull requests, average response time on daily basis and cumulative task flow. Pitch your topic with ease and precision using this Software Engineering Performance Metrics Dashboard To Improve Results Infographics PDF. This layout presents information on Software Engineering Performance, Metrics Dashboard Improve Results. It is also available for immediate download and adjustment. So, changes can be made in the color, design, graphics or any other component to create a unique layout.

This slide covers product engineering and development KPI dashboard to improve effectiveness. It involves data such as product development team, average result area scores and key result areas. Showcasing this set of slides titled Product Engineering Performance And Development Metrics Dashboard Topics PDF. The topics addressed in these templates are Product Development Team, Average, Cost. All the content presented in this PPT design is completely editable. Download it and make adjustments in color, background, font etc. as per your unique business setting.


This slide covers engineering KPI dashboard to track pull request. It involves KPIs such as open time of average pull requests, average comment received, revision rounds, frequency of posting pull requests. Pitch your topic with ease and precision using this Engineering Performance Metrics Dashboard To Track Pull Requests Background PDF. This layout presents information on Dashboard Track Pull Requests, Engineering Performance Metrics. It is also available for immediate download and adjustment. So, changes can be made in the color, design, graphics or any other component to create a unique layout.


This slide covers engineering KPI dashboard to track cost of cloud services. It involves KPIs such as average delay of product, cost of cloud services, pageview by browser and pull requests by projects. Showcasing this set of slides titled Engineering Performance Metrics Dashboard To Track Cloud Services Cost Clipart PDF. The topics addressed in these templates are Cost Of Cloud Services, Average, Product. All the content presented in this PPT design is completely editable. Download it and make adjustments in color, background, font etc. as per your unique business setting.


This slide covers engineering KPI dashboard to measure performance. It involves KPIs such as cycle time breakdown, risk breakdown, activities on focus and timeline. Pitch your topic with ease and precision using this Engineering Performance Metrics Dashboard For Measuring Performance Download PDF. This layout presents information on Average, Risk Breakdown, Measuring Performance. It is also available for immediate download and adjustment. So, changes can be made in the color, design, graphics or any other component to create a unique layout.


This slide covers construction project engineering KPI dashboard to analyse work status. It involves KPIs such as work status, projects by stage, completion percentage of projects, utilized duration, budget variance and workload. Showcasing this set of slides titled Construction Project Engineering Performance Metrics Dashboard Ideas PDF. The topics addressed in these templates are Budget Variance, Resource, Project. All the content presented in this PPT design is completely editable. Download it and make adjustments in color, background, font etc. as per your unique business setting.


This slide represents KPI dashboard for measuring product performance. It covers total activities, new customers, events, net promoter score etc. Welcome to our selection of the Strategies For Effective Product Metric Dashboard To Measure Product Performance Download PDF. These are designed to help you showcase your creativity and bring your sphere to life. Planning and Innovation are essential for any business that is just starting out. This collection contains the designs that you need for your everyday presentations. All of our PowerPoints are 100 percent editable, so you can customize them to suit your needs. This multi-purpose template can be used in various situations. Grab these presentation templates today.


This slide represents KPI dashboard for measuring product performance. It covers total activities, new customers, events, net promoter score etc.Coming up with a presentation necessitates that the majority of the effort goes into the content and the message you intend to convey. The visuals of a PowerPoint presentation can only be effective if it supplements and supports the story that is being told. Keeping this in mind our experts created Effective Product Development Strategy Metric Dashboard To Measure Product Performance Information PDF to reduce the time that goes into designing the presentation. This way, you can concentrate on the message while our designers take care of providing you with the right template for the situation.


This slide represents key metrics dashboard to analyze the engagement of employees in the organization. It includes details related to KPIs such as engagement score, response rate, net promoter score etc.Formulating a presentation can take up a lot of effort and time, so the content and message should always be the primary focus. The visuals of the PowerPoint can enhance the presenters message, so our BI Implementation To Enhance Hiring Process Employee Engagement Key Performance Metrics Dashboard Ideas PDF was created to help save time. Instead of worrying about the design, the presenter can concentrate on the message while our designers work on creating the ideal templates for whatever situation is needed. Slidegeeks has experts for everything from amazing designs to valuable content, we have put everything into BI Implementation To Enhance Hiring Process Employee Engagement Key Performance Metrics Dashboard Ideas PDF.


This slide provides information regarding essential characteristics of co branding in terms of strategic partnership, build credibility, developing marketing strategy, develop innovation and value addition, etc. Whether you have daily or monthly meetings, a brilliant presentation is necessary. Performance Metrics Dashboard To Track Overall Strategies For Rebranding Without Losing Ideas PDF can be your best option for delivering a presentation. Represent everything in detail using Performance Metrics Dashboard To Track Overall Strategies For Rebranding Without Losing Ideas PDF and make yourself stand out in meetings. The template is versatile and follows a structure that will cater to your requirements. All the templates prepared by Slidegeeks are easy to download and edit. Our research experts have taken care of the corporate themes as well. So, give it a try and see the results.


This slide provides information regarding essential characteristics of co-branding in terms of strategic partnership, build credibility, developing marketing strategy, develop innovation value addition, etc.Want to ace your presentation in front of a live audience Our Successful Rebranding Guide Performance Metrics Dashboard To Track Overall Rebranding Effectiveness Guidelines PDF can help you do that by engaging all the users towards you. Slidegeeks experts have put their efforts and expertise into creating these impeccable powerpoint presentations so that you can communicate your ideas clearly. Moreover, all the templates are customizable, and easy-to-edit and downloadable. Use these for both personal and commercial use.


The following slide outlines a comprehensive KPI dashboard which can be used by the organization to measure the automation performance in customer support department. It covers kpis such as customer retention, costs per support, customer satisfaction, etc. Present like a pro with KPI Metrics Dashboard To Measure Automation Performance In Customer Support Themes PDF Create beautiful presentations together with your team, using our easy to use presentation slides. Share your ideas in real time and make changes on the fly by downloading our templates. So whether you are in the office, on the go, or in a remote location, you can stay in sync with your team and present your ideas with confidence. With Slidegeeks presentation got a whole lot easier. Grab these presentations today.


This slide shows KPI dashboard to effectively track performance of business referral program in order to attract more leads and potential customers to the busines. It includes details related to key metrics such as referral participation rate, referred customers, referral conversion rate and total revenue generated. Showcasing this set of slides titled Business Referral Marketing Program Performance Metrics Dashboard Introduction PDF. The topics addressed in these templates are Referral Participation Rate, Referred Customers, Referral Conversion Rate, Total Revenue Generated. All the content presented in this PPT design is completely editable. Download it and make adjustments in color, background, font etc. as per your unique business setting.


This slide shows employee performance dashboard that helps to manage and monitor company staff. It includes various indicators such as absenteeism, overtime hours, overall labor effectiveness and training costs. Showcasing this set of slides titled Employee Performance Measurement Metrics Dashboard Brochure PDF. The topics addressed in these templates are Training Costs, Overall Labor Effectiveness. All the content presented in this PPT design is completely editable. Download it and make adjustments in color, background, font etc. as per your unique business setting.


This slide represents dashboard for workforce performance. It covers total employee count, average employee age, absenteeism rate, average employee tenure etc. If you are looking for a format to display your unique thoughts, then the professionally designed Metric Dashboard Showcasing Workforce Performance Post Training Ideas PDF is the one for you. You can use it as a Google Slides template or a PowerPoint template. Incorporate impressive visuals, symbols, images, and other charts. Modify or reorganize the text boxes as you desire. Experiment with shade schemes and font pairings. Alter, share or cooperate with other people on your work. Download Metric Dashboard Showcasing Workforce Performance Post Training Ideas PDF and find out how to give a successful presentation. Present a perfect display to your team and make your presentation unforgettable.


The purpose of this slide is to outline key performance indicator KPI dashboard which will assist the marketer to analyze mobile search engine optimization SEO performance. The key metrics mentioned in the slide are total sessions, search engine rankings etc.Find highly impressive KPI Metrics Dashboard To Monitor Mobile Performing Mobile SEO Audit To Analyze Web Traffic Graphics PDF on Slidegeeks to deliver a meaningful presentation. You can save an ample amount of time using these presentation templates. No need to worry to prepare everything from scratch because Slidegeeks experts have already done a huge research and work for you. You need to download KPI Metrics Dashboard To Monitor Mobile Performing Mobile SEO Audit To Analyze Web Traffic Graphics PDF for your upcoming presentation. All the presentation templates are 100 precent editable and you can change the color and personalize the content accordingly. Download now.
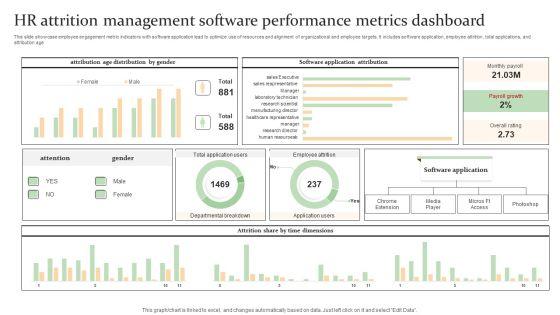

Showcasing this set of slides titled Attrition Management, Software Performance, Metrics Dashboard. The topics addressed in these templates are Attrition Management, Software Performance, Metrics Dashboard. All the content presented in this PPT design is completely editable. Download it and make adjustments in color, background, font etc. as per your unique business setting.


This slide represents metric dashboard for portfolio evaluation and performance monitoring. It covers project completion, top project risk, portfolio completion etc.Want to ace your presentation in front of a live audience Our Metric Dashboard For Portfolio Performance Monitoring Strategies To Enhance Portfolio Management Information PDF can help you do that by engaging all the users towards you.. Slidegeeks experts have put their efforts and expertise into creating these impeccable powerpoint presentations so that you can communicate your ideas clearly. Moreover, all the templates are customizable, and easy-to-edit and downloadable. Use these for both personal and commercial use.
SHOW
- 60
- 120
- 180
DISPLAYING: 60 of 150 Item(s)
Page