 AI PPT Maker
 Templates
 PPT Bundles
 Design Services
 Business PPTs
 Business Plan
 Management
 Strategy
 Introduction PPT
 Roadmap
 Self Introduction
 Timelines
 Process
 Marketing
 Agenda
 Technology
 Medical
 Startup Business Plan
 Cyber Security
 Dashboards
 SWOT
SWOT Proposals
 Education
 Pitch Deck
 Digital Marketing
 KPIs
KPIs Project Management
 Product Management
 Artificial Intelligence
 Target Market
 Communication
 Supply Chain
 Google Slides
 Research Services
 One Pagers
 All Categories
Performance kpi dashboard PowerPoint Presentation Templates and Google Slides
SHOW
- 60
- 120
- 180
DISPLAYING: 60 of 376 Item(s)
Page


This slide shows dashboard which can be used by organizations to measure the results of public relation strategy. It includes metrics such as media coverage rate, social media engagement rate, share of voice and brand mentions. This modern and well arranged Internal Promotion Strategy To Enhance Brand Awareness KPI Dashboard To Track PR Marketing Performance Ideas PDF provides lots of creative possibilities. It is very simple to customize and edit with the Powerpoint Software. Just drag and drop your pictures into the shapes. All facets of this template can be edited with Powerpoint no extra software is necessary. Add your own material, put your images in the places assigned for them, adjust the colors, and then you can show your slides to the world, with an animated slide included.


This slide shows dashboard which can be used by organizations to measure the results of public relation strategy. It includes metrics such as media coverage rate, social media engagement rate, share of voice and brand mentions. Make sure to capture your audiences attention in your business displays with our gratis customizable Public Relations Guide To Enhance Brand Credibility KPI Dashboard To Track PR Marketing Performance Diagrams PDF. These are great for business strategies, office conferences, capital raising or task suggestions. If you desire to acquire more customers for your tech business and ensure they stay satisfied, create your own sales presentation with these plain slides.


This slide shows dashboard which can be used by organizations to measure the results of sales plan. It includes metrics such as sales per product, actual vs target sales, sales by region, sales by channel, etc. Boost your pitch with our creative Boosting Yearly Business Revenue KPI Dashboard To Track Sales Plan Performance Topics PDF. Deliver an awe-inspiring pitch that will mesmerize everyone. Using these presentation templates you will surely catch everyones attention. You can browse the ppts collection on our website. We have researchers who are experts at creating the right content for the templates. So you dont have to invest time in any additional work. Just grab the template now and use them.


This slide shows dashboard which can be used by organizations to measure the results of public relation strategy. It includes metrics such as media coverage rate, social media engagement rate, share of voice and brand mentions. Present like a pro with Implementing Internal Marketing Kpi Dashboard To Track PR Marketing Performance Mockup PDF Create beautiful presentations together with your team, using our easy-to-use presentation slides. Share your ideas in real-time and make changes on the fly by downloading our templates. So whether youre in the office, on the go, or in a remote location, you can stay in sync with your team and present your ideas with confidence. With Slidegeeks presentation got a whole lot easier. Grab these presentations today.


Following slide illustrates customer service dashboard covering details such as request answered, total requests, total revenue and support cost revenue. It also includes customer satisfaction score, customer retention in a 12 months format. Deliver and pitch your topic in the best possible manner with this Customer Service Dashboard Company Performance Evaluation Using KPI Themes PDF. Use them to share invaluable insights on Requests Answered, Total Revenue, Customer Retention and impress your audience. This template can be altered and modified as per your expectations. So, grab it now.


Mentioned slide covers customer satisfaction dashboard with a 12 month format. It includes customer satisfaction details by region and by district. Deliver an awe inspiring pitch with this creative Customer Satisfaction Dashboard Company Performance Evaluation Using KPI Graphics PDF bundle. Topics like Customer Satisfaction, Dashboard, Best Demonstrated can be discussed with this completely editable template. It is available for immediate download depending on the needs and requirements of the user.


Following slide covers cash flow dashboard covering details like beginning cash on hand, cash going in, cash going out, profit loss and ending cash on hand. It also includes detail of accounts receivable and payable. Deliver an awe inspiring pitch with this creative Cash Flow Dashboard Company Performance Evaluation Using KPI Formats PDF bundle. Topics like Beginning Cash, Profit, Cash Flow Dashboard can be discussed with this completely editable template. It is available for immediate download depending on the needs and requirements of the user.


The following slide depicts paid advertisement campaign management dashboard to evaluate campaign success and facilitate investment decisions. It includes elements such as impressions, cost, clicks, cost per click, performance metrics by source etc. There are so many reasons you need a Guide For Marketing Analytics To Improve Decisions Paid Ad Campaign Performance Assessment KPI Dashboard Microsoft PDF. The first reason is you cannot spend time making everything from scratch, Thus, Slidegeeks has made presentation templates for you too. You can easily download these templates from our website easily.


The following slide depicts email campaign performance analytical dashboard to connect with audience and gather real time insights. It includes elements such as emails sent, unique subscribers, opens, clicks, investment and revenue by campaign type etc. Create an editable Guide For Marketing Analytics To Improve Decisions Email Campaign Performance Evaluation KPI Dashboard Summary PDF that communicates your idea and engages your audience. Whether youre presenting a business or an educational presentation, pre designed presentation templates help save time. Guide For Marketing Analytics To Improve Decisions Email Campaign Performance Evaluation KPI Dashboard Summary PDF is highly customizable and very easy to edit, covering many different styles from creative to business presentations. Slidegeeks has creative team members who have crafted amazing templates. So, go and get them without any delay.


The following slide outlines key performance indicator KPI dashboard outlining customer demographics. Information covered in this slide is related to metrics such as gender, education level, technology adoption life cycle, and brand innovation consent. Are you searching for a Analyzing Customer Demographics Through Performance KPI Dashboard Ppt PowerPoint Presentation File Model PDF that is uncluttered, straightforward, and original Its easy to edit, and you can change the colors to suit your personal or business branding. For a presentation that expresses how much effort you have put in, this template is ideal. With all of its features, including tables, diagrams, statistics, and lists, its perfect for a business plan presentation. Make your ideas more appealing with these professional slides. Download Analyzing Customer Demographics Through Performance KPI Dashboard Ppt PowerPoint Presentation File Model PDF from Slidegeeks today.


The following slide depicts key performance indicators to evaluate effectiveness of campaign performance. It includes elements such as total revenue, marketing spend, leads, cost per acquisition, profits, return on investments etc. This modern and well arranged Adopting IMC Technique To Boost Brand Recognition Kpi Dashboard To Review Campaign Performance Pictures PDF provides lots of creative possibilities. It is very simple to customize and edit with the Powerpoint Software. Just drag and drop your pictures into the shapes. All facets of this template can be edited with Powerpoint no extra software is necessary. Add your own material, put your images in the places assigned for them, adjust the colors, and then you can show your slides to the world, with an animated slide included.


The purpose of this slide is to delineate a comprehensive dashboard through which executives can evaluate website performance in real-time. The metrics mentioned in slide are total visits, average session duration, per visit, bounce rate, page views, goals conversion, etc. Crafting an eye catching presentation has never been more straightforward. Let your presentation shine with this tasteful yet straightforward Direct Marketing Techniques To Enhance Business Presence KPI Dashboard To Analyze Website Performance Background PDF template. It offers a minimalistic and classy look that is great for making a statement. The colors have been employed intelligently to add a bit of playfulness while still remaining professional. Construct the ideal Direct Marketing Techniques To Enhance Business Presence KPI Dashboard To Analyze Website Performance Background PDF that effortlessly grabs the attention of your audience. Begin now and be certain to wow your customers.


Mentioned slide showcases KPI dashboard that can be used to check the financial performance of a brand. Metrics covered in the dashboard are return on assets, working capital ratio, return on equity etc. Do you know about Slidesgeeks KPI Dashboard To Track Brand Performance Information PDF These are perfect for delivering any kind od presentation. Using it, create PowerPoint presentations that communicate your ideas and engage audiences. Save time and effort by using our pre designed presentation templates that are perfect for a wide range of topic. Our vast selection of designs covers a range of styles, from creative to business, and are all highly customizable and easy to edit. Download as a PowerPoint template or use them as Google Slides themes.


This slide covers dashboard providing an insight related to how subscribers and resonating with email marketing campaign. It key performance metrics such as sessions from email, sessions from email by campaign, sessions by email by date etc. Create an editable Implementing Effective Ecommerce Managemnet Platform Email Campaign Performance KPI Dashboard Mockup PDF that communicates your idea and engages your audience. Whether youre presenting a business or an educational presentation, pre designed presentation templates help save time. Implementing Effective Ecommerce Managemnet Platform Email Campaign Performance KPI Dashboard Mockup PDF is highly customizable and very easy to edit, covering many different styles from creative to business presentations. Slidegeeks has creative team members who have crafted amazing templates. So, go and get them without any delay.


This slide covers KPI dashboard to track employee performance at workplace. It involves details such as productivity rate, labour effectiveness rate, absentee rate and turnover ratio. Take your projects to the next level with our ultimate collection of KPI Dashboard To Track Employee Performance In Organization Demonstration PDF. Slidegeeks has designed a range of layouts that are perfect for representing task or activity duration, keeping track of all your deadlines at a glance. Tailor these designs to your exact needs and give them a truly corporate look with your own brand colors they will make your projects stand out from the rest.


This slide covers KPI dashboard to track employee performance at workplace. It involves details such as productivity rate, labour effectiveness rate, absentee rate and turnover ratio. This KPI Dashboard To Track Employee Performance In Organization Background PDF from Slidegeeks makes it easy to present information on your topic with precision. It provides customization options, so you can make changes to the colors, design, graphics, or any other component to create a unique layout. It is also available for immediate download, so you can begin using it right away. Slidegeeks has done good research to ensure that you have everything you need to make your presentation stand out. Make a name out there for a brilliant performance.


This slide shows dashboard to which can be used by organizations to measure website performance after content development. It includes metrics such as total page visits, page overview, post summary, etc. Showcasing this set of slides titled KPI Dashboard To Track Content Formulation Performance Microsoft PDF. The topics addressed in these templates are Metric, Post Reach, Page Impressions. All the content presented in this PPT design is completely editable. Download it and make adjustments in color, background, font etc. as per your unique business setting.


The following slide depicts a performance based dashboard to be used by brand managers to track the efficiency of marketing activities across platforms which has led to an increase in overall brand awareness. The key performing indicators are total website visits, user session, website mention, shares etc. Showcasing this set of slides titled Performance KPI Dashboard Highlighting Boosting Brand Image Sample PDF. The topics addressed in these templates are Social Media, Backlinks, Mentions Tags. All the content presented in this PPT design is completely editable. Download it and make adjustments in color, background, font etc. as per your unique business setting.


This slide covers dashboard providing an insight related to how subscribers and resonating with email marketing campaign. It key performance metrics such as sessions from email, sessions from email by campaign, sessions by email by date etc. This Implementing Management System To Enhance Ecommerce Processes Email Campaign Performance KPI Dashboard Download PDF from Slidegeeks makes it easy to present information on your topic with precision. It provides customization options, so you can make changes to the colors, design, graphics, or any other component to create a unique layout. It is also available for immediate download, so you can begin using it right away. Slidegeeks has done good research to ensure that you have everything you need to make your presentation stand out. Make a name out there for a brilliant performance.


This slide showcases KPI dashboard which can help managers display and review performance ratings. It provides details about adequate, needs help, supervisory skills, result areas, result area scores, etc. Unleash your creativity with our How Leaders Can Improve Team Effectiveness Team Performance Rating KPI Dashboard Rules PDF single-slide PPT template. Whether you are a seasoned presenter or a newbie, our editable and visually-stunning template will make your presentations shine. This template is versatile and easy to use. Make your presentations unforgettable with our premium template and leave a lasting impression on your audience.


This slide showcases KPI dashboard which can help sales team managers display and review performance rankings. It provides details about weekly sales score, target percentage, total target, sales team members, etc. Unleash your creativity with our How Leaders Can Improve Team Effectiveness Sales Team Performance Management KPI Dashboard Infographics PDF single-slide PPT template. Whether you are a seasoned presenter or a newbie, our editable and visually-stunning template will make your presentations shine. This template is versatile and easy to use. Make your presentations unforgettable with our premium template and leave a lasting impression on your audience.

This slide provides information regarding dashboard to monitor amazon performance. The kpis include tracking of product sales, conversion rate, advertising spends, session, organic sales, etc. Are you in need of a template that can accommodate all of your creative concepts This one is crafted professionally and can be altered to fit any style. Use it with Google Slides or PowerPoint. Include striking photographs, symbols, depictions, and other visuals. Fill, move around, or remove text boxes as desired. Test out color palettes and font mixtures. Edit and save your work, or work with colleagues. Download KPI Dashboard To Track Amazon Performance Ppt PowerPoint Presentation File Background Images PDF and observe how to make your presentation outstanding. Give an impeccable presentation to your group and make your presentation unforgettable.


Following slide demonstrates KPI dashboard for tracking retail store customer support service team performance for increase customer retention rate. It includes elements such as customer requests answered, total customer request, total revenue, support cost, customer satisfaction level, etc. Showcasing this set of slides titled KPI Dashboard To Monitor Performance Of Retail Store Consumer Services Summary PDF. The topics addressed in these templates are Customer Request, Customer Retention Rate, Customer Satisfaction Level. All the content presented in this PPT design is completely editable. Download it and make adjustments in color, background, font etc. as per your unique business setting.


Following slide demonstrates monthly real estate strategic sales progress KPI dashboard to determine business performance. It includes elements such as monthly sales comparison, yearly sales , revenue by project status, monthly sales trend, maximum sales by states and units sold by states. Showcasing this set of slides titled KPI Dashboard To Track Techniques Marketing Performance Of Real Estate Information PDF. The topics addressed in these templates are Revenue By Status, Monthly Sales Comparison, Monthly Sales Trend. All the content presented in this PPT design is completely editable. Download it and make adjustments in color, background, font etc. as per your unique business setting.


The following slide showcases model for enabling control of accounts. It presents information related to long term planning, investment plans, profit estimated, etc. Pitch your topic with ease and precision using this Accounting KPI Dashboard To Control System Financial Performance Formats PDF. This layout presents information on Sales Outstanding, Payable Outstanding, Sales Inventory. It is also available for immediate download and adjustment. So, changes can be made in the color, design, graphics or any other component to create a unique layout.


This slide showcases the parameters that would help the business organization to evaluate Pay Per Click PPC marketing performance. It includes ad cost, clicks, impression, conversions, ad impressions, conversion rate, Cost Per Click CPC, etc. Presenting this PowerPoint presentation, titled KPI Dashboard To Analyze PPC Marketing Campaigns Performance Information PDF, with topics curated by our researchers after extensive research. This editable presentation is available for immediate download and provides attractive features when used. Download now and captivate your audience. Presenting this KPI Dashboard To Analyze PPC Marketing Campaigns Performance Information PDF. Our researchers have carefully researched and created these slides with all aspects taken into consideration. This is a completely customizable KPI Dashboard To Analyze PPC Marketing Campaigns Performance Information PDF that is available for immediate downloading. Download now and make an impact on your audience. Highlight the attractive features available with our PPTs.


The purpose of this slide is to outline key performance indicator KPI dashboard which will assist the marketer to analyze mobile search engine optimization SEO performance. The key metrics mentioned in the slide are total sessions, search engine rankings etc. Take your projects to the next level with our ultimate collection of Introduction To Mobile SEM KPI Metrics Dashboard To Monitor Mobile SEO Performance Diagrams PDF. Slidegeeks has designed a range of layouts that are perfect for representing task or activity duration, keeping track of all your deadlines at a glance. Tailor these designs to your exact needs and give them a truly corporate look with your own brand colors they will make your projects stand out from the rest.


Mentioned slide showcases KPI dashboard that can be used to check the financial performance of a brand. Metrics covered in the dashboard are return on assets, working capital ratio, return on equity etc. Coming up with a presentation necessitates that the majority of the effort goes into the content and the message you intend to convey. The visuals of a PowerPoint presentation can only be effective if it supplements and supports the story that is being told. Keeping this in mind our experts created Developing Market Leading Businesses KPI Dashboard To Track Brand Performance Summary PDF to reduce the time that goes into designing the presentation. This way, you can concentrate on the message while our designers take care of providing you with the right template for the situation.


This slide represents dashboard to measure talent performance in organization. It includes talent applicant status, team training methods, talented candidate status, risk for loss of potential talent pool etc. Are you in need of a template that can accommodate all of your creative concepts This one is crafted professionally and can be altered to fit any style. Use it with Google Slides or PowerPoint. Include striking photographs, symbols, depictions, and other visuals. Fill, move around, or remove text boxes as desired. Test out color palettes and font mixtures. Edit and save your work, or work with colleagues. Download Kpi Dashboard To Measure Talent Performance Brochure PDF and observe how to make your presentation outstanding. Give an impeccable presentation to your group and make your presentation unforgettable.


This slide showcases the parameters that would help the business organization to evaluate buzz marketing performance. It includes user metrics, campaign metrics, social metrics, engagement rate, viral sign-ups, etc. Take your projects to the next level with our ultimate collection of Kpi Dashboard To Analyze Buzz Marketing Campaigns Performance Download PDF. Slidegeeks has designed a range of layouts that are perfect for representing task or activity duration, keeping track of all your deadlines at a glance. Tailor these designs to your exact needs and give them a truly corporate look with your own brand colors they will make your projects stand out from the rest.
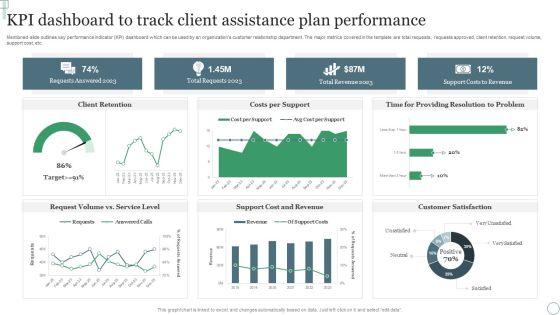

Mentioned slide outlines key performance indicator KPI dashboard which can be used by an organizations customer relationship department. The major metrics covered in the template are total requests, requests approved, client retention, request volume, support cost, etc. Pitch your topic with ease and precision using this KPI Dashboard To Track Client Assistance Plan Performance Ppt Professional Outfit PDF. This layout presents information on Requests Answered 2023, Total Requests 2023, Total Revenue 2023. It is also available for immediate download and adjustment. So, changes can be made in the color, design, graphics or any other component to create a unique layout.


This slide provides information regarding dashboard to monitor Amazon performance. The KPIs include tracking of product sales, conversion rate, advertising spends, session, organic sales, etc. The Amazon Tactical Plan KPI Dashboard To Track Amazon Performance Clipart PDF is a compilation of the most recent design trends as a series of slides. It is suitable for any subject or industry presentation, containing attractive visuals and photo spots for businesses to clearly express their messages. This template contains a variety of slides for the user to input data, such as structures to contrast two elements, bullet points, and slides for written information. Slidegeeks is prepared to create an impression.


Following slide demonstrates KPI dashboard to monitor performance of sales executives to determine best performing employee. It includes key components such as monthly performance, targets achieved, sales by executives, lead funnel, total daily and monthly profits. Pitch your topic with ease and precision using this KPI Dashboard To Monitor Operational Sales Executive Performance Portrait PDF. This layout presents information on Revenue, Profit, Sales, Customers. It is also available for immediate download and adjustment. So, changes can be made in the color, design, graphics or any other component to create a unique layout.
The following slide illustrates dashboard which helps brand managers to improve their communication campaign performance. It presents information related to campaigns, cost per acquisitions, etc. Pitch your topic with ease and precision using this KPI Dashboard For Tracking Brand Communication Techniques Performance Topics PDF. This layout presents information on KPI Dashboard, Tracking Brand Communication, Techniques Performance. It is also available for immediate download and adjustment. So, changes can be made in the color, design, graphics or any other component to create a unique layout.
This slide covers the dashboard for analyzing paid search metrics such as ad cost, clicks, impressions, click-through rate, cost per conversion, conversion rate, cost per click, etc. Here you can discover an assortment of the finest PowerPoint and Google Slides templates. With these templates, you can create presentations for a variety of purposes while simultaneously providing your audience with an eye catching visual experience. Download Marketers Guide To Data Analysis Optimization KPI Dashboard For Tracking Paid Ad Campaign Performance Clipart PDF to deliver an impeccable presentation. These templates will make your job of preparing presentations much quicker, yet still, maintain a high level of quality. Slidegeeks has experienced researchers who prepare these templates and write high quality content for you. Later on, you can personalize the content by editing the Marketers Guide To Data Analysis Optimization KPI Dashboard For Tracking Paid Ad Campaign Performance Clipart PDF.


The purpose of this slide is to showcase KPI metrics dashboard which can be used to monitor the important aspects of SaaS businesses. The dashboard covers different metrics such as monthly recurring revenue MRR, average revenue per unit ARPU, etc. Pitch your topic with ease and precision using this Saas Company KPI Dashboard To Analyze Saas Business Performance Elements PDF. This layout presents information on Monthly Recurring Revenue, Customer Lifetime Value, Average Revenue Per Unit, Annual Contract Value, Customer Acquisition Cost. It is also available for immediate download and adjustment. So, changes can be made in the color, design, graphics or any other component to create a unique layout.


The purpose of this slide is to showcase metrics dashboard which can be used to effectively monitor the sales of SaaS company. The metrics covered in the slide are total sales, average impressions, average CTR, impressions breakdown, etc. Showcasing this set of slides titled KPI Dashboard To Measure Sales Performance Of Saas Company Summary PDF. The topics addressed in these templates are Total Sales, Average Sale, Count Of Sales, Average Impressions, Average Ctr. All the content presented in this PPT design is completely editable. Download it and make adjustments in color, background, font etc. as per your unique business setting.


This slide provides an overview of the SaaS metrics dashboard. The company can track the overall progress of their business model by tracking metrics such as quality leads, ARPA, signups past 4 weeks, net MRR churn rate, new business MRR, etc. Pitch your topic with ease and precision using this KPI Dashboard To Measure Performance Of Saas Company Introduction PDF. This layout presents information on Industry, Position, Customers, Quality Leads. It is also available for immediate download and adjustment. So, changes can be made in the color, design, graphics or any other component to create a unique layout.
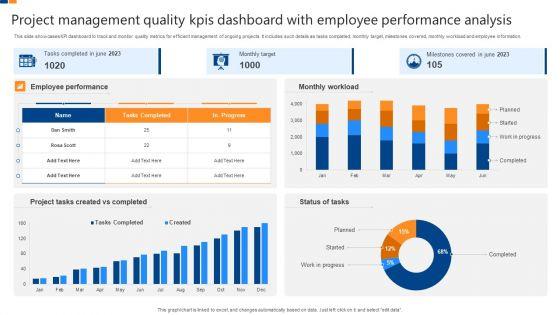

This slide showcases KPI dashboard to track and monitor quality metrics for efficient management of ongoing projects. It includes such details as tasks completed, monthly target, milestones covered, monthly workload and employee information. Showcasing this set of slides titled Project Management Quality Kpis Dashboard With Employee Performance Analysis Professional PDF. The topics addressed in these templates are Employee Performance, Monthly Workload, Milestones Covered, Monthly Target, Project Tasks Created Completed. All the content presented in this PPT design is completely editable. Download it and make adjustments in color, background, font etc. as per your unique business setting.


This slide showcases the parameters that would help the business organization to evaluate paid media marketing performance. It includes metrics such as cost per acquisition CPA, monthly conversion by channel, ad impressions, daily paid social clicks, etc. Present like a pro with KPI Dashboard To Analyze Paid Marketing Campaigns Performance Background PDF Create beautiful presentations together with your team, using our easy to use presentation slides. Share your ideas in real time and make changes on the fly by downloading our templates. So whether you are in the office, on the go, or in a remote location, you can stay in sync with your team and present your ideas with confidence. With Slidegeeks presentation got a whole lot easier. Grab these presentations today.


Following slide outlines a KPI dashboard which can be used by companies to evaluate the performance of stocks in various sectors. The KPIs mentioned in the slide are total investment in various countries, total portfolio value, yield cost ratio etc. Pitch your topic with ease and precision using this KPI Dashboard To Analyze Share Market Sector Wise Performance Summary PDF. This layout presents information on Sector Sheets, Dividends Vs Unrealized, Investment Style. It is also available for immediate download and adjustment. So, changes can be made in the color, design, graphics or any other component to create a unique layout.


This slide showcases shipping performance dashboard that can help to do the comparative assessment of different logistics companies. It also include KPIs such as shipments, completed deliveries, on time deliveries, on going deliveries average delivery duration etc. Pitch your topic with ease and precision using this Logistics Management Performance Comparison Dashboard With Kpis Sample PDF. This layout presents information on Shipments, Completed Deliveries, Actual Delivery Duration. It is also available for immediate download and adjustment. So, changes can be made in the color, design, graphics or any other component to create a unique layout.


This slide covers staff performance management KPI dashboard to analyze current situation in organization. It involves details such as number of employees, average employee turnover, absenteeism rate etc. Whether you have daily or monthly meetings, a brilliant presentation is necessary. Techniques To Optimize Workforce Performance Management Kpi Dashboard Professional PDF can be your best option for delivering a presentation. Represent everything in detail using Techniques To Optimize Workforce Performance Management Kpi Dashboard Professional PDF and make yourself stand out in meetings. The template is versatile and follows a structure that will cater to your requirements. All the templates prepared by Slidegeeks are easy to download and edit. Our research experts have taken care of the corporate themes as well. So, give it a try and see the results.


This slide covers dashboard to analyze performance of training program. It involves details such as total number of classes, compensation cost, training hours and employee satisfaction rate. Slidegeeks is here to make your presentations a breeze with Techniques To Optimize Kpi Dashboard To Assess Employee Training Performance Designs PDF With our easy-to-use and customizable templates, you can focus on delivering your ideas rather than worrying about formatting. With a variety of designs to choose from, youre sure to find one that suits your needs. And with animations and unique photos, illustrations, and fonts, you can make your presentation pop. So whether youre giving a sales pitch or presenting to the board, make sure to check out Slidegeeks first.


This slide represents the dashboard representing key metrics to analyze the performance of overall workforce. It includes details related to absence rate, benefits satisfaction, engagement index etc. Here you can discover an assortment of the finest PowerPoint and Google Slides templates. With these templates, you can create presentations for a variety of purposes while simultaneously providing your audience with an eye-catching visual experience. Download Tools For HR Business Analytics Workforce Performance Analysis KPI Dashboard Pictures PDF to deliver an impeccable presentation. These templates will make your job of preparing presentations much quicker, yet still, maintain a high level of quality. Slidegeeks has experienced researchers who prepare these templates and write high-quality content for you. Later on, you can personalize the content by editing the Tools For HR Business Analytics Workforce Performance Analysis KPI Dashboard Pictures PDF.


The following slide depicts the campaign keyword results to grab valuable insights and refine targeting. It includes key performance indicators such as cost per lead, total page likes, exit rate, organic click through rate, website traffic average ranking etc. Get a simple yet stunning designed Search Engine Marketing Keyword Performance Analysis With Kpi Dashboard Brochure PDF. It is the best one to establish the tone in your meetings. It is an excellent way to make your presentations highly effective. So, download this PPT today from Slidegeeks and see the positive impacts. Our easy-to-edit Search Engine Marketing Keyword Performance Analysis With Kpi Dashboard Brochure PDF can be your go-to option for all upcoming conferences and meetings. So, what are you waiting for Grab this template today.
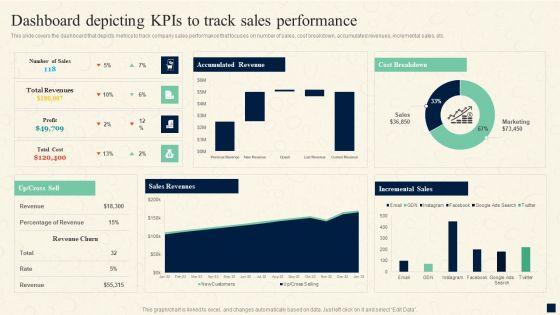
This slide covers the dashboard that depicts metrics to track company sales performance that focuses on number of sales, cost breakdown, accumulated revenues, incremental sales, etc. From laying roadmaps to briefing everything in detail, our templates are perfect for you. You can set the stage with your presentation slides. All you have to do is download these easy-to-edit and customizable templates. Change Management Process Dashboard Depicting Kpis To Track Sales Performance Introduction PDF will help you deliver an outstanding performance that everyone would remember and praise you for. Do download this presentation today.


This slide shows the dashboard which can be used by marketing department monitor online marketing performance. It includes details regarding conversions from google ads, website , Facebook, Instagram, etc. Crafting an eye-catching presentation has never been more straightforward. Let your presentation shine with this tasteful yet straightforward Service Promotion Plan KPI Dashboard To Track Social Media Marketing Performance Slides PDF template. It offers a minimalistic and classy look that is great for making a statement. The colors have been employed intelligently to add a bit of playfulness while still remaining professional. Construct the ideal Service Promotion Plan KPI Dashboard To Track Social Media Marketing Performance Slides PDF that effortlessly grabs the attention of your audience Begin now and be certain to wow your customers.


The following slide depicts the overview of staff performance management system to achieve goals and evaluate business growth. It includes key elements such as absenteeism rate, overtime hours, training costs, labor effectiveness etc. Slidegeeks is one of the best resources for PowerPoint templates. You can download easily and regulate Effective Staff Performance Optimization Techniques Employee Performance Management Kpi Dashboard Professional PDF for your personal presentations from our wonderful collection. A few clicks is all it takes to discover and get the most relevant and appropriate templates. Use our Templates to add a unique zing and appeal to your presentation and meetings. All the slides are easy to edit and you can use them even for advertisement purposes.
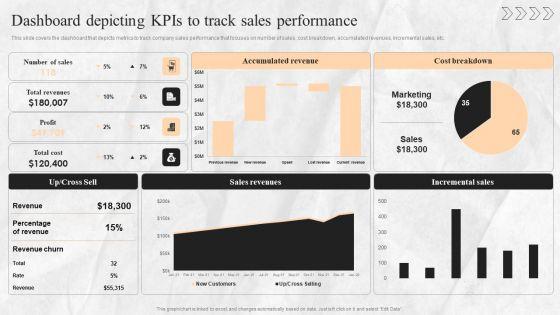

This slide covers the dashboard that depicts metrics to track company sales performance that focuses on number of sales, cost breakdown, accumulated revenues, incremental sales, etc. Are you in need of a template that can accommodate all of your creative concepts This one is crafted professionally and can be altered to fit any style. Use it with Google Slides or PowerPoint. Include striking photographs, symbols, depictions, and other visuals. Fill, move around, or remove text boxes as desired. Test out color palettes and font mixtures. Edit and save your work, or work with colleagues. Download Digital Transition Plan For Managing Business Dashboard Depicting Kpis To Track Sales Performance Guidelines PDF and observe how to make your presentation outstanding. Give an impeccable presentation to your group and make your presentation unforgettable.


This slide represents the key performance indicator dashboard to analyse go to market strategy performance. It includes trail leads by region, key conversion metrics, top social media channel and web traffic targets Pitch your topic with ease and precision using this KPI Dashboard To Measure Go To Market Launch Strategy Performance Sample PDF. This layout presents information on Lead Breakdown, Lead By Program, Trial Leads Region. It is also available for immediate download and adjustment. So, changes can be made in the color, design, graphics or any other component to create a unique layout.


The following slide outlines KPI metrics dashboard of Instagram video marketing. The KPIs covered in the slide are followers, engagement, likes, comments, impressions, reach, video views and saves. This modern and well arranged Performance KPI Dashboard To Analyze Instagram Marketing Strategy Performance Information PDF provides lots of creative possibilities. It is very simple to customize and edit with the Powerpoint Software. Just drag and drop your pictures into the shapes. All facets of this template can be edited with Powerpoint no extra software is necessary. Add your own material, put your images in the places assigned for them, adjust the colors, and then you can show your slides to the world, with an animated slide included.


The following slide outlines a comprehensive KPI dashboard which can be used to analyze the performance of Facebook video campaign. It provides information about page video views, page video views organic etc. Formulating a presentation can take up a lot of effort and time, so the content and message should always be the primary focus. The visuals of the PowerPoint can enhance the presenters message, so our KPI Metrics Dashboard To Evaluate Facebook Video Campaign Performance Introduction PDF was created to help save time. Instead of worrying about the design, the presenter can concentrate on the message while our designers work on creating the ideal templates for whatever situation is needed. Slidegeeks has experts for everything from amazing designs to valuable content, we have put everything into KPI Metrics Dashboard To Evaluate Facebook Video Campaign Performance Introduction PDF.


This slide provides information regarding dashboard to monitor Amazon performance. The KPIs include tracking of product sales, conversion rate, advertising spends, session, organic sales, etc. Do you have to make sure that everyone on your team knows about any specific topic I yes, then you should give Amazon Strategic Growth Initiative On Global Scale KPI Dashboard To Track Amazon Performance Themes PDF a try. Our experts have put a lot of knowledge and effort into creating this impeccable Amazon Strategic Growth Initiative On Global Scale KPI Dashboard To Track Amazon Performance Themes PDF. You can use this template for your upcoming presentations, as the slides are perfect to represent even the tiniest detail. You can download these templates from the Slidegeeks website and these are easy to edit. So grab these today.


The purpose of this slide is to outline key performance indicator KPI dashboard which will assist the marketer to analyze mobile search engine optimization SEO performance. The key metrics mentioned in the slide are total sessions, search engine rankings etc. This Mobile Search Engine Optimization Plan KPI Metrics Dashboard To Monitor Mobile SEO Performance Inspiration PDF from Slidegeeks makes it easy to present information on your topic with precision. It provides customization options, so you can make changes to the colors, design, graphics, or any other component to create a unique layout. It is also available for immediate download, so you can begin using it right away. Slidegeeks has done good research to ensure that you have everything you need to make your presentation stand out. Make a name out there for a brilliant performance.


The following slide outlines KPI metrics dashboard of Instagram video marketing. The KPIs covered in the slide are followers, engagement, likes, comments, impressions, reach, video views and saves. Find highly impressive Performance Kpi Dashboard To Analyze Instagram Marketing Strategy Performance Microsoft PDF on Slidegeeks to deliver a meaningful presentation. You can save an ample amount of time using these presentation templates. No need to worry to prepare everything from scratch because Slidegeeks experts have already done a huge research and work for you. You need to download Performance Kpi Dashboard To Analyze Instagram Marketing Strategy Performance Microsoft PDF for your upcoming presentation. All the presentation templates are 100 percent editable and you can change the color and personalize the content accordingly. Download now.


The following slide outlines a comprehensive KPI dashboard which can be used to analyze the performance of Facebook video campaign. It provides information about page video views, page video views organic etc. Whether you have daily or monthly meetings, a brilliant presentation is necessary. Kpi Metrics Dashboard To Evaluate Facebook Video Campaign Performance Information PDF can be your best option for delivering a presentation. Represent everything in detail using Kpi Metrics Dashboard To Evaluate Facebook Video Campaign Performance Information PDF and make yourself stand out in meetings. The template is versatile and follows a structure that will cater to your requirements. All the templates prepared by Slidegeeks are easy to download and edit. Our research experts have taken care of the corporate themes as well. So, give it a try and see the results.
SHOW
- 60
- 120
- 180
DISPLAYING: 60 of 376 Item(s)
Page