AI PPT Maker
Templates
PPT Bundles
Design Services
Business PPTs
Business Plan
Management
Strategy
Introduction PPT
Roadmap
Self Introduction
Timelines
Process
Marketing
Agenda
Technology
Medical
Startup Business Plan
Cyber Security
Dashboards
SWOT
Proposals
Education
Pitch Deck
Digital Marketing
KPIs
Project Management
Product Management
Artificial Intelligence
Target Market
Communication
Supply Chain
Google Slides
Research Services
 One Pagers
All Categories
Performance comparison PowerPoint Presentation Templates and Google Slides
SHOW
- 60
- 120
- 180
DISPLAYING: 60 of 157 Item(s)
Page








Slide 1 of 14
This Customer Sales Performance Comparison Ppt PowerPoint Presentation Complete Deck With Slides acts as backup support for your ideas, vision, thoughts, etc. Use it to present a thorough understanding of the topic. This PPT slideshow can be utilized for both in-house and outside presentations depending upon your needs and business demands. Entailing fourteen slides with a consistent design and theme, this template will make a solid use case. As it is intuitively designed, it suits every business vertical and industry. All you have to do is make a few tweaks in the content or any other component to design unique presentations. The biggest advantage of this complete deck is that it can be personalized multiple times once downloaded. The color, design, shapes, and other elements are free to modify to add personal touches. You can also insert your logo design in this PPT layout. Therefore a well-thought and crafted presentation can be delivered with ease and precision by downloading this Customer Sales Performance Comparison Ppt PowerPoint Presentation Complete Deck With Slides PPT slideshow.


Slide 1 of 12
Key Performance Indicators Comparison Analysis Ppt PowerPoint Presentation Complete Deck With Slides
Improve your presentation delivery using this Key Performance Indicators Comparison Analysis Ppt PowerPoint Presentation Complete Deck With Slides. Support your business vision and objectives using this well-structured PPT deck. This template offers a great starting point for delivering beautifully designed presentations on the topic of your choice. Comprising twalve this professionally designed template is all you need to host discussion and meetings with collaborators. Each slide is self-explanatory and equipped with high-quality graphics that can be adjusted to your needs. Therefore, you will face no difficulty in portraying your desired content using this PPT slideshow. This PowerPoint slideshow contains every important element that you need for a great pitch. It is not only editable but also available for immediate download and utilization. The color, font size, background, shapes everything can be modified to create your unique presentation layout. Therefore, download it now.


Slide 1 of 12
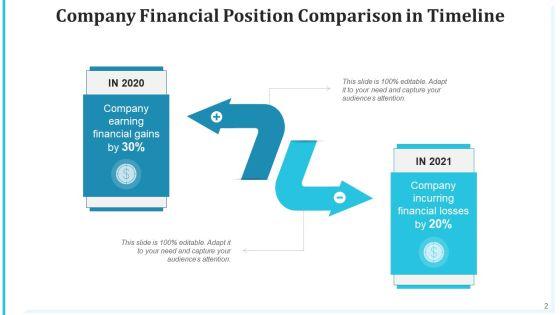
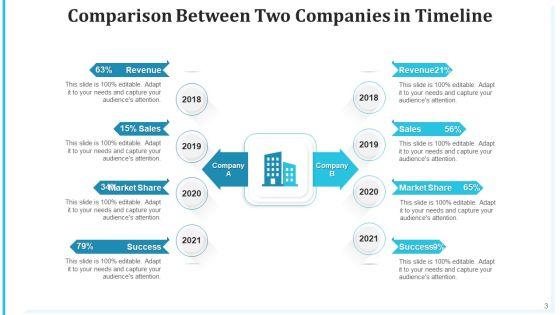
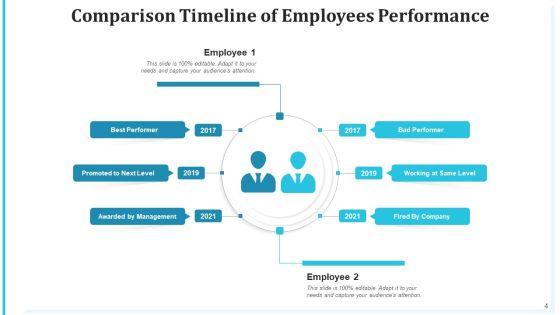
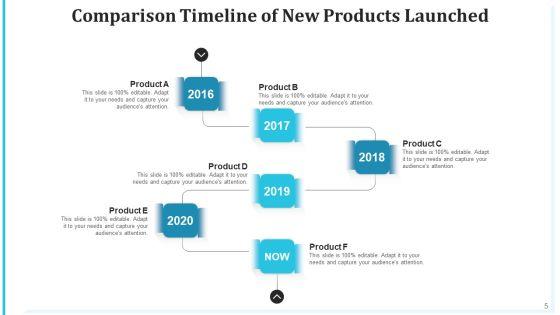
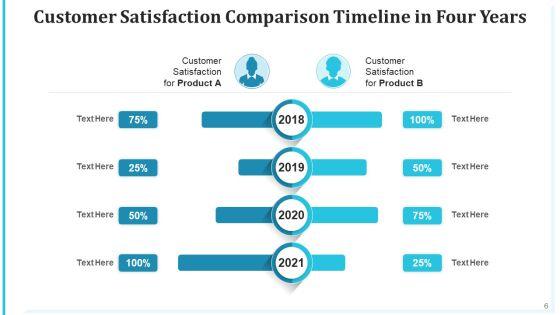
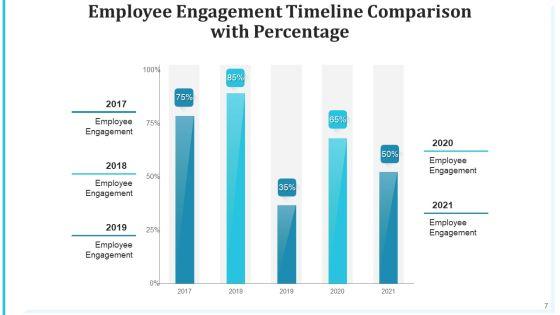
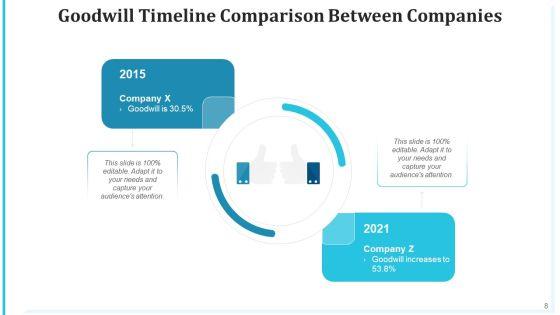
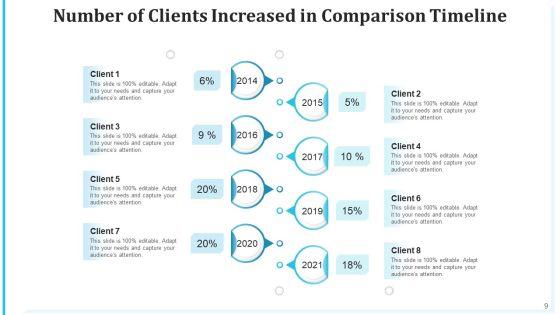
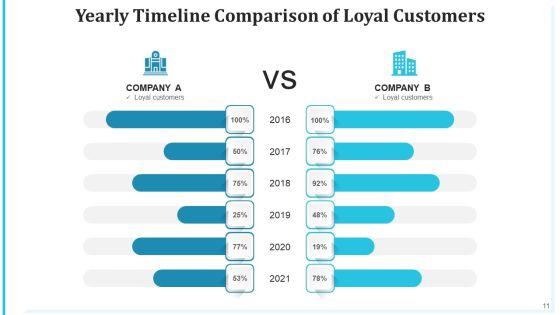
Improve your presentation delivery using this comparison schedule performer services ppt powerpoint presentation complete deck with slides. Support your business vision and objectives using this well-structured PPT deck. This template offers a great starting point for delivering beautifully designed presentations on the topic of your choice. Comprising twelve this professionally designed template is all you need to host discussion and meetings with collaborators. Each slide is self-explanatory and equipped with high-quality graphics that can be adjusted to your needs. Therefore, you will face no difficulty in portraying your desired content using this PPT slideshow. This PowerPoint slideshow contains every important element that you need for a great pitch. It is not only editable but also available for immediate download and utilization. The color, font size, background, shapes everything can be modified to create your unique presentation layout. Therefore, download it now.


Slide 1 of 7
This is a performance smartphone comparison presentation visuals. This is a seven stage process. The stages in this process are performance smartphone, higher performance, smartphone platform roadmap, highly integrated capabilities, future platforms, value smartphone, lower cost.


Slide 1 of 6
This is a two products performance comparison chart ppt powerpoint presentation outline design inspiration. The topics discussed in this diagram are product differentiation, product comparison, brand differentiation. This is a completely editable PowerPoint presentation, and is available for immediate download.


Slide 1 of 5
This is a two products performance usability and features comparison ppt powerpoint presentation infographic template portrait. This is a two stage process. The stages in this process are product differentiation, product comparison, brand differentiation.


Slide 1 of 5
This is a two products features and performance comparison chart ppt powerpoint presentation ideas layout ideas. This is a two stage process. The stages in this process are product differentiation, product comparison, brand differentiation.
Slide 1 of 5
This is a three points performance comparison of two business sectors ppt powerpoint presentation icon graphic tips. This is a three stage process. The stages in this process are compare, comparison of two, competitive analysis.
Slide 1 of 5
Four Points Performance Comparison Of Two Business Sectors Ppt PowerPoint Presentation Layouts Icons
This is a four points performance comparison of two business sectors ppt powerpoint presentation layouts icons. This is a four stage process. The stages in this process are compare, comparison of two, competitive analysis.
Slide 1 of 5
This is a pay for performance comparison table ppt powerpoint presentation icon background. This is a three stage process. The stages in this process are pay for performance comparison table, pay for performance comparison table.


Slide 1 of 5
This is a pay for performance comparison table ppt powerpoint presentation inspiration show. This is a three stage process. The stages in this process are business, compare, management, strategy, analysis, table.


Slide 1 of 5
This is a pay for performance comparison table ppt powerpoint presentation inspiration layout ideas. This is a four stage process. The stages in this process are table, management, business, marketing.


Slide 1 of 5
This is a pay for performance comparison table ppt powerpoint presentation outline design templates. This is a three stage process. The stages in this process are business, management, table, planning, strategy.


Slide 1 of 5
This is a pay for performance comparison table ppt powerpoint presentation inspiration microsoft. This is a three stage process. The stages in this process are business, management, analysis, strategy, marketing.


Slide 1 of 5
This is a pay for performance comparison table ppt powerpoint presentation styles summary. This is a three stage process. The stages in this process are business, where it would work, pay for performance concept, where it would t work, marketing.


Slide 1 of 5
This is a performance comparison ppt powerpoint presentation ideas deck. This is a two stage process. The stages in this process are ceo, marketing, accountability, problem solving, customer focus.


Slide 1 of 5
This is a performance comparison ppt powerpoint presentation samples. This is a two stage process. The stages in this process are customer focus, accountability, service excellence, problem solving, continuous improvement, collaborative conflict resolution.


Slide 1 of 5
This is a performance comparison ppt powerpoint presentation sample. This is a two stage process. The stages in this process are business, success, communication, strategy, finance.


Slide 1 of 5
This is a business performance comparison ppt powerpoint presentation examples. This is a two stage process. The stages in this process are business, performance, comparison, strategy, marketing.


Slide 1 of 5
This is a business performance comparison ppt powerpoint presentation summary. This is a two stage process. The stages in this process are business, performance, comparison, presentation, design, diagram.


Slide 1 of 5
This is a percentage column chart for performance comparison ppt powerpoint presentation good. This is a four stage process. The stages in this process are business, marketing, technology, presentation, management.


Slide 1 of 5
This is a percentage comparison for performance evaluation with circles ppt powerpoint presentation topics. This is a two nstage process. The stages in this process are percentage, comparisons, performance, business, management.


Slide 1 of 5
This is a sales performance comparison in multiple locations ppt slides. This is a two stage process. The stages in this process are business, marketing, location, finance, strategy, analysis.


Slide 1 of 5
This is a financial growth performance comparison ppt example. This is a five stage process. The stages in this process are business, strategy, marketing, finance, icons.


Slide 1 of 5
This is a performance comparison chart powerpoint show. This is a two stage process. The stages in this process are finance, compare, strategy, management, planning.


Slide 1 of 5
This is a positive and negative performance comparison ppt slide. This is a two stage process. The stages in this process are compare, business, marketing, success, process.


Slide 1 of 5
This is a comparison chart for performance analysis ppt design. This is a two stage process. The stages in this process are compare, scale, measurement, business, marketing.


Slide 1 of 5
This is a executive performance comparison chart. This is a two stage process. The stages in this process are threat of new entrants, bargaining power of buyers, industry rivalry, bargaining power of suppliers, threat of substitutes.


Slide 1 of 4
This is a employee performance comparison ppt infographics. This is a two stage process. The stages in this process are customer focus, accountability, service excellence, problem solving, continuous improvement, collaborative conflict resolution.


Slide 1 of 4
This is a workforce performance comparison chart powerpoint slides templates. This is a two stage process. The stages in this process are customer focus, accountability, service excellence, problem solving, continuous improvement, collaborative conflict resolution.


Slide 1 of 4
This is a performance comparison between employees powerpoint show. This is a two stage process. The stages in this process are customer focus, accountability, service excellence, problem solving, continuous improvement, collaborative conflict resolution.


Slide 1 of 4
This is a performance comparison across quarters ppt ideas. This is a four stage process. The stages in this process are pie, growth, percentage, finance, business, marketing.


Slide 1 of 4
This PowerPoint template has been designed with team profile tags. You may download this PPT slide to depict performance comparison. Add this slide to your presentation and impress your superiors.


Slide 1 of 4
This simple yet appealing PowerPoint slide can be best suited to represent different groups of people or team. It can be creatively used to show the increase or decrease in the number of people. This could include topics like population, customer footfall at a business place. The groups have been colored differently. This has been done to help our customers who want to show difference of opinions amongst people. This could also be used to show the diversity or ratio of people, or a comparison between teams or peoples of different departments. This slide is customizable and you can make it even better by changing colors and icons as per your convenience.


Slide 1 of 4
This PowerPoint template has been designed with circle diagram and employees photos. You may download this PPT slide to depict comparison of performance. Add this slide to your presentation and impress your superiors.


Slide 1 of 2
This slide displays sales analysis for different products and regions in each quarter. t also includes inter year comparisons. Pitch your topic with ease and precision using this Quarterly Sales Performance Of Business Dashboard With Region And Product Wise Comparison Guidelines PDF. This layout presents information on Product Wise Quarterly Sales, Comparison. It is also available for immediate download and adjustment. So, changes can be made in the color, design, graphics or any other component to create a unique layout.


Slide 1 of 2
This slide gives statistics of period-on-period sales analysis to review the current performance of organization and gradual progress. It includes data across two years with key insights. Showcasing this set of slides titled Quarterly Sales Performance Of Business Comparison With Key Insight Guidelines PDF. The topics addressed in these templates are Quarterly Sales Performance, Business Comparison, Key Insight. All the content presented in this PPT design is completely editable. Download it and make adjustments in color, background, font etc. as per your unique business setting.


Slide 1 of 2
This slide showcases shipping performance dashboard that can help to do the comparative assessment of different logistics companies. It also include KPIs such as shipments, completed deliveries, on time deliveries, on going deliveries average delivery duration etc. Pitch your topic with ease and precision using this Logistics Management Performance Comparison Dashboard With Kpis Sample PDF. This layout presents information on Shipments, Completed Deliveries, Actual Delivery Duration. It is also available for immediate download and adjustment. So, changes can be made in the color, design, graphics or any other component to create a unique layout.


Slide 1 of 2
This slide shows the sales share percentage chart by salespersons to gain an understanding of the performance of employees. It includes teams and their sales percentage. Pitch your topic with ease and precision using this Employees Sales Performance Comparison Circle Chart Topics PDF. This layout presents information on Employees Sales Performance, Comparison Circle Chart. It is also available for immediate download and adjustment. So, changes can be made in the color, design, graphics or any other component to create a unique layout.


Slide 1 of 2
This slide showcases comparative assessment of advertisement cost on different social media. It analyze social media advertising cost on the basis of key metrics that are average cost per click and cost per mile. Slidegeeks is one of the best resources for PowerPoint templates. You can download easily and regulate Performance Based Marketing Advertisement Cost Comparison Of Social Media Platforms Formats PDF for your personal presentations from our wonderful collection. A few clicks is all it takes to discover and get the most relevant and appropriate templates. Use our Templates to add a unique zing and appeal to your presentation and meetings. All the slides are easy to edit and you can use them even for advertisement purposes.


Slide 1 of 2
This slide indicates the companys past years performance in terms of revenue from operations, profit before and after taxes, net worth, and return on capital employed. Presenting you a fantastic Five Year Performance Comparison One Pager Documents. This piece is crafted on hours of research and professional design efforts to ensure you have the best resource. It is completely editable and its design allow you to rehash its elements to suit your needs. Get this Five Year Performance Comparison One Pager Documents A4 One-pager now.


Slide 1 of 2
This one page covers about quarterly revenue generations comparable with previous year and revenue analysis from various channels. Presenting you an exemplary Quarterly Sales Performance In Comparison With Revenue Analysis One Pager Documents. Our one-pager comprises all the must-have essentials of an inclusive document. You can edit it with ease, as its layout is completely editable. With such freedom, you can tweak its design and other elements to your requirements. Download this Quarterly Sales Performance In Comparison With Revenue Analysis One Pager Documents brilliant piece now.


Slide 1 of 2
Mentioned slide provides informational statistics showcasing annual business growth. It includes details about revenues, operating profit as well as net profit. From laying roadmaps to briefing everything in detail, our templates are perfect for you. You can set the stage with your presentation slides. All you have to do is download these easy-to-edit and customizable templates. Comprehensive Guide To Enhance Year Over Year Business Performance Comparison Professional PDF will help you deliver an outstanding performance that everyone would remember and praise you for. Do download this presentation today.


Slide 1 of 2
The following slide shows the comparison of the revenue share by business segments of a software company. It includes services and solutions revenue share for 2019 and 2023 along with key insights. There are so many reasons you need a Business Segments Revenue Earning Comparison Financial Performance Report Of Software Firm Topics PDF. The first reason is you can not spend time making everything from scratch, Thus, Slidegeeks has made presentation templates for you too. You can easily download these templates from our website easily.


Slide 1 of 2
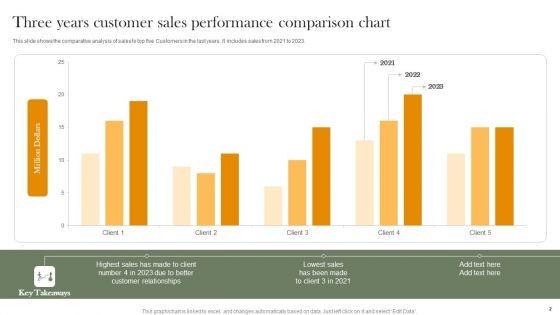
This slide shows the comparative analysis of sales to top five Customers in the last years. It includes sales from 2021 to 2023. Pitch your topic with ease and precision using this Three Years Customer Sales Performance Comparison Chart Professional PDF. This layout presents information on Highest Sales, Customer Relationships, Lowest Sales. It is also available for immediate download and adjustment. So, changes can be made in the color, design, graphics or any other component to create a unique layout.


Slide 1 of 2
This slide shows the sales graph of 3 products of a company in various states. It includes five states which are New York, Texas, California, Washington and New Jersey. Showcasing this set of slides titled State Wise Customer Sales Performance Comparison Graph Introduction PDF. The topics addressed in these templates are Lowest Sales, Decrease Demand. All the content presented in this PPT design is completely editable. Download it and make adjustments in color, background, font etc. as per your unique business setting.
Slide 1 of 2
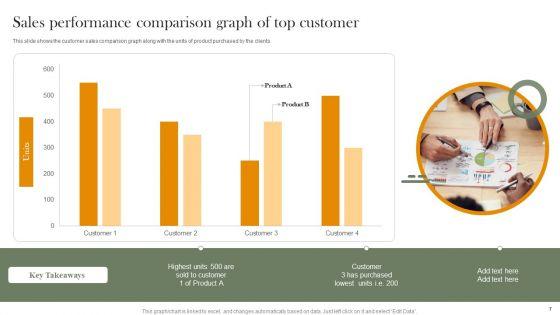
This slide shows the customer sales comparison graph along with the units of product purchased by the clients. Showcasing this set of slides titled Sales Performance Comparison Graph Of Top Customer Icons PDF. The topics addressed in these templates are Highest Units, Customer, Product. All the content presented in this PPT design is completely editable. Download it and make adjustments in color, background, font etc. as per your unique business setting.


Slide 1 of 2
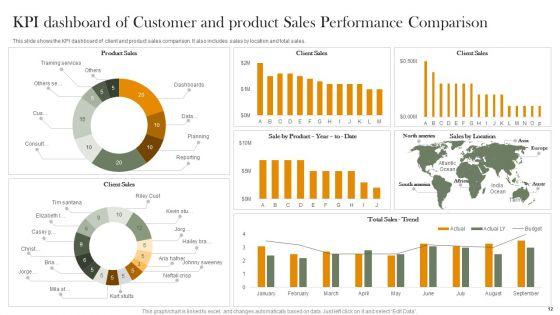
This slide shows the KPI dashboard of client and product sales comparison. It also includes sales by location and total sales. Pitch your topic with ease and precision using this KPI Dashboard Of Customer And Product Sales Performance Comparison Information PDF. This layout presents information on Product Sales, Client Sales, Tim Santana. It is also available for immediate download and adjustment. So, changes can be made in the color, design, graphics or any other component to create a unique layout.


Slide 1 of 2
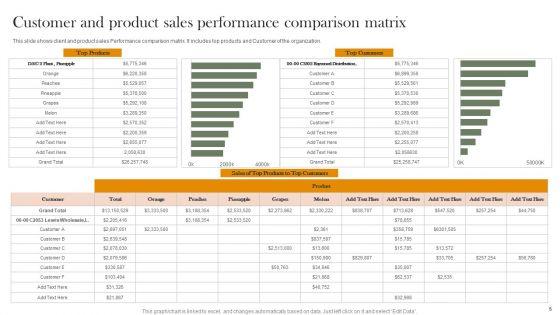
This slide shows client and product sales Performance comparison matrix. It includes top products and Customer of the organization. Showcasing this set of slides titled Customer And Product Sales Performance Comparison Matrix Introduction PDF. The topics addressed in these templates are Top Products, Top Customers, Sales. All the content presented in this PPT design is completely editable. Download it and make adjustments in color, background, font etc. as per your unique business setting.


Slide 1 of 2
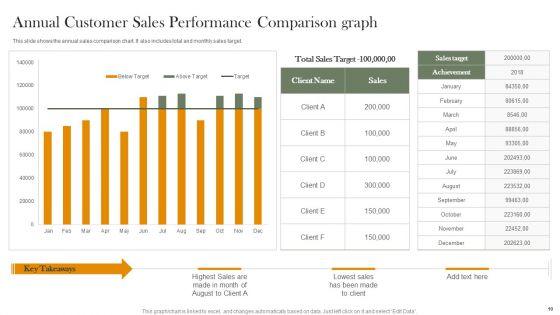
This slide shows the annual sales comparison chart. It also includes total and monthly sales target. Pitch your topic with ease and precision using this Annual Customer Sales Performance Comparison Graph Portrait PDF. This layout presents information on Total Sales Target, Sales Target, Achievement. It is also available for immediate download and adjustment. So, changes can be made in the color, design, graphics or any other component to create a unique layout.


Slide 1 of 2
Mentioned slide provides informational statistics showcasing annual business growth. It includes details about revenues, operating profit as well as net profit. Are you in need of a template that can accommodate all of your creative concepts This one is crafted professionally and can be altered to fit any style. Use it with Google Slides or PowerPoint. Include striking photographs, symbols, depictions, and other visuals. Fill, move around, or remove text boxes as desired. Test out color palettes and font mixtures. Edit and save your work, or work with colleagues. Download Year Over Year Business Performance Comparison Strategic Promotion Plan Pictures PDF and observe how to make your presentation outstanding. Give an impeccable presentation to your group and make your presentation unforgettable.


Slide 1 of 2
Comparison Of Retail Store Self Checkout System Retail Outlet Performance Assessment Inspiration PDF
This slide provides information regarding the comparison of multiple self checkout systems based on space required, advantages, and disadvantages. It highlights the details of major suppliers.Deliver an awe inspiring pitch with this creative Comparison Of Retail Store Self Checkout System Retail Outlet Performance Assessment Inspiration PDF bundle. Topics like Extremely Low, Space Required, Frequent Overrides can be discussed with this completely editable template. It is available for immediate download depending on the needs and requirements of the user.


Slide 1 of 2
This slide shows comparison between revenue, gross margin and profit earned by an organization in four quarters. Covid19 pandemic is the major reason behind companys poor financial performance. Showcasing this set of slides titled Company Financials Performance Comparison Of Company Microsoft PDF. The topics addressed in these templates are Been Continuously, Because Covid, Profit Firm. All the content presented in this PPT design is completely editable. Download it and make adjustments in color, background, font etc. as per your unique business setting.


Slide 1 of 2
This slide shows the comparison of revenue generated by an organization on company basis in two financial years. Pitch your topic with ease and precision using this Company Financials Performance Comparison Of Company Financials Formats PDF. This layout presents information on Manufacturing Cost, Introduction Customer, Loyalty Programs. It is also available for immediate download and adjustment. So, changes can be made in the color, design, graphics or any other component to create a unique layout.


Slide 1 of 2
This slide shows the company revenue generation comparison of companys product across global market. USA region is the major revenue generation contributor. Showcasing this set of slides titled Company Comparison Of Product Financial Performance Summary PDF. The topics addressed in these templates are Revenue Generated, Region Increased, Substantially. All the content presented in this PPT design is completely editable. Download it and make adjustments in color, background, font etc. as per your unique business setting.


Slide 1 of 2
This slide highlights the financial performance comparison of companies from the years since company was founded which includes Microsoft, oracle, sap and salesforce revenue. Deliver an awe inspiring pitch with this creative Financial Performance Comparison Salesforce Business Profile Demonstration PDF bundle. Topics like Target, Salesforce, Organization can be discussed with this completely editable template. It is available for immediate download depending on the needs and requirements of the user.


Slide 1 of 2
This slide highlights the financial performance analysis of multiple call centers on the basis of operating margin, and revenue growth. It includes Sykes, TeleTech, Convergys and ABC Pvt ltd. Deliver and pitch your topic in the best possible manner with this Customer Support Services Company Profile Financial Performance Comparison Infographics PDF. Use them to share invaluable insights on Revenue Growth, Operating Margin and impress your audience. This template can be altered and modified as per your expectations. So, grab it now.

Slide 1 of 2
This slide shows the quarterly performance of employees in different departments. . It includes marketing, Research and development and IT department. Showcasing this set of slides titled Department Wise Comparison Of Workforce Performance Ppt Summary Portfolio PDF. The topics addressed in these templates are Key Insights, Marketing Department, R And D Department. All the content presented in this PPT design is completely editable. Download it and make adjustments in color, background, font etc. as per your unique business setting.


Slide 1 of 2
This slide illustrates companys sales report bar graph. It includes comparison of annuals sales performance with different competitors products along with key insights. Showcasing this set of slides titled Product Wise Quarterly Sales Comparison Performance Chart Report Infographics PDF. The topics addressed in these templates are Product C Sales, Technology Upgrade, Financial Crisis. All the content presented in this PPT design is completely editable. Download it and make adjustments in color, background, font etc. as per your unique business setting.


Slide 1 of 2
Showcasing this set of slides titled Product Performance Comparison Graph Showing Revenue Growth Portrait PDF. The topics addressed in these templates are Sales Revenue, Product. All the content presented in this PPT design is completely editable. Download it and make adjustments in color, background, font etc. as per your unique business setting.
SHOW
- 60
- 120
- 180
DISPLAYING: 60 of 157 Item(s)
Page
