- Sign up
- Sign In
 AI PPT Maker
 Templates
 PPT Bundles
 Design Services
 Business PPTs
 Business Plan
 Management
 Strategy
 Introduction PPT
 Roadmap
 Self Introduction
 Timelines
 Process
 Marketing
 Agenda
 Technology
 Medical
 Startup Business Plan
 Cyber Security
 Dashboards
 SWOT
SWOT Proposals
 Education
 Pitch Deck
 Digital Marketing
 KPIs
KPIs Project Management
 Product Management
 Artificial Intelligence
 Target Market
 Communication
 Supply Chain
 Google Slides
 Research Services
 One Pagers
 All Categories
Over year revenue PowerPoint Presentation Templates and Google Slides
33 Item(s)


Following slide illustrates statistics of revenue generation. It depicts that company achieved its highest revenue generation mark in H2 2023. Retrieve professionally designed Submission Of Project Viability Report For Bank Loan Year Over Year Revenue Generation Highlights Diagrams PDF to effectively convey your message and captivate your listeners. Save time by selecting pre-made slideshows that are appropriate for various topics, from business to educational purposes. These themes come in many different styles, from creative to corporate, and all of them are easily adjustable and can be edited quickly. Access them as PowerPoint templates or as Google Slides themes. You do not have to go on a hunt for the perfect presentation because Slidegeeks got you covered from everywhere.


The purpose of the following slide is to analyze the financial performance of the organization. The provided graph highlight the revenues, Gross profit and net profit margin of the organization for the year 2016,17,18 and 19. Create an editable Periodic Revenue Model Our Financial Performance Over The Year Themes PDF that communicates your idea and engages your audience. Whether youre presenting a business or an educational presentation, pre designed presentation templates help save time. Periodic Revenue Model Our Financial Performance Over The Year Themes PDF is highly customizable and very easy to edit, covering many different styles from creative to business presentations. Slidegeeks has creative team members who have crafted amazing templates. So, go and get them without any delay.


The purpose of this slide is to outline the comparison of revenue growth rates of cloud based companies year over year. It includes three companies along with growth line and average of total revenue generated. Showcasing this set of slides titled Year Over Year Comparison Of Cloud Revenue Growth Sample PDF. The topics addressed in these templates are Yoy Growth Rates, Generated, Growth Reported. All the content presented in this PPT design is completely editable. Download it and make adjustments in color, background, font etc. as per your unique business setting.


This slide covers graphical representation of forecasted revenue growth. It also includes key insights such as the upward trend of annual growth rate and the annual growth rate for upcoming years. Presenting this PowerPoint presentation, titled HRMS Execution Plan Current Scenario Year Over Year Revenue Growth Projections Inspiration PDF, with topics curated by our researchers after extensive research. This editable presentation is available for immediate download and provides attractive features when used. Download now and captivate your audience. Presenting this HRMS Execution Plan Current Scenario Year Over Year Revenue Growth Projections Inspiration PDF. Our researchers have carefully researched and created these slides with all aspects taken into consideration. This is a completely customizable HRMS Execution Plan Current Scenario Year Over Year Revenue Growth Projections Inspiration PDF that is available for immediate downloading. Download now and make an impact on your audience. Highlight the attractive features available with our PPTs.


The following slide outlines the total market revenue and growth of food and beverage industry. The revenue of the food industry is covered from 2015-2023. Slidegeeks is one of the best resources for PowerPoint templates. You can download easily and regulate Overview Of The Food Global Food Industry Revenue Generation Year Over Year Growth Designs PDF for your personal presentations from our wonderful collection. A few clicks is all it takes to discover and get the most relevant and appropriate templates. Use our Templates to add a unique zing and appeal to your presentation and meetings. All the slides are easy to edit and you can use them even for advertisement purposes.


Following slide illustrates statistics of revenue generation. It depicts that company achieved its highest revenue generation mark in H2 2020. Are you searching for a Financial Evaluation Report Year Over Year Revenue Generation Highlights Designs PDF that is uncluttered, straightforward, and original Its easy to edit, and you can change the colors to suit your personal or business branding. For a presentation that expresses how much effort youve put in, this template is ideal With all of its features, including tables, diagrams, statistics, and lists, its perfect for a business plan presentation. Make your ideas more appealing with these professional slides. Download Financial Evaluation Report Year Over Year Revenue Generation Highlights Designs PDF from Slidegeeks today.


Following slide illustrates statistics of revenue generation. It depicts that company achieved its highest revenue generation mark in H2 2023. Crafting an eye catching presentation has never been more straightforward. Let your presentation shine with this tasteful yet straightforward Credibility Assessment Summary For Construction Project Year Over Year Revenue Generation Highlights Template PDF template. It offers a minimalistic and classy look that is great for making a statement. The colors have been employed intelligently to add a bit of playfulness while still remaining professional. Construct the ideal Credibility Assessment Summary For Construction Project Year Over Year Revenue Generation Highlights Template PDF that effortlessly grabs the attention of your audience Begin now and be certain to wow your customers.


The following slide outlines the total market revenue and growth of food and beverage industry. The revenue of the food industry is covered from 2016-2023. From laying roadmaps to briefing everything in detail, our templates are perfect for you. You can set the stage with your presentation slides. All you have to do is download these easy-to-edit and customizable templates. Introducing New Food Commodity Global Food Industry Revenue Generation Year Over Download PDF will help you deliver an outstanding performance that everyone would remember and praise you for. Do download this presentation today.


The purpose of the following slide is to analyze the financial performance of the organization. The provided graph highlight the revenues, Gross profit and net profit margin of the organization for the year 2020,21,22 and 23. Are you in need of a template that can accommodate all of your creative concepts This one is crafted professionally and can be altered to fit any style. Use it with Google Slides or PowerPoint. Include striking photographs, symbols, depictions, and other visuals. Fill, move around, or remove text boxes as desired. Test out color palettes and font mixtures. Edit and save your work, or work with colleagues. Download Membership Based Revenue Plan Our Financial Performance Over The Year Mockup PDF and observe how to make your presentation outstanding. Give an impeccable presentation to your group and make your presentation unforgettable.


The following slide outlines the total market revenue and growth of food and beverage industry. The revenue of the food industry is covered from 2016-2023. Boost your pitch with our creative Effective Online And Offline Promotional Global Food Industry Revenue Generation Year Over Inspiration PDF. Deliver an awe-inspiring pitch that will mesmerize everyone. Using these presentation templates you will surely catch everyones attention. You can browse the ppts collection on our website. We have researchers who are experts at creating the right content for the templates. So you dont have to invest time in any additional work. Just grab the template now and use them.
Year Over Year Revenue Generation Highlights Construct Project Feasibility Analysis Report Icons PDF
Following slide illustrates statistics of revenue generation. It depicts that company achieved its highest revenue generation mark in H2 2023. Slidegeeks has constructed Year Over Year Revenue Generation Highlights Construct Project Feasibility Analysis Report Icons PDF after conducting extensive research and examination. These presentation templates are constantly being generated and modified based on user preferences and critiques from editors. Here, you will find the most attractive templates for a range of purposes while taking into account ratings and remarks from users regarding the content. This is an excellent jumping off point to explore our content and will give new users an insight into our top notch PowerPoint Templates.


Following slide illustrates statistics of revenue generation. It depicts that company achieved its highest revenue generation mark in H2 2023. Presenting this PowerPoint presentation, titled Feasibility Analysis Report For Construction Project Year Over Year Revenue Generation Highlights Portrait PDF, with topics curated by our researchers after extensive research. This editable presentation is available for immediate download and provides attractive features when used. Download now and captivate your audience. Presenting this Feasibility Analysis Report For Construction Project Year Over Year Revenue Generation Highlights Portrait PDF. Our researchers have carefully researched and created these slides with all aspects taken into consideration. This is a completely customizable Feasibility Analysis Report For Construction Project Year Over Year Revenue Generation Highlights Portrait PDF that is available for immediate downloading. Download now and make an impact on your audience. Highlight the attractive features available with our PPTs.


Following slide illustrates statistics of revenue generation. It depicts that company achieved its highest revenue generation mark in H2 2020. This Year Over Year Revenue Generation Highlights Inspiration PDF from Slidegeeks makes it easy to present information on your topic with precision. It provides customization options, so you can make changes to the colors, design, graphics, or any other component to create a unique layout. It is also available for immediate download, so you can begin using it right away. Slidegeeks has done good research to ensure that you have everything you need to make your presentation stand out. Make a name out there for a brilliant performance.


Following slide illustrates statistics of revenue generation. It depicts that company achieved its highest revenue generation mark in H2 2020. Here you can discover an assortment of the finest PowerPoint and Google Slides templates. With these templates, you can create presentations for a variety of purposes while simultaneously providing your audience with an eye catching visual experience. Download Construction Project Cost Benefit Analysis Report Year Over Year Revenue Generation Highlights Infographics PDF to deliver an impeccable presentation. These templates will make your job of preparing presentations much quicker, yet still, maintain a high level of quality. Slidegeeks has experienced researchers who prepare these templates and write high quality content for you. Later on, you can personalize the content by editing the Construction Project Cost Benefit Analysis Report Year Over Year Revenue Generation Highlights Infographics PDF.


The following slide outlines the total market revenue and growth of food beverage industry. The revenue of the food industry is covered from 2015-2022. Slidegeeks has constructed Global Food Industry Revenue Generation Year Over Year Growth Launching New Beverage Product Themes PDF after conducting extensive research and examination. These presentation templates are constantly being generated and modified based on user preferences and critiques from editors. Here, you will find the most attractive templates for a range of purposes while taking into account ratings and remarks from users regarding the content. This is an excellent jumping-off point to explore our content and will give new users an insight into our top-notch PowerPoint Templates.


This slide covers revenue generation statistics of the firm over past three years. It also depicts that revenue recorded in FY21 was dollar2070 as compared to dollar4720 in FY19.Deliver an awe inspiring pitch with this creative Current Situation Decrease In Year Over Year Revenue Generation Diagrams PDF bundle. Topics like Revenue Generated, Gets Decreased, Key Takeaways can be discussed with this completely editable template. It is available for immediate download depending on the needs and requirements of the user.


This slide covers revenue generation statistics of the firm over past three years. It also depicts that revenue recorded in FY21 was dolar2070 as compared to dollar 4720 in FY19.Deliver an awe inspiring pitch with this creative Current Situation Decrease In Year Over Year Revenue Generation Professional PDF bundle. Topics like Compared To Previous, Revenue Generated, Decreased can be discussed with this completely editable template. It is available for immediate download depending on the needs and requirements of the user.
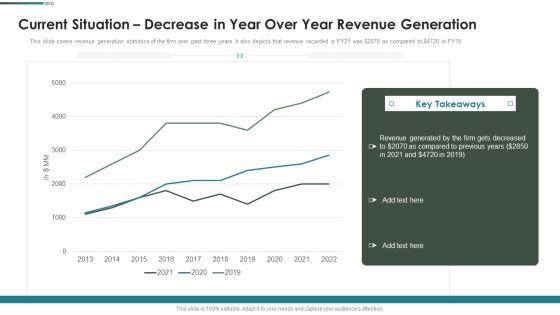
This slide covers revenue generation statistics of the firm over past three years. It also depicts that revenue recorded in FY21 was dollar2070 as compared to dollar 4720 in FY19.Deliver and pitch your topic in the best possible manner with this Purchase Assessment Process Current Situation Decrease In Year Over Year Revenue Generation Introduction PDF Use them to share invaluable insights on Key Takeaways, Revenue Generated, Compared To Previous and impress your audience. This template can be altered and modified as per your expectations. So, grab it now.
Following slide portrays year over year revenue generation statistics of the firm. Revenue recorded in FY20 was dollar 2050 as compared to dollar 4870 in FY18. Deliver and pitch your topic in the best possible manner with this Maintaining Partner Relationships Revenue Generation Stats Over Past Three Years Icons PDF. Use them to share invaluable insights on Revenue Generated, 2011 To 2020 and impress your audience. This template can be altered and modified as per your expectations. So, grab it now.


Following slide portrays year over year revenue generation statistics of the firm. Revenue recorded in FY20 was dollar2050 as compared to dollar4870 in FY18.Deliver and pitch your topic in the best possible manner with this strong business partnership to ensure company success revenue generation stats over past three years elements pdf Use them to share invaluable insights on performance based partner classification and impress your audience. This template can be altered and modified as per your expectations. So, grab it now.


This slide shows the startup business growth over 24 months with funding and valuation details for five years. Deliver an awe inspiring pitch with this creative valuing a pre revenue startup business startup business growth over two years with total valuation details summary pdf bundle. Topics like startup business growth over two years with total valuation details can be discussed with this completely editable template. It is available for immediate download depending on the needs and requirements of the user.


Following slide portrays year over year revenue generation statistics of the firm. Revenue recorded in FY20 was dollar2050 as compared to dollar4870 in FY18.Deliver and pitch your topic in the best possible manner with this partnership management strategies revenue generation stats over past three years template pdf Use them to share invaluable insights on revenue generation stats over past three years and impress your audience. This template can be altered and modified as per your expectations. So, grab it now.


Following slide displays revenue generation statistics of the firm over past three years. Revenue recorded in FY19 was dollar 2070 as compared to dollar 4720 in FY20 Deliver an awe inspiring pitch with this creative instigating efficient value process year over year revenue generation stats guidelines pdf bundle. Topics like year over year revenue generation stats can be discussed with this completely editable template. It is available for immediate download depending on the needs and requirements of the user.


Deliver an awe-inspiring pitch with this creative benchmarking supplier operation control procedure year over year revenue generation stats template pdf bundle. Topics like year over year revenue generation stats can be discussed with this completely editable template. It is available for immediate download depending on the needs and requirements of the user.


Following slide displays companys informational stats about revenue generated over the last two years. Here the graph indicates that revenue generation in FY22 is less as compared to stats of FY21. Deliver an awe inspiring pitch with this creative qc engineering revenue generation stats over last two years ppt portfolio graphics tutorials pdf bundle. Topics like revenue generation stats over last two years can be discussed with this completely editable template. It is available for immediate download depending on the needs and requirements of the user.


Following slide displays revenue generation statistics of the firm over past three years. Revenue recorded in FY20 was 2070 as compared to 4720 in FY21. Deliver an awe-inspiring pitch with this creative benchmarking vendor operation control procedure inventory turnover tracking dashboard pictures pdf. bundle. Topics like year over year revenue generation stats can be discussed with this completely editable template. It is available for immediate download depending on the needs and requirements of the user.


Deliver and pitch your topic in the best possible manner with this inculcating supplier operation improvement plan year over year revenue generation stats summary pdf. Use them to share invaluable insights on year over year revenue generation stats and impress your audience. This template can be altered and modified as per your expectations. So, grab it now.


The sales department compares the sales figures of two years. This comparison will help firm in analyzing how well the department is performing between two years. Deliver an awe-inspiring pitch with this creative sales department strategies increase revenues sales comparison year over year infographics pdf bundle. Topics like sales comparison year over year can be discussed with this completely editable template. It is available for immediate download depending on the needs and requirements of the user.


The given slide depicts the year over year comparison of quarterly revenue growth between two years, especially with the sources of revenue in order to track the profitability and incurring losses in the business. Showcasing this set of slides titled Year Over Year Revenue Growth Comparison Diagrams PDF. The topics addressed in these templates are Year Over Year, Revenue Growth, Comparison. All the content presented in this PPT design is completely editable. Download it and make adjustments in color, background, font etc. as per your unique business setting.


Presenting Multinational Firms Year Over Year Revenue Comparison Slides PDF to dispense important information. This template comprises three stages. It also presents valuable insights into the topics including Multinational Firms, Year Over Year, Revenue Comparison. This is a completely customizable PowerPoint theme that can be put to use immediately. So, download it and address the topic impactfully.
33 Item(s)