 AI PPT Maker
 Templates
 PPT Bundles
 Design Services
 Business PPTs
 Business Plan
 Management
 Strategy
 Introduction PPT
 Roadmap
 Self Introduction
 Timelines
 Process
 Marketing
 Agenda
 Technology
 Medical
 Startup Business Plan
 Cyber Security
 Dashboards
 SWOT
SWOT Proposals
 Education
 Pitch Deck
 Digital Marketing
 KPIs
KPIs Project Management
 Product Management
 Artificial Intelligence
 Target Market
 Communication
 Supply Chain
 Google Slides
 Research Services
 One Pagers
 All Categories
Our Financial Performance PowerPoint Presentation Templates and Google Slides
7 Item(s)


The purpose of the following slide is to analyze the financial performance of the organization. The provided graph highlight the revenues, Gross profit and net profit margin of the organization for the year 2016,17,18 and 19. Welcome to our selection of the Recurring Income Generation Model Our Financial Performance Over The Year Clipart PDF. These are designed to help you showcase your creativity and bring your sphere to life. Planning and Innovation are essential for any business that is just starting out. This collection contains the designs that you need for your everyday presentations. All of our PowerPoints are 100 percent editable, so you can customize them to suit your needs. This multi purpose template can be used in various situations. Grab these presentation templates today.
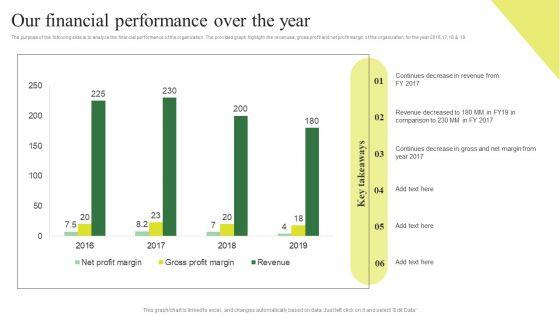
The purpose of the following slide is to analyze the financial performance of the organization. The provided graph highlight the revenues, gross profit and net profit margin of the organization for the year 2016,17,18 and 19. This Consumption Based Pricing Model Key Metrices For Forecasting In Recurring Revenue Model Clipart PDF is perfect for any presentation, be it in front of clients or colleagues. It is a versatile and stylish solution for organizing your meetings. The Consumption Based Pricing Model Key Metrices For Forecasting In Recurring Revenue Model Clipart PDF features a modern design for your presentation meetings. The adjustable and customizable slides provide unlimited possibilities for acing up your presentation. Slidegeeks has done all the homework before launching the product for you. So, do not wait, grab the presentation templates today


The purpose of the following slide is to analyze the financial performance of the organization. The provided graph highlight the revenues, Gross profit and net profit margin of the organization for the year 2016,17,18 and 19. Create an editable Periodic Revenue Model Our Financial Performance Over The Year Themes PDF that communicates your idea and engages your audience. Whether youre presenting a business or an educational presentation, pre designed presentation templates help save time. Periodic Revenue Model Our Financial Performance Over The Year Themes PDF is highly customizable and very easy to edit, covering many different styles from creative to business presentations. Slidegeeks has creative team members who have crafted amazing templates. So, go and get them without any delay.


The purpose of the following slide is to analyze the financial performance of the organization. The provided graph highlight the revenues, Gross profit and net profit margin of the organization for the year 2020,21,22 and 23. Are you in need of a template that can accommodate all of your creative concepts This one is crafted professionally and can be altered to fit any style. Use it with Google Slides or PowerPoint. Include striking photographs, symbols, depictions, and other visuals. Fill, move around, or remove text boxes as desired. Test out color palettes and font mixtures. Edit and save your work, or work with colleagues. Download Membership Based Revenue Plan Our Financial Performance Over The Year Mockup PDF and observe how to make your presentation outstanding. Give an impeccable presentation to your group and make your presentation unforgettable.


The purpose of the following slide is to analyze the financial performance of the organization. The provided graph highlight the revenues, Gross profit and net profit margin of the organization for the year 2016,17,18 and 19. If you are looking for a format to display your unique thoughts, then the professionally designed Deploying And Managing Recurring Our Financial Performance Over The Year Infographics PDF is the one for you. You can use it as a Google Slides template or a PowerPoint template. Incorporate impressive visuals, symbols, images, and other charts. Modify or reorganize the text boxes as you desire. Experiment with shade schemes and font pairings. Alter, share or cooperate with other people on your work. Download Deploying And Managing Recurring Our Financial Performance Over The Year Infographics PDF and find out how to give a successful presentation. Present a perfect display to your team and make your presentation unforgettable.


The purpose of the following slide is to analyze the financial performance of the organization. The provided graph highlight the revenues, Gross profit and net profit margin of the organization for the year 2020,21,22 and 23. Welcome to our selection of the Saas Continuous Income Generation Model For Software Startup Our Financial Performance Over The Year Download PDF. These are designed to help you showcase your creativity and bring your sphere to life. Planning and Innovation are essential for any business that is just starting out. This collection contains the designs that you need for your everyday presentations. All of our PowerPoints are 100 percent editable, so you can customize them to suit your needs. This multi purpose template can be used in various situations. Grab these presentation templates today.
7 Item(s)