 AI PPT Maker
 Templates
 PPT Bundles
 Design Services
 Business PPTs
 Business Plan
 Management
 Strategy
 Introduction PPT
 Roadmap
 Self Introduction
 Timelines
 Process
 Marketing
 Agenda
 Technology
 Medical
 Startup Business Plan
 Cyber Security
 Dashboards
 SWOT
SWOT Proposals
 Education
 Pitch Deck
 Digital Marketing
 KPIs
KPIs Project Management
 Product Management
 Artificial Intelligence
 Target Market
 Communication
 Supply Chain
 Google Slides
 Research Services
 One Pagers
 All Categories
Operations metrics PowerPoint Presentation Templates and Google Slides
SHOW
- 60
- 120
- 180
DISPLAYING: 60 of 146 Item(s)
Page


This complete deck acts as a great communication tool. It helps you in conveying your business message with personalized sets of graphics, icons etc. Comprising a set of sixty eight slides, this complete deck can help you persuade your audience. It also induces strategic thinking as it has been thoroughly researched and put together by our experts. Not only is it easily downloadable but also editable. The color, graphics, theme any component can be altered to fit your individual needs. So grab it now.


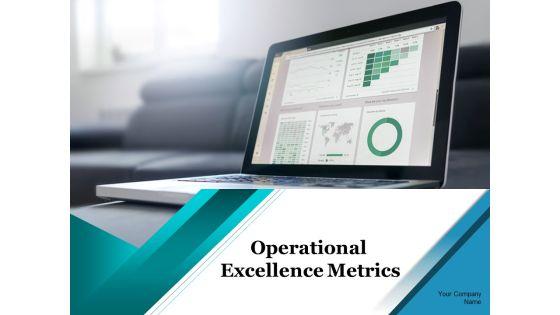
If designing a presentation takes a lot of your time and resources and you are looking for a better alternative, then this Operations Metrics Ppt PowerPoint Presentation Complete Deck With Slides is the right fit for you. This is a prefabricated set that can help you deliver a great presentation on the topic. All the Sixteen slides included in this sample template can be used to present a birds-eye view of the topic. These slides are also fully editable, giving you enough freedom to add specific details to make this layout more suited to your business setting. Apart from the content, all other elements like color, design, theme are also replaceable and editable. This helps in designing a variety of presentations with a single layout. Not only this, you can use this PPT design in formats like PDF, PNG, and JPG once downloaded. Therefore, without any further ado, download and utilize this sample presentation as per your liking.


Presenting this set of slides with name operational availability metrics sales outstanding and average order value ppt powerpoint presentation ideas tips. The topics discussed in these slides are availability kpi, availability dashboard, availability metrics. This is a completely editable PowerPoint presentation and is available for immediate download. Download now and impress your audience.


This slide illustrates challenges associated with implementation of data governance operating model. It includes functional areas such as data insights, data quality, data ownership, etc. Showcasing this set of slides titled Performance Metrics For Data Governance Operating Framework Summary PDF. The topics addressed in these templates are Attributes By Glossary, Rules Measured, Rules Against Target. All the content presented in this PPT design is completely editable. Download it and make adjustments in color, background, font etc. as per your unique business setting.


This slide showcases monthly analytics for to keep company finances organized and identify problem areas. It further includes details about marketing, professional fees, COGS and other operations. Pitch your topic with ease and precision using this Monthly Financial Metrics Graph With Operating Profit And Cost Of Goods Sold Pictures PDF. This layout presents information on Key Insights, Operating Profit, Total Revenue. It is also available for immediate download and adjustment. So, changes can be made in the color, design, graphics or any other component to create a unique layout.


Presenting you an exemplary Understanding Companys Operational Metrics One Pager Documents. Our one-pager comprises all the must-have essentials of an inclusive document. You can edit it with ease, as its layout is completely editable. With such freedom, you can tweak its design and other elements to your requirements. Download this Understanding Companys Operational Metrics One Pager Documents brilliant piece now.
This slide represents dashboard representing the key metrics of operational risk management. It includes KPIs such as operational risk by rating, by month, operational risk list etc. The Operational Risk Assessment And Management Plan Operational Risk Management Key Metrics Dashboard Icons PDF is a compilation of the most recent design trends as a series of slides. It is suitable for any subject or industry presentation, containing attractive visuals and photo spots for businesses to clearly express their messages. This template contains a variety of slides for the user to input data, such as structures to contrast two elements, bullet points, and slides for written information. Slidegeeks is prepared to create an impression.


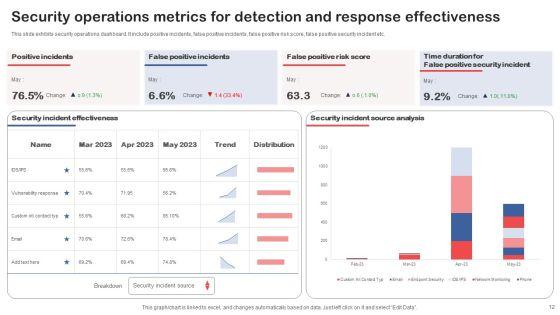
Showcasing this set of slides titled Security Operations Metrics For Detection And Response Effectiveness Structure PDF. The topics addressed in these templates are Operations Metrics, Detection, Response Effectiveness. All the content presented in this PPT design is completely editable. Download it and make adjustments in color, background, font etc. as per your unique business setting.
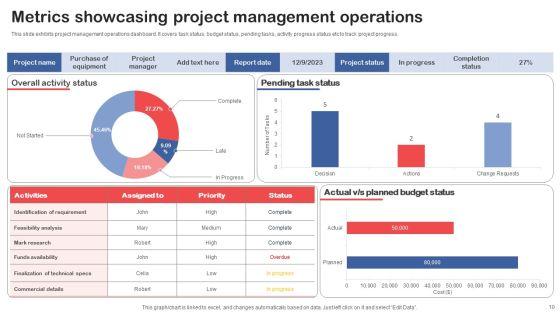
This slide exhibits project management operations dashboard. It covers task status, budget status, pending tasks, activity progress status etc to track project progress. Showcasing this set of slides titled Metrics Showcasing Project Management Operations Icons PDF. The topics addressed in these templates are Metrics Showcasing, Project Management Operations. All the content presented in this PPT design is completely editable. Download it and make adjustments in color, background, font etc. as per your unique business setting.


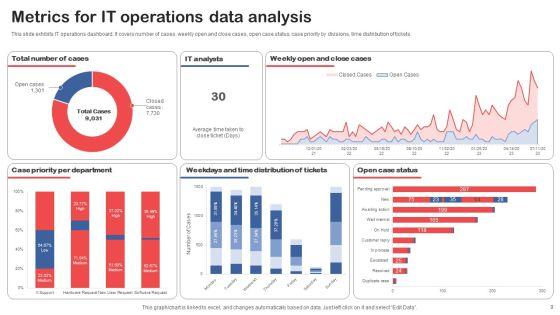
This slide exhibits IT operations dashboard. It covers number of cases, weekly open and close cases, open case status, case priority by divisions, time distribution of tickets. Pitch your topic with ease and precision using this Metrics For IT Operations Data Analysis Topics PDF. This layout presents information on Case Priority Per Department, Distribution Of Tickets, Open Case Status. It is also available for immediate download and adjustment. So, changes can be made in the color, design, graphics or any other component to create a unique layout.


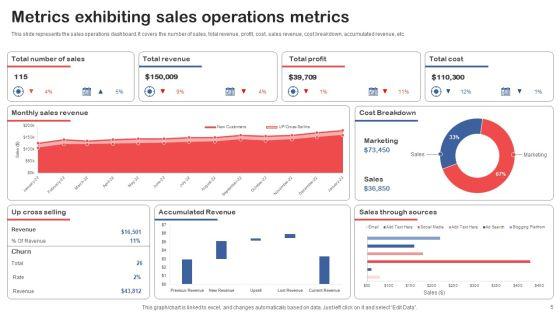
This slide represents the sales operations dashboard. It covers the number of sales, total revenue, profit, cost, sales revenue, cost breakdown, accumulated revenue, etc. Showcasing this set of slides titled Metrics Exhibiting Sales Operations Metrics Topics PDF. The topics addressed in these templates are Total Revenue, Total Profit, Total Cost. All the content presented in this PPT design is completely editable. Download it and make adjustments in color, background, font etc. as per your unique business setting.


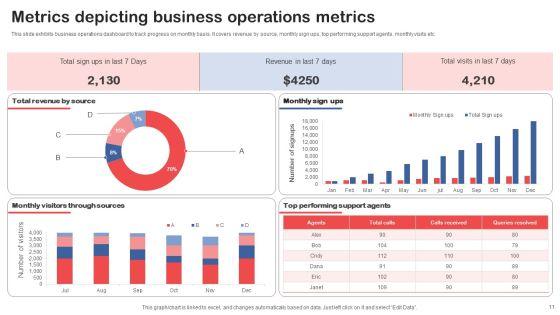
Pitch your topic with ease and precision using this Metrics Depicting Business Operations Metrics Diagrams PDF. This layout presents information on Metrics Depicting, Business, Operations Metrics. It is also available for immediate download and adjustment. So, changes can be made in the color, design, graphics or any other component to create a unique layout.

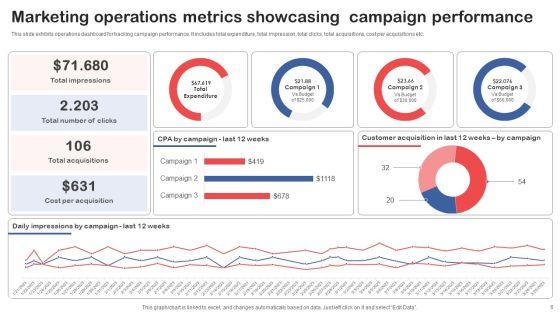
Showcasing this set of slides titled Marketing Operations Metrics Showcasing Campaign Performance Clipart PDF. The topics addressed in these templates are Marketing Operations Metrics, Showcasing Campaign Performance. All the content presented in this PPT design is completely editable. Download it and make adjustments in color, background, font etc. as per your unique business setting.


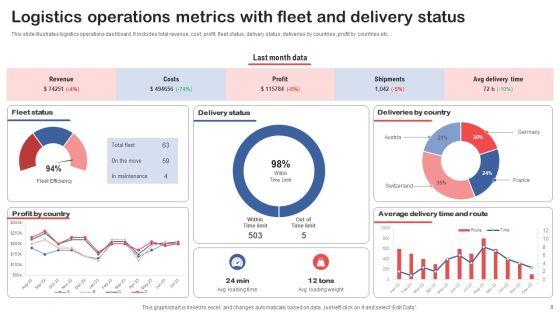
This slide illustrates logistics operations dashboard. It includes total revenue, cost, profit, fleet status, delivery status, deliveries by countries, profit by countries etc. Pitch your topic with ease and precision using this Logistics Operations Metrics With Fleet And Delivery Status Slides PDF. This layout presents information on Fleet Status, Delivery Status, Deliveries By Country. It is also available for immediate download and adjustment. So, changes can be made in the color, design, graphics or any other component to create a unique layout.


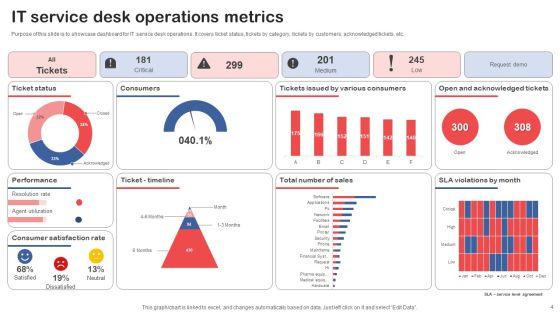
Showcasing this set of slides titled IT Service Desk Operations Metrics Summary PDF. The topics addressed in these templates are IT Service, Desk Operations Metrics. All the content presented in this PPT design is completely editable. Download it and make adjustments in color, background, font etc. as per your unique business setting.


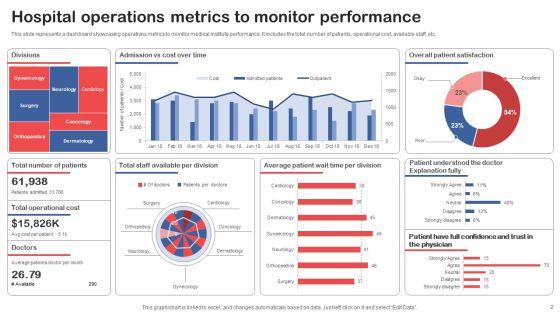
This slide represents a dashboard showcasing operations metrics to monitor medical institute performance. It includes the total number of patients, operational cost, available staff, etc. Showcasing this set of slides titled Hospital Operations Metrics To Monitor Performance Structure PDF. The topics addressed in these templates are Divisions, Overall Patient Satisfaction, Total Operational Cost. All the content presented in this PPT design is completely editable. Download it and make adjustments in color, background, font etc. as per your unique business setting.


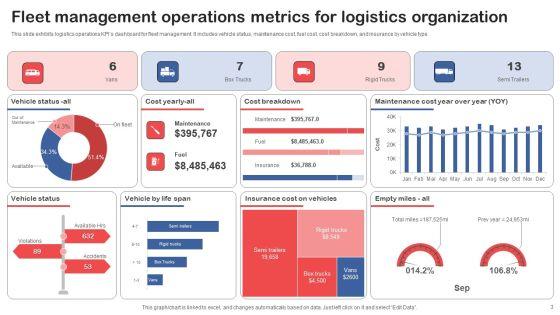
This slide exhibits logistics operations KPIs dashboard for fleet management. It includes vehicle status, maintenance cost, fuel cost, cost breakdown, and insurance by vehicle type. Pitch your topic with ease and precision using this Fleet Management Operations Metrics For Logistics Organization Graphics PDF. This layout presents information on Cost Breakdown, Vehicle Status, Vehicle By Life Span. It is also available for immediate download and adjustment. So, changes can be made in the color, design, graphics or any other component to create a unique layout.


Pitch your topic with ease and precision using this Data Quality Kpis Assessment Metrics For Operational Records Sample PDF. This layout presents information on Data Quality, Assessment Metrics, Operational Records. It is also available for immediate download and adjustment. So, changes can be made in the color, design, graphics or any other component to create a unique layout.


The slide includes a dashboard of hotel property management system that provides information about check in guests , reservations, housekeeping and other KPIs at a glance. Pitch your topic with ease and precision using this Hotel Operations Management Software Key Metrics Dashboard Inspiration PDF. This layout presents information on Reservations, Housekeeping, Occupancy. It is also available for immediate download and adjustment. So, changes can be made in the color, design, graphics or any other component to create a unique layout.


This slide represents dashboard representing the key metrics of operational risk management. It includes KPIs such as operational risk by rating, by month, operational risk list etc. Boost your pitch with our creative Enterprise Risk Management Operational Risk Management Key Metrics Inspiration PDF. Deliver an awe-inspiring pitch that will mesmerize everyone. Using these presentation templates you will surely catch everyones attention. You can browse the ppts collection on our website. We have researchers who are experts at creating the right content for the templates. So you dont have to invest time in any additional work. Just grab the template now and use them.


This slide covers KPI dashboard for measuring the impact of RPA deployment on the HR department. It also include metrics such as automated processes, success rate, robot utilization, robot productivity, average processes duration in hours, etc. Showcasing this set of slides titled Human Resource Robotic Process Automation Metrics Operations Kpis With Success Rate Themes PDF. The topics addressed in these templates are Processes Automated, Robot Productivity, Robot Utilization. All the content presented in this PPT design is completely editable. Download it and make adjustments in color, background, font etc. as per your unique business setting.


This slide represents dashboard representing the key metrics of operational risk management. It includes KPIs such as operational risk by rating, by month, operational risk list etc.Create an editable Strategic Risk Management Plan Operational Risk Management Key Metrics Dashboard Structure PDF that communicates your idea and engages your audience. Whether you are presenting a business or an educational presentation, pre-designed presentation templates help save time. Strategic Risk Management Plan Operational Risk Management Key Metrics Dashboard Structure PDF is highly customizable and very easy to edit, covering many different styles from creative to business presentations. Slidegeeks has creative team members who have crafted amazing templates. So, go and get them without any delay.


This slide represents dashboard representing the key metrics of operational risk management. It includes KPIs such as operational risk by rating, by month, operational risk list etc. Present like a pro with Strategic Risk Management And Mitigation Plan Operational Risk Management Key Metrics Dashboard Sample PDF Create beautiful presentations together with your team, using our easy to use presentation slides. Share your ideas in real time and make changes on the fly by downloading our templates. So whether you are in the office, on the go, or in a remote location, you can stay in sync with your team and present your ideas with confidence. With Slidegeeks presentation got a whole lot easier. Grab these presentations today.


This slide represents dashboard representing the key metrics of operational risk management. It includes KPIs such as operational risk by rating, by month, operational risk list etc. Get a simple yet stunning designed Operational Risk Management Key Metrics Dashboard Professional PDF. It is the best one to establish the tone in your meetings. It is an excellent way to make your presentations highly effective. So, download this PPT today from Slidegeeks and see the positive impacts. Our easy to edit Operational Risk Management Key Metrics Dashboard Professional PDF can be your go-to option for all upcoming conferences and meetings. So, what are you waiting for Grab this template today.


This slide shows operating expenses OPEX dashboard indicating revenue and costs metrics which can be referred by companies to manage various operating expenses of various departments. It contains information about cost center, revenue per company, company code, etc. Pitch your topic with ease and precision using this Business Operational Expenditure Dashboard Indicating Revenue And Costs Metrics Pictures PDF. This layout presents information on Business Operational, Costs Metrics, Revenue. It is also available for immediate download and adjustment. So, changes can be made in the color, design, graphics or any other component to create a unique layout.


This slide illustrates performance analysis using operating revenue, operating expenditure opex and income metrics which can be referred by organizations to evaluate their inflows and outflows to make relevant decisions for increasing profitability. It includes information about operating revenue, operating expense and income before taxes. Pitch your topic with ease and precision using this Performance Analysis Using Operating Revenue Business Operational Expenditure And Income Metrics Diagrams PDF. This layout presents information on Taxes, Highest Operating, Recorded. It is also available for immediate download and adjustment. So, changes can be made in the color, design, graphics or any other component to create a unique layout.


This slide showcases annual cash inflow of different companys. The graph shows the profitability potential of the firm. Showcasing this set of slides titled Operating Activity Metrics Showing Net Cash Flow Ppt Outline Slide Download PDF. The topics addressed in these templates are Net Cash Flow, Operating Activities, Key Insights, 2020 To 2022. All the content presented in this PPT design is completely editable. Download it and make adjustments in color, background, font etc. as per your unique business setting.


This slide showcases yearly cash conversion cycle to determine companys working capital management. It includes DSO, DIO, DPO and CCC that measure the average number of days organization takes to collect payment and pay bills. Pitch your topic with ease and precision using this Cash Flow Metrics To Measure Firm Operations Effectiveness Ppt Outline Infographic Template PDF. This layout presents information on Cash Conversion Cycle, 2019 To 2022, Cash Flow. It is also available for immediate download and adjustment. So, changes can be made in the color, design, graphics or any other component to create a unique layout.
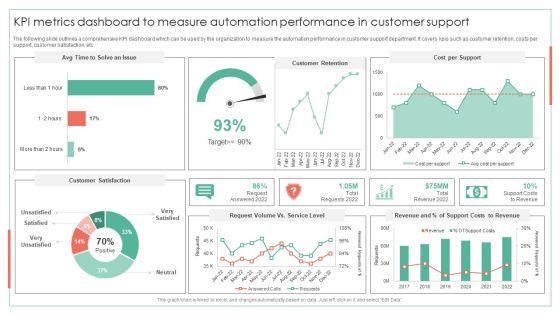

The following slide outlines a comprehensive KPI dashboard which can be used by the organization to measure the automation performance in customer support department. It covers kpis such as customer retention, costs per support, customer satisfaction, etcDeliver and pitch your topic in the best possible manner with this KPI Metrics Dashboard To Measure Automation Performance Achieving Operational Efficiency Guidelines PDF. Use them to share invaluable insights on Customer Retention, Cost Per Support, Request Volume and impress your audience. This template can be altered and modified as per your expectations. So, grab it now.


This slide showcases key performance indicators for every business. Key metrics covered are return on assets and equity, working capital ratio, debt and equity ratio. Showcasing this set of slides titled Key Company Financial Operation Performance Metrics Ppt Infographic Template Example Introduction PDF. The topics addressed in these templates are Return on Assets, Working Capital Ratio, Return on Equity. All the content presented in this PPT design is completely editable. Download it and make adjustments in color, background, font etc. as per your unique business setting.


This slide focuses on dashboard that provides information about the information technology operations for managing IT project which covers the investments, billed amount, time taken to complete the project, customer satisfaction, monthly expenses, service level agreement status, etc. Pitch your topic with ease and precision using this IT Operations Dashboard For Project Metrics Portrait PDF. This layout presents information on Revenues, Investments, Monthly Expenses. It is also available for immediate download and adjustment. So, changes can be made in the color, design, graphics or any other component to create a unique layout.


This slide shows the dashboard that depicts the metrics for measuring employee performance which includes talent satisfaction, talent turnover rate, rating, etc.Deliver an awe inspiring pitch with this creative RPA In HR Operations Dashboard Showing Employee Measurement Metrics Slides PDF bundle. Topics like Talent Management, Talent Satisfaction, Talent Turnover can be discussed with this completely editable template. It is available for immediate download depending on the needs and requirements of the user.


This slide focuses on the comparison of logistics performance metrics with competitors on the basis of parameters such as shipping time, order accuracy, equipment utilization rate, etc.Deliver an awe inspiring pitch with this creative Developing Excellence In Logistics Operations Comparing Logistics Performance Metrics Diagrams PDF bundle. Topics like Order Accuracy, Equipment Utilization, Transportation Costs can be discussed with this completely editable template. It is available for immediate download depending on the needs and requirements of the user.
This graph or chart is linked to excel, and changes automatically based on data. Just left click on it and select edit data. Showcasing this set of slides titled Finance Metrics Dashboard Illustrating Gross And Operating Profit Margin Icons PDF. The topics addressed in these templates are Gross Profit Margin, Operating Profit Margin, Net Profit Margin. All the content presented in this PPT design is completely editable. Download it and make adjustments in color, background, font etc. as per your unique business setting.
Presenting Operational Risk Metrics Dashboard Icon Mockup PDF to dispense important information. This template comprises four stages. It also presents valuable insights into the topics including Operational Risk Metrics Dashboard Icon. This is a completely customizable PowerPoint theme that can be put to use immediately. So, download it and address the topic impactfully.


This slide represents dashboard showcasing e-commerce financial process metrics illustrating eccentric purchase conversation rate, shipping revenue, average quantity etc.Showcasing this set of slides titled dashboard depicting e-commerce business financial operations metrics topics pdf The topics addressed in these templates are eccentric purchase, average product revenue, impression rate All the content presented in this PPT design is completely editable. Download it and make adjustments in color, background, font etc. as per your unique business setting.


This slide provides information regarding the various metrics that considered essential in determine the effectiveness of DevOps systems Quality in terms of sprint and iteration performance, release quality, engagement level, firm level performance and other metrics. Presenting development and operations model reevaluating quality control role it various metrics to measure clipart pdf to provide visual cues and insights. Share and navigate important information on four stages that need your due attention. This template can be used to pitch topics like sprint and iteration performance, release quality, engagement level, firm level performance. In addtion, this PPT design contains high resolution images, graphics, etc, that are easily editable and available for immediate download.


This slide provides information regarding the various metrics that considered essential in determine the effectiveness of DevOps systems Quality in terms of sprint iteration performance, release quality, engagement level, firm level performance and other metrics. This is a e2e quality assurance and testing in developer operations it various metrics themes pdf background pdf template with various stages. Focus and dispense information on four stages using this creative set, that comes with editable features. It contains large content boxes to add your information on topics like before implementation, product failure rate, mean time to resolution You can also showcase facts, figures, and other relevant content using this PPT layout. Grab it now.


This slide provides information regarding the various metrics that considered essential in determine the effectiveness of DevOps systems Quality in terms of sprint or iteration performance, release quality, engagement level, firm level performance and other metrics. Presenting development and operations quality assurance and validation it various metrics to measure diagrams pdf to provide visual cues and insights. Share and navigate important information on four stages that need your due attention. This template can be used to pitch topics like engagement level, firm level performance, release quality In addtion, this PPT design contains high resolution images, graphics, etc, that are easily editable and available for immediate download.


This slide provides information regarding the various metrics that considered essential in determine the effectiveness of DevOps systems in terms of DevOps deployment, error rates and application performance and other metrics. Presenting comprehensive development and operations adoption initiatives it various metrics to measure elements pdf to provide visual cues and insights. Share and navigate important information on three stages that need your due attention. This template can be used to pitch topics like implementation, productivity, team, production. In addtion, this PPT design contains high resolution images, graphics, etc, that are easily editable and available for immediate download.


This template covers DevOps global performance metrics such as deployment frequency trends, change failure trends and time to resolve trends etc. Deliver an awe inspiring pitch with this creative development and operations kpi dashboard it global devops performance metrics themes pdf bundle. Topics like global devops performance metrics can be discussed with this completely editable template. It is available for immediate download depending on the needs and requirements of the user.


This slide provides information regarding the various metrics that considered essential in determine the effectiveness of DevOps systems in terms of DevOps deployment, error rates and application performance and other metrics. This is a strategic development and operations execution it various metrics to measure diagrams pdf template with various stages. Focus and dispense information on three stages using this creative set, that comes with editable features. It contains large content boxes to add your information on topics like devops deployment, error rates, application performance. You can also showcase facts, figures, and other relevant content using this PPT layout. Grab it now.


This slide provides information regarding the various metrics that considered essential in determine the effectiveness of DevOps systems in terms of DevOps deployment, error rates and application performance and other metrics. This is a software development and it operations infrastructure development it various metrics to measure microsoft pdf template with various stages. Focus and dispense information on three stages using this creative set, that comes with editable features. It contains large content boxes to add your information on topics like devops deployment, error rates, application performance. You can also showcase facts, figures, and other relevant content using this PPT layout. Grab it now.
SHOW
- 60
- 120
- 180
DISPLAYING: 60 of 146 Item(s)
Page