 AI PPT Maker
 Templates
 PPT Bundles
 Design Services
 Business PPTs
 Business Plan
 Management
 Strategy
 Introduction PPT
 Roadmap
 Self Introduction
 Timelines
 Process
 Marketing
 Agenda
 Technology
 Medical
 Startup Business Plan
 Cyber Security
 Dashboards
 SWOT
SWOT Proposals
 Education
 Pitch Deck
 Digital Marketing
 KPIs
KPIs Project Management
 Product Management
 Artificial Intelligence
 Target Market
 Communication
 Supply Chain
 Google Slides
 Research Services
 One Pagers
 All Categories
Operational performance PowerPoint Presentation Templates and Google Slides
SHOW
- 60
- 120
- 180
DISPLAYING: 60 of 298 Item(s)
Page


This complete presentation has PPT slides on wide range of topics highlighting the core areas of your business needs. It has professionally designed templates with relevant visuals and subject driven content. This presentation deck has total of ninety five slides. Get access to the customizable templates. Our designers have created editable templates for your convenience. You can edit the colour, text and font size as per your need. You can add or delete the content if required. You are just a click to away to have this ready made presentation. Click the download button now.


This fifty eight slide ATS Administration To Improve Operational Performance Ppt PowerPoint Presentation Complete Deck With Slides is your content ready tool to impress the stakeholders with your business planning and its manner of execution. Showcase your ideas and how you plan to make them real in detail with this PPT Template Bundle. The slides have the conceptual bandwidth to present the crucial aspects of your plan, such as funding, marketing, resource allocation, timeline, roadmap, and more. When you present your plans with this PPT Layout, the stakeholders are sure to come on board because you will be able to present a succinct, thought-out, winning project. Download this Complete Deck now to take control into your hands. The 100 percent customizable offer is just too good to be resisted.


This complete deck acts as a great communication tool. It helps you in conveying your business message with personalized sets of graphics, icons etc. Comprising a set of fifty slides, this complete deck can help you persuade your audience. It also induces strategic thinking as it has been thoroughly researched and put together by our experts. Not only is it easily downloadable but also editable. The color, graphics, theme any component can be altered to fit your individual needs. So grab it now.


This hospital staff performing operation ppt powerpoint presentation complete deck acts as backup support for your ideas, vision, thoughts, etc. Use it to present a thorough understanding of the topic. This PPT slideshow can be utilized for both in-house and outside presentations depending upon your needs and business demands. Entailing twelve slides with a consistent design and theme, this template will make a solid use case. As it is intuitively designed, it suits every business vertical and industry. All you have to do is make a few tweaks in the content or any other component to design unique presentations. The biggest advantage of this complete deck is that it can be personalized multiple times once downloaded. The color, design, shapes, and other elements are free to modify to add personal touches. You can also insert your logo design in this PPT layout. Therefore a well-thought and crafted presentation can be delivered with ease and precision by downloading this hospital staff performing operation ppt powerpoint presentation complete deck PPT slideshow.


Presenting this set of slides with name online business platforms operational testing performance testing social media ppt powerpoint presentation complete deck. The topics discussed in these slides are management, business, initiatives, data quality, value. This is a completely editable PowerPoint presentation and is available for immediate download. Download now and impress your audience.


Software Functional Operational And Performance Testing Ppt PowerPoint Presentation Portfolio Topics
Presenting this set of slides with name software functional operational and performance testing ppt powerpoint presentation portfolio topics. This is a eight stage process. The stages in this process are application, mobile screen, business transformation. This is a completely editable PowerPoint presentation and is available for immediate download. Download now and impress your audience.


Mentioned slide displays a dashboard to assess retail store performance. Metrics included in the dashboard are net sales, average unit in retail, average basket size, sales volume by store and total visitors count. Explore a selection of the finest Retail Business Operation Management To Optimize Customer Experience Retail Store Performance Analysis Inspiration PDF here. With a plethora of professionally designed and pre made slide templates, you can quickly and easily find the right one for your upcoming presentation. You can use our Retail Business Operation Management To Optimize Customer Experience Retail Store Performance Analysis Inspiration PDF to effectively convey your message to a wider audience. Slidegeeks has done a lot of research before preparing these presentation templates. The content can be personalized and the slides are highly editable. Grab templates today from Slidegeeks.


This slide presents a dashboard to analyze and monitor business operational activities and gain insights of functional performance. It includes key components such as revenue, sigh ups, visitors, revenue by source, monthly sign ups, top performing agents, etc. Showcasing this set of slides titled Business Operations Performance Assessment Dashboard Information PDF. The topics addressed in these templates are Source, Monthly, Agents. All the content presented in this PPT design is completely editable. Download it and make adjustments in color, background, font etc. as per your unique business setting.
This slide showcases dashboard which tracks project stages and monitors budget spends and other KPIs. Key project stages included here are overdue tasks, upcoming deadlines, project completion stage, workload factors, etc. Pitch your topic with ease and precision using this Lean Operational Excellence Strategy Dashboard To Track And Monitor Project Performance Slides PDF. This layout presents information on Planning, Design, Development. It is also available for immediate download and adjustment. So, changes can be made in the color, design, graphics or any other component to create a unique layout.


This slide illustrates challenges associated with implementation of data governance operating model. It includes functional areas such as data insights, data quality, data ownership, etc. Showcasing this set of slides titled Performance Metrics For Data Governance Operating Framework Summary PDF. The topics addressed in these templates are Attributes By Glossary, Rules Measured, Rules Against Target. All the content presented in this PPT design is completely editable. Download it and make adjustments in color, background, font etc. as per your unique business setting.


Mentioned slide displays a dashboard to assess retail store performance. Metrics included in the dashboard are net sales, average unit in retail, average basket size, sales volume by store and total visitors count. Present like a pro with Retail Business Optimization Through Operational Excellence Strategy Retail Store Performance Analysis Portrait PDF Create beautiful presentations together with your team, using our easy to use presentation slides. Share your ideas in real time and make changes on the fly by downloading our templates. So whether you are in the office, on the go, or in a remote location, you can stay in sync with your team and present your ideas with confidence. With Slidegeeks presentation got a whole lot easier. Grab these presentations today.

This slide illustrates a graph of operating profit in US dollar and gross margin in percentage for food company. Additionally, it shows operating profit of all business lines of the company food, beverage and dairy products. Find a pre-designed and impeccable Food Company Financial Performance Summary Operating Profit And Margin Topics PDF. The templates can ace your presentation without additional effort. You can download these easy-to-edit presentation templates to make your presentation stand out from others. So, what are you waiting for Download the template from Slidegeeks today and give a unique touch to your presentation.


Following slide demonstrates KPI dashboard to monitor performance of sales executives to determine best performing employee. It includes key components such as monthly performance, targets achieved, sales by executives, lead funnel, total daily and monthly profits. Pitch your topic with ease and precision using this KPI Dashboard To Monitor Operational Sales Executive Performance Portrait PDF. This layout presents information on Revenue, Profit, Sales, Customers. It is also available for immediate download and adjustment. So, changes can be made in the color, design, graphics or any other component to create a unique layout.
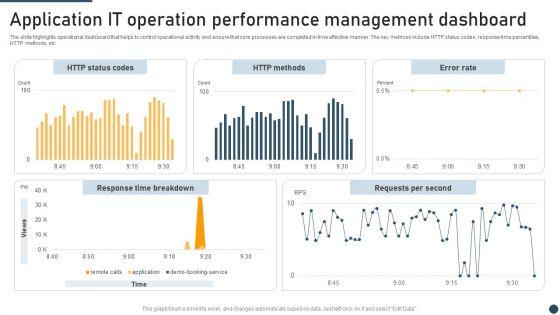

The slide highlights operational dashboard that helps to control operational activity and ensure that core processes are completed in time effective manner. The key metrices include HTTP status codes, response time percentiles, HTTP methods, etc. Showcasing this set of slides titled Application It Operation Performance Management Dashboard Themes PDF. The topics addressed in these templates are HTTP Status Codes, HTTP Methods, Error Rate. All the content presented in this PPT design is completely editable. Download it and make adjustments in color, background, font etc. as per your unique business setting.

Strategic Guide To Perform Marketing Overview Of Business Operating In Beverage Industry Designs PDF
The following slide provides a summary of beverage products manufacturing and supplying company to gain business insights. It showcases information such as total revenue, business journey, business facts and market share. Coming up with a presentation necessitates that the majority of the effort goes into the content and the message you intend to convey. The visuals of a PowerPoint presentation can only be effective if it supplements and supports the story that is being told. Keeping this in mind our experts created Strategic Guide To Perform Marketing Overview Of Business Operating In Beverage Industry Designs PDF to reduce the time that goes into designing the presentation. This way, you can concentrate on the message while our designers take care of providing you with the right template for the situation.
This slide describes the performance tracking dashboard for 5G architecture by covering the details of subscribers, quality of experience, consumption, customer support, coverage, devices, and dimensions. Are you searching for a 5G Network Operations Performance Tracking Dashboard For 5G Architecture Demonstration PDF that is uncluttered, straightforward, and original. Its easy to edit, and you can change the colors to suit your personal or business branding. For a presentation that expresses how much effort youve put in, this template is ideal With all of its features, including tables, diagrams, statistics, and lists, its perfect for a business plan presentation. Make your ideas more appealing with these professional slides. Download 5G Network Operations Performance Tracking Dashboard For 5G Architecture Demonstration PDF from Slidegeeks today.
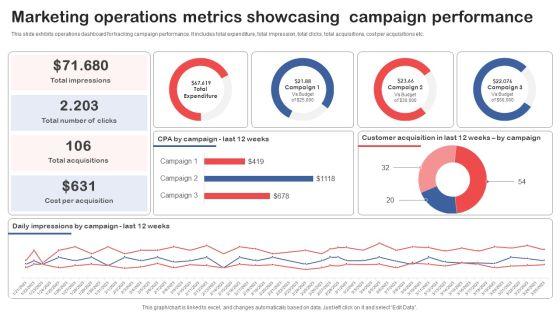

Showcasing this set of slides titled Marketing Operations Metrics Showcasing Campaign Performance Clipart PDF. The topics addressed in these templates are Marketing Operations Metrics, Showcasing Campaign Performance. All the content presented in this PPT design is completely editable. Download it and make adjustments in color, background, font etc. as per your unique business setting.


This slide represents a dashboard showcasing operations metrics to monitor medical institute performance. It includes the total number of patients, operational cost, available staff, etc. Showcasing this set of slides titled Hospital Operations Metrics To Monitor Performance Structure PDF. The topics addressed in these templates are Divisions, Overall Patient Satisfaction, Total Operational Cost. All the content presented in this PPT design is completely editable. Download it and make adjustments in color, background, font etc. as per your unique business setting.

This slide illustrates a graph of operating profit in US doller and operating margin in percentage for software company illustrating growth trend in last five years from 2019 to 2023. It also showcases operating profit contribution by services and solutions. Slidegeeks is here to make your presentations a breeze with Operating Profit And Margin Financial Performance Report Of Software Firm Themes PDF With our easy-to-use and customizable templates, you can focus on delivering your ideas rather than worrying about formatting. With a variety of designs to choose from, you are sure to find one that suits your needs. And with animations and unique photos, illustrations, and fonts, you can make your presentation pop. So whether you are giving a sales pitch or presenting to the board, make sure to check out Slidegeeks first.


This template covers about marketing, finance and sales operations along with details related to top employees.Showcasing this set of slides titled Personnel Performance Evaluation Report With Sales And Marketing Operations Infographics PDF. The topics addressed in these templates are Human Resources, Customer Support, Sales Operations. All the content presented in this PPT design is completely editable. Download it and make adjustments in color, background, font etc. as per your unique business setting.
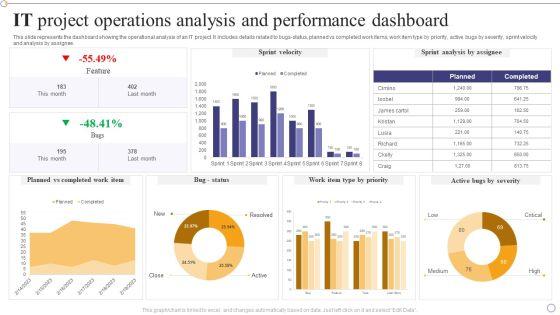

This slide represents the dashboard showing the operational analysis of an IT project. It includes details related to bugs-status, planned vs completed work items, work item type by priority, active bugs by severity, sprint velocity and analysis by assignee.Showcasing this set of slides titled IT Project Operations Analysis And Performance Dashboard Themes PDF. The topics addressed in these templates are Planned Completed, Sprint Analysis, Feature. All the content presented in this PPT design is completely editable. Download it and make adjustments in color, background, font etc. as per your unique business setting.


This slide shows the dashboard to measure business financial performance which focuses on revenues, debt to equity, net profit margin, gross profit margin and return on equity. Coming up with a presentation necessitates that the majority of the effort goes into the content and the message you intend to convey. The visuals of a PowerPoint presentation can only be effective if it supplements and supports the story that is being told. Keeping this in mind our experts created BPR To Develop Operational Effectiveness Dashboard To Measure Business Financial Performance Elements PDF to reduce the time that goes into designing the presentation. This way, you can concentrate on the message while our designers take care of providing you with the right template for the situation.


The following slide showcases dashboard which can be used by the healthcare professionals to measure the performance of operational department. The KPIs covered in the slide are total patients, operational cost, available staff per division etc. There are so many reasons you need a Healthcare Management Overview Trends Stats And Operational Areas Dashboard To Evaluate The Hospital Operations Performance Pictures PDF. The first reason is you can not spend time making everything from scratch, Thus, Slidegeeks has made presentation templates for you too. You can easily download these templates from our website easily.
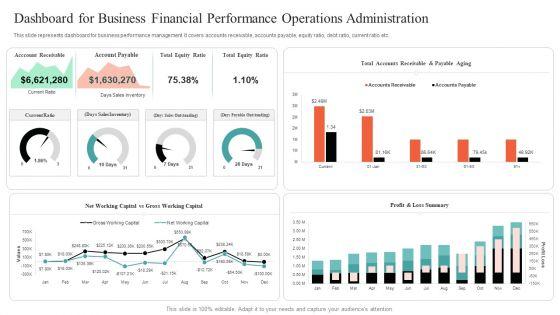

This slide represents dashboard for business performance management. It covers accounts receivable, accounts payable, equity ratio, debt ratio, current ratio etc. Showcasing this set of slides titled Dashboard For Business Financial Performance Operations Administration Mockup PDF. The topics addressed in these templates are Dashboard For Business Financial, Performance Operations Administration. All the content presented in this PPT design is completely editable. Download it and make adjustments in color, background, font etc. as per your unique business setting.
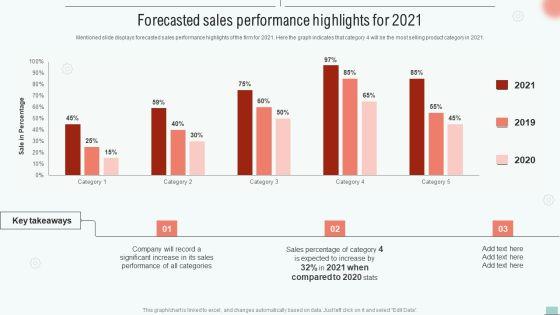
Mentioned slide displays forecasted sales performance highlights of the firm for 2021. Here the graph indicates that category 4 will be the most selling product category in 2021.Crafting an eye-catching presentation has never been more straightforward. Let your presentation shine with this tasteful yet straightforward Implementing BPM Tool To Enhance Operational Efficiency Forecasted Sales Performance Highlights For 2021 Designs PDF template. It offers a minimalistic and classy look that is great for making a statement. The colors have been employed intelligently to add a bit of playfulness while still remaining professional. Construct the ideal Implementing BPM Tool To Enhance Operational Efficiency Forecasted Sales Performance Highlights For 2021 Designs PDF that effortlessly grabs the attention of your audience Begin now and be certain to wow your customers.


This slide illustrates performance analysis using operating revenue, operating expenditure opex and income metrics which can be referred by organizations to evaluate their inflows and outflows to make relevant decisions for increasing profitability. It includes information about operating revenue, operating expense and income before taxes. Pitch your topic with ease and precision using this Performance Analysis Using Operating Revenue Business Operational Expenditure And Income Metrics Diagrams PDF. This layout presents information on Taxes, Highest Operating, Recorded. It is also available for immediate download and adjustment. So, changes can be made in the color, design, graphics or any other component to create a unique layout.
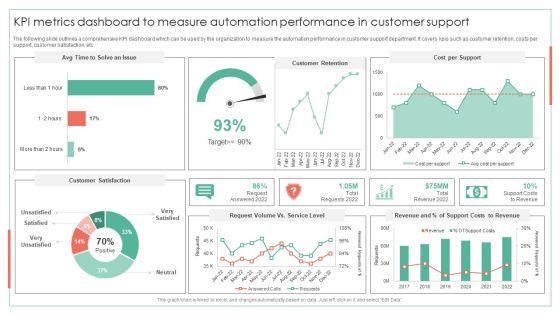

The following slide outlines a comprehensive KPI dashboard which can be used by the organization to measure the automation performance in customer support department. It covers kpis such as customer retention, costs per support, customer satisfaction, etcDeliver and pitch your topic in the best possible manner with this KPI Metrics Dashboard To Measure Automation Performance Achieving Operational Efficiency Guidelines PDF. Use them to share invaluable insights on Customer Retention, Cost Per Support, Request Volume and impress your audience. This template can be altered and modified as per your expectations. So, grab it now.


The following slide outlines performance key performance indicator KPI which can be used to evaluate business process automation performance in employee onboarding. The metrics highlighted in the slide are onboarding completion status, hires per office, etc.Deliver an awe inspiring pitch with this creative KPI Dashboard To Track Automation Performance In Employee Onboarding Achieving Operational Efficiency Download PDF bundle. Topics like Onboarding Completion, Onboarding, Onboarding Completion can be discussed with this completely editable template. It is available for immediate download depending on the needs and requirements of the user.
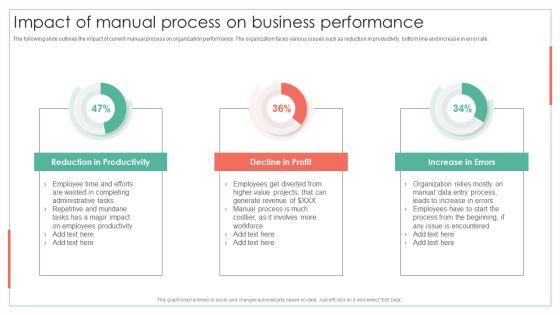

The following slide outlines the impact of current manual process on organization performance. The organization faces various issues such as reduction in productivity, bottom line and increase in error rate.Deliver and pitch your topic in the best possible manner with this Impact Of Manual Process On Business Performance Achieving Operational Efficiency Guidelines PDF. Use them to share invaluable insights on Reduction Productivity, Increase Errors, Decline Profit and impress your audience. This template can be altered and modified as per your expectations. So, grab it now.

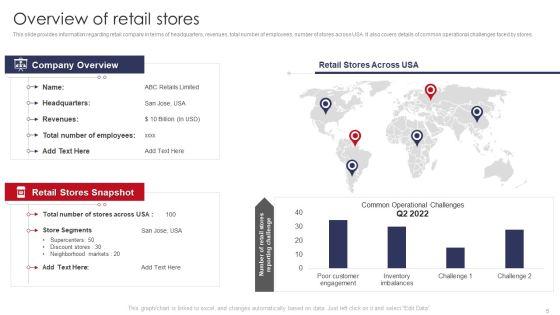
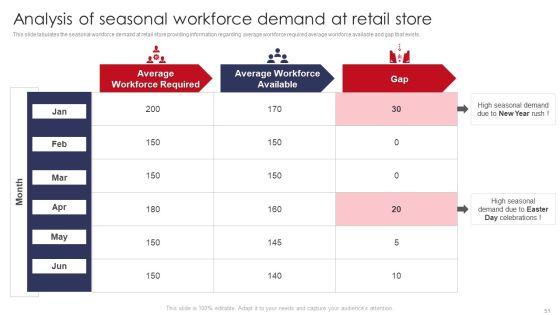
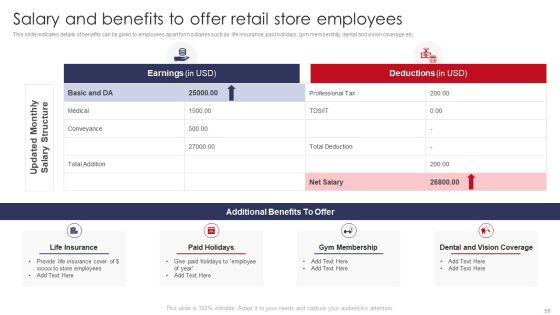
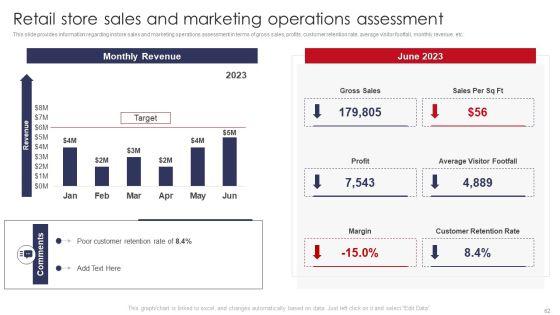
This slide provides information regarding instore sales and marketing operations assessment in terms of gross sales, profits, customer retention rate, average visitor footfall, monthly revenue, etc.Deliver and pitch your topic in the best possible manner with this Retail Store Sales And Marketing Operations Assessment Retail Outlet Performance Assessment Professional PDF. Use them to share invaluable insights on Gross Sales, Visitor Footfall, Customer Retention and impress your audience. This template can be altered and modified as per your expectations. So, grab it now.


This slide showcases key performance indicators for every business. Key metrics covered are return on assets and equity, working capital ratio, debt and equity ratio. Showcasing this set of slides titled Key Company Financial Operation Performance Metrics Ppt Infographic Template Example Introduction PDF. The topics addressed in these templates are Return on Assets, Working Capital Ratio, Return on Equity. All the content presented in this PPT design is completely editable. Download it and make adjustments in color, background, font etc. as per your unique business setting.


The following slide highlights the dashboard of DevOps with focuses on the items involved in project and also illustrates the bug involved in project. Showcasing this set of slides titled Software Development And IT Operation Dashboard Indicating Project Performance Demonstration PDF. The topics addressed in these templates are Software Development, IT Operation Dashboard, Indicating Project Performance. All the content presented in this PPT design is completely editable. Download it and make adjustments in color, background, font etc. as per your unique business setting.

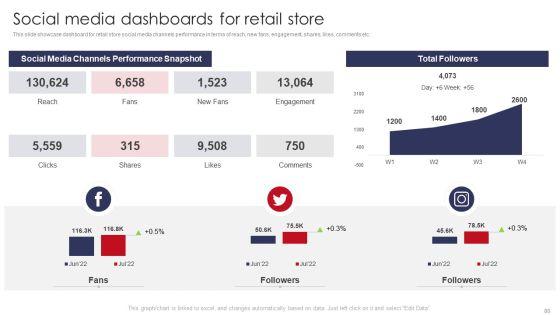
This slide showcase dashboard for retail store social media channels performance in terms of reach, new fans, engagement, shares, likes, comments etc.Deliver an awe inspiring pitch with this creative Social Media Dashboards For Retail Store Retail Outlet Operations Performance Evaluation Inspiration PDF bundle. Topics like Social Media, Channels Performance, Snapshot can be discussed with this completely editable template. It is available for immediate download depending on the needs and requirements of the user.


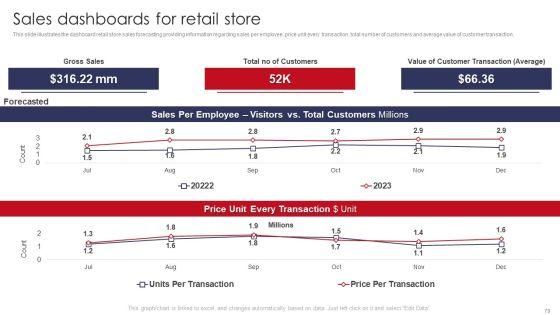
This slide illustrates the dashboard retail store sales forecasting providing information regarding sales per employee, price unit every transaction, total number of customers and average value of customer transaction.Deliver an awe inspiring pitch with this creative Sales Dashboards For Retail Store Retail Outlet Operations Performance Evaluation Introduction PDF bundle. Topics like Gross Sales, Total Customers, Value Customer can be discussed with this completely editable template. It is available for immediate download depending on the needs and requirements of the user.
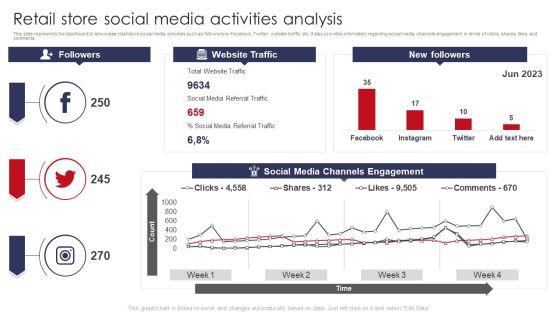

This slide represents the dashboard to showcase retail store social media activities such as followers on Facebook, Twitter, website traffic, etc. It also provides information regarding social media channels engagement in terms of clicks, shares, likes, and comments.Deliver and pitch your topic in the best possible manner with this Retail Store Social Media Activities Analysis Retail Outlet Operations Performance Evaluation Slides PDF. Use them to share invaluable insights on Social Media, Referral Traffic, Channels Engagement and impress your audience. This template can be altered and modified as per your expectations. So, grab it now.
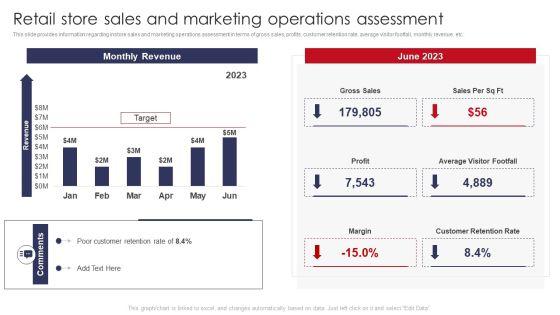

This slide provides information regarding instore sales and marketing operations assessment in terms of gross sales, profits, customer retention rate, average visitor footfall, monthly revenue, etc.Deliver an awe inspiring pitch with this creative Retail Store Sales And Marketing Operations Assessment Retail Outlet Operations Performance Evaluation Formats PDF bundle. Topics like Target, Gross Sales, Average Visitor can be discussed with this completely editable template. It is available for immediate download depending on the needs and requirements of the user.
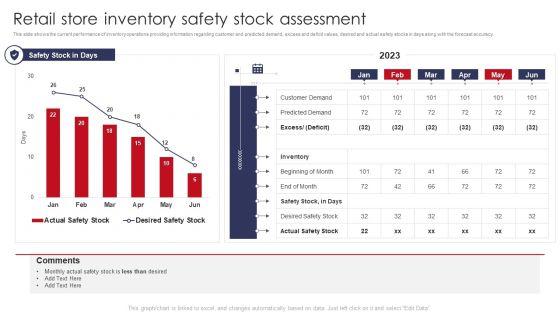

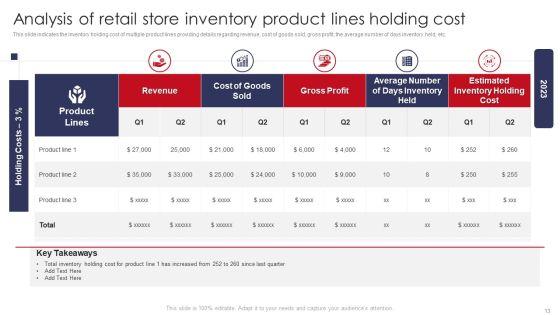
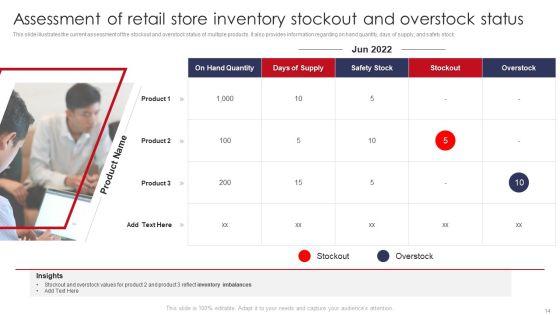
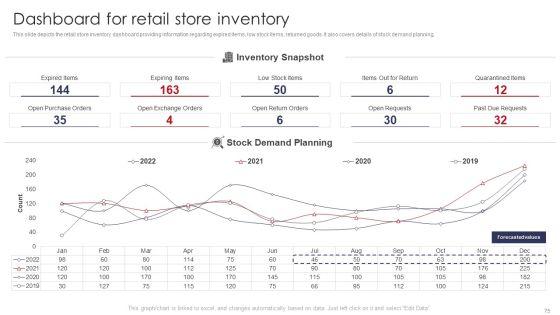
This slide shows the current performance of inventory operations providing information regarding customer and predicted demand, excess and deficit values, desired and actual safety stocks in days along with the forecast accuracy.Deliver and pitch your topic in the best possible manner with this Retail Store Inventory Safety Stock Assessment Retail Outlet Operations Performance Evaluation Graphics PDF. Use them to share invaluable insights on Predicted Demand, Customer Demand, Beginning and impress your audience. This template can be altered and modified as per your expectations. So, grab it now.


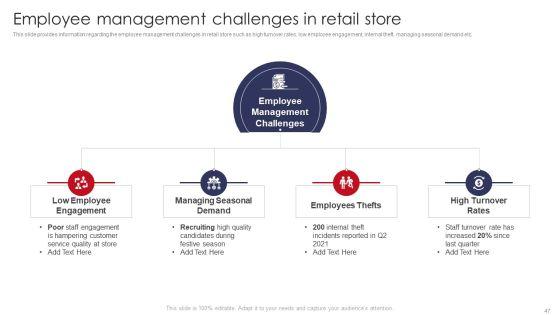
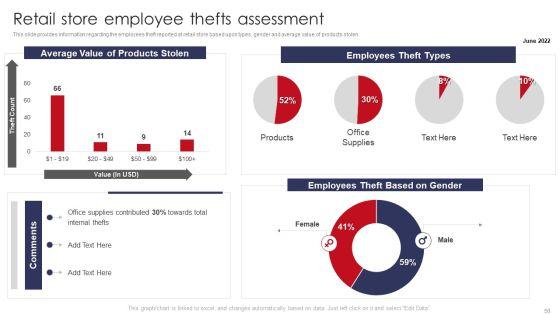
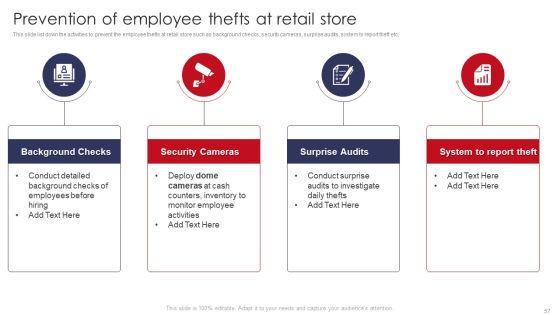
This slide provides information regarding the employees theft reported at retail store based upon types, gender and average value of products stolen.Deliver and pitch your topic in the best possible manner with this Retail Store Employee Thefts Assessment Retail Outlet Operations Performance Evaluation Professional PDF. Use them to share invaluable insights on Average Value, Products Stolen, Employees Theft and impress your audience. This template can be altered and modified as per your expectations. So, grab it now.


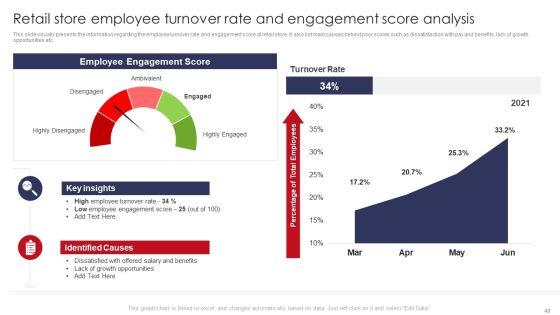
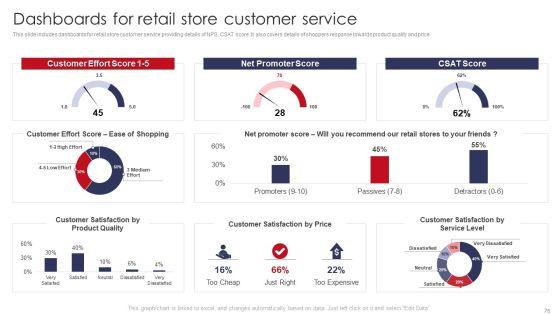
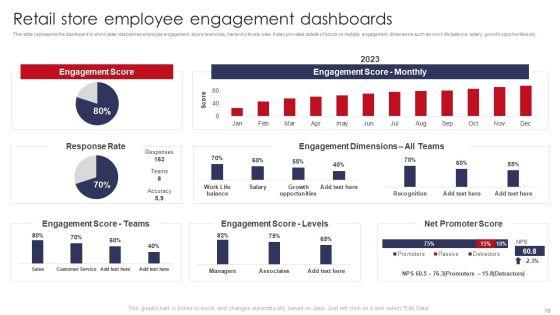
This slide represents the dashboard to showcase retail stores employee engagement score teamwise, hierarchy levels wise. It also provides details of score on multiple engagement dimensions such as work life balance, salary, growth opportunities etc.Deliver an awe inspiring pitch with this creative Retail Store Employee Engagement Dashboards Retail Outlet Operations Performance Evaluation Background PDF bundle. Topics like Engagement Score, Engagement Dimensions, Score Teams can be discussed with this completely editable template. It is available for immediate download depending on the needs and requirements of the user.
SHOW
- 60
- 120
- 180
DISPLAYING: 60 of 298 Item(s)
Page