 AI PPT Maker
 Templates
 PPT Bundles
 Design Services
 Business PPTs
 Business Plan
 Management
 Strategy
 Introduction PPT
 Roadmap
 Self Introduction
 Timelines
 Process
 Marketing
 Agenda
 Technology
 Medical
 Startup Business Plan
 Cyber Security
 Dashboards
 SWOT
SWOT Proposals
 Education
 Pitch Deck
 Digital Marketing
 KPIs
KPIs Project Management
 Product Management
 Artificial Intelligence
 Target Market
 Communication
 Supply Chain
 Google Slides
 Research Services
 One Pagers
 All Categories
Operational kpis PowerPoint Presentation Templates and Google Slides
SHOW
- 60
- 120
- 180
DISPLAYING: 60 of 126 Item(s)
Page


Induce strategic thinking by presenting this complete deck. Enthrall your audience by deploying this thought provoking PPT deck. It can be downloaded in both standard and widescreen aspect ratios, thus making it a complete package to use and deploy. Convey your thoughts and actions using the twenty two slides presented in this complete deck. Additionally, feel free to alter its components like color, graphics, design, etc, to create a great first impression. Grab it now by clicking on the download button below.


If designing a presentation takes a lot of your time and resources and you are looking for a better alternative, then this Development And Operations KPI Dashboard Ppt PowerPoint Presentation Complete Deck With Slides is the right fit for you. This is a prefabricated set that can help you deliver a great presentation on the topic. All the twelve slides included in this sample template can be used to present a birds-eye view of the topic. These slides are also fully editable, giving you enough freedom to add specific details to make this layout more suited to your business setting. Apart from the content, all other elements like color, design, theme are also replaceable and editable. This helps in designing a variety of presentations with a single layout. Not only this, you can use this PPT design in formats like PDF, PNG, and JPG once downloaded. Therefore, without any further ado, download and utilize this sample presentation as per your liking.


Presenting this set of slides with name operational kpis ppt powerpoint presentation ideas clipart images cpb. This is an editable Powerpoint five stages graphic that deals with topics like operational kpis to help convey your message better graphically. This product is a premium product available for immediate download and is 100 percent editable in Powerpoint. Download this now and use it in your presentations to impress your audience.


Presenting this set of slides with name operational excellence kpi ppt powerpoint presentation infographic template graphics tutorials cpb. This is an editable Powerpoint four stages graphic that deals with topics like operational excellence kpi to help convey your message better graphically. This product is a premium product available for immediate download and is 100 percent editable in Powerpoint. Download this now and use it in your presentations to impress your audience.


This slide portrays key performance dashboard for measuring retail business performance. KPIs covered in the dashboards are average shopping time, shop visitors, average basket spend and customer retention. Are you in need of a template that can accommodate all of your creative concepts This one is crafted professionally and can be altered to fit any style. Use it with Google Slides or PowerPoint. Include striking photographs, symbols, depictions, and other visuals. Fill, move around, or remove text boxes as desired. Test out color palettes and font mixtures. Edit and save your work, or work with colleagues. Download Retail Business Operation Management To Optimize Customer Experience KPI Dashboard For Retail Business Download PDF and observe how to make your presentation outstanding. Give an impeccable presentation to your group and make your presentation unforgettable.


This slide portrays key performance dashboard for measuring retail business performance. KPIs covered in the dashboards are average shopping time, shop visitors, average basket spend and customer retention. Boost your pitch with our creative Retail Business Optimization Through Operational Excellence Strategy KPI Dashboard For Retail Business Mockup PDF. Deliver an awe-inspiring pitch that will mesmerize everyone. Using these presentation templates you will surely catch everyones attention. You can browse the ppts collection on our website. We have researchers who are experts at creating the right content for the templates. So you do not have to invest time in any additional work. Just grab the template now and use them.


Following slide demonstrates KPI dashboard to monitor performance of sales executives to determine best performing employee. It includes key components such as monthly performance, targets achieved, sales by executives, lead funnel, total daily and monthly profits. Pitch your topic with ease and precision using this KPI Dashboard To Monitor Operational Sales Executive Performance Portrait PDF. This layout presents information on Revenue, Profit, Sales, Customers. It is also available for immediate download and adjustment. So, changes can be made in the color, design, graphics or any other component to create a unique layout.


This slide covers key performance indicators survey results of IT operation monitoring. The purpose of this template is to measure progress towards specific goals and objectives that have quantifiable milestones. It also serves as benchmark for innovation and improvement. It includes log files, cloud app workloads, NPM etc. Showcasing this set of slides titled It Operation Management Kpi Statistics Graphics PDF. The topics addressed in these templates are KPI Statistics, Management, Network Monitoring. All the content presented in this PPT design is completely editable. Download it and make adjustments in color, background, font etc. as per your unique business setting.


Mentioned slide illustrates warehouse operations dashboard with key performance indicators KPIs. KPIs included are operating cost, order rate, total shipment by country and on-time shipment.Presenting this PowerPoint presentation, titled Kpi Dashboard For Monitoring Warehouse Operations Stand Out Digital Supply Chain Tactics Enhancing Information PDF, with topics curated by our researchers after extensive research. This editable presentation is available for immediate download and provides attractive features when used. Download now and captivate your audience. Presenting this Kpi Dashboard For Monitoring Warehouse Operations Stand Out Digital Supply Chain Tactics Enhancing Information PDF. Our researchers have carefully researched and created these slides with all aspects taken into consideration. This is a completely customizable Kpi Dashboard For Monitoring Warehouse Operations Stand Out Digital Supply Chain Tactics Enhancing Information PDF that is available for immediate downloading. Download now and make an impact on your audience. Highlight the attractive features available with our PPTs.


This slide represents the key metrics dashboard representing the management of credit risks by the organization. It includes details related to key risk indicators, exposure by credit rating, sectors etc. Present like a pro with Operational Risk Assessment And Management Plan Credit Risk Management KPI Dashboard Guidelines PDF Create beautiful presentations together with your team, using our easy-to-use presentation slides. Share your ideas in real-time and make changes on the fly by downloading our templates. So whether you are in the office, on the go, or in a remote location, you can stay in sync with your team and present your ideas with confidence. With Slidegeeks presentation got a whole lot easier. Grab these presentations today.


Pitch your topic with ease and precision using this Data Quality Kpis Assessment Metrics For Operational Records Sample PDF. This layout presents information on Data Quality, Assessment Metrics, Operational Records. It is also available for immediate download and adjustment. So, changes can be made in the color, design, graphics or any other component to create a unique layout.


This slide depicts a dashboard to track the key performance metrics in sales and operations process of a manufacturing enterprise to analyze deviations in the actual and planned output. The key performing indicators are percentage deviation, dollar deviation, inventory in hand etc.Pitch your topic with ease and precision using this KPI Dashboard To Track Sales And Operations Process Of Manufacturing Enterprise Brochure PDF. This layout presents information on Planned Output, Yearly Growth, Inventory Hand. It is also available for immediate download and adjustment. So, changes can be made in the color, design, graphics or any other component to create a unique layout.


Logistics KPI Dashboard For Supply Chain Management To Enhance Logistics Operations Professional PDF
This slide displays the logistics dashboard for monitoring and reporting warehouse operations and transportation processes. It include KPIs such as revenue, shipments, avg delivery time, fleet status, delivery status, average loading time and weight, etc. Pitch your topic with ease and precision using this Logistics KPI Dashboard For Supply Chain Management To Enhance Logistics Operations Professional PDF. This layout presents information on Logistics KPI, Dashboard For Supply Chain, Management To Enhance, Logistics Operations. It is also available for immediate download and adjustment. So, changes can be made in the color, design, graphics or any other component to create a unique layout.


This slide covers KPI dashboard for measuring the impact of RPA deployment on the HR department. It also include metrics such as automated processes, success rate, robot utilization, robot productivity, average processes duration in hours, etc. Showcasing this set of slides titled Human Resource Robotic Process Automation Metrics Operations Kpis With Success Rate Themes PDF. The topics addressed in these templates are Processes Automated, Robot Productivity, Robot Utilization. All the content presented in this PPT design is completely editable. Download it and make adjustments in color, background, font etc. as per your unique business setting.


Following slide illustrates revenue and customers overview kpi dashboard for banks. Kpis covered in the dashboard are revenue actual vs. Target, number of new customers, customer acquisition cost vs. Customer lifetime value.This Implementing BPM Tool To Enhance Operational Efficiency Revenues And Customers Overview Kpi Dashboard Rules PDF is perfect for any presentation, be it in front of clients or colleagues. It is a versatile and stylish solution for organizing your meetings. The Implementing BPM Tool To Enhance Operational Efficiency Revenues And Customers Overview Kpi Dashboard Rules PDF features a modern design for your presentation meetings. The adjustable and customizable slides provide unlimited possibilities for acing up your presentation. Slidegeeks has done all the homework before launching the product for you. So, do not wait, grab the presentation templates today.


This slide showcase sales and operations dashboard for e commerce business. It involves total sales, total orders, profit and loss statement, average product value, sales by reference, sales by reference that help in tracking growth of product in market and also for analyzing organization market share. Pitch your topic with ease and precision using this Sales Operation E Commerce Business Kpis Ppt Infographics Design Templates PDF. This layout presents information on Total Orders, Sales Volume, Orders Channel. It is also available for immediate download and adjustment. So, changes can be made in the color, design, graphics or any other component to create a unique layout.
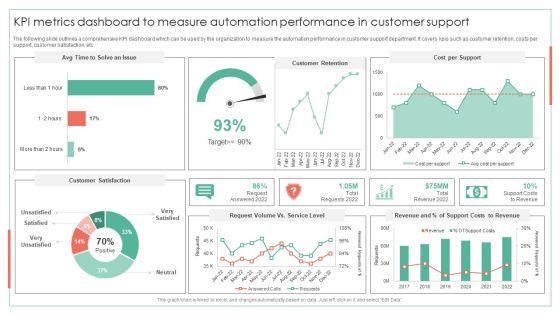

The following slide outlines a comprehensive KPI dashboard which can be used by the organization to measure the automation performance in customer support department. It covers kpis such as customer retention, costs per support, customer satisfaction, etcDeliver and pitch your topic in the best possible manner with this KPI Metrics Dashboard To Measure Automation Performance Achieving Operational Efficiency Guidelines PDF. Use them to share invaluable insights on Customer Retention, Cost Per Support, Request Volume and impress your audience. This template can be altered and modified as per your expectations. So, grab it now.


The following slide outlines a comprehensive dashboard depicting the business process automation BPA results in the supply chain. Information covered in the slide is related to average order processing days, average shipping days, etc.Deliver and pitch your topic in the best possible manner with this KPI Dashboard Highlighting Automation Results In Supply Achieving Operational Efficiency Graphics PDF. Use them to share invaluable insights on Orders Progress, Late Deliveries, Deliveries Warehouse and impress your audience. This template can be altered and modified as per your expectations. So, grab it now.
This slide shows marketing KPIs dashboard for operational excellence strategy of an organization. It includes metrics such as total spending, total clicks, cost per acquisition, and campaigns. Showcasing this set of slides titled Marketing Business Operational Excellence Plan KPI Dashboard Ppt Icon Design Ideas PDF. The topics addressed in these templates are Daily Impressions, Acquisitions Campaign. All the content presented in this PPT design is completely editable. Download it and make adjustments in color, background, font etc. as per your unique business setting.


The following slide showcases the business operations KPI to illustrate the performance of the organization. The KPIs include YOY growth, repeat clients revenue, survey completion growth, client growth, and incentives earned. Deliver and pitch your topic in the best possible manner with this Pureprofile Business Overview Operational Kpis Ppt Summary Introduction PDF. Use them to share invaluable insights on Average Client Tenure, Panel Acquisition Growth, SaaS Clients Growth and impress your audience. This template can be altered and modified as per your expectations. So, grab it now.


Showcasing this set of slides titled Transformation KPI Dashboard With Relevant Operational Information Portrait PDF. The topics addressed in these templates are Investment, Budget, Innovators. All the content presented in this PPT design is completely editable. Download it and make adjustments in color, background, font etc. as per your unique business setting.
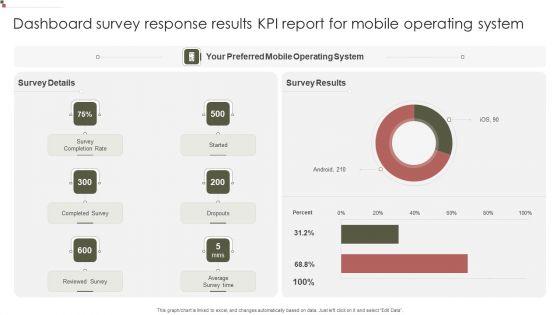
Showcasing this set of slides titled Dashboard Survey Response Results KPI Report For Mobile Operating System Designs PDF. The topics addressed in these templates are Operating System, Survey Results, Completed Survey. All the content presented in this PPT design is completely editable. Download it and make adjustments in color, background, font etc. as per your unique business setting.


The following slide highlights dashboard of shipment transportation with operating cost illustrating transportation operating cost, monthly order completion rate, operating cost distribution, order completion trend, transportation by destination and transportation efficiency. Showcasing this set of slides titled Dashboard Of Shipment Logistics KPI With Operating Cost Ppt Styles Example Topics PDF. The topics addressed in these templates are Transportation Operating Cost, Monthly Order, Completion Rate, Operating Cost Distribution. All the content presented in this PPT design is completely editable. Download it and make adjustments in color, background, font etc. as per your unique business setting.
This slide covers sales and operations KPI dashboard to increase efficiency. It involves performance, increase in profit, target, monthly profit and quarterly revenue trend. Pitch your topic with ease and precision using this Marketing And Operation KPI Dashboard To Increase Efficiency Icons PDF. This layout presents information on Profit By Monthly, Target, Performance. It is also available for immediate download and adjustment. So, changes can be made in the color, design, graphics or any other component to create a unique layout.
Mentioned slide portrays KPI dashboard that can be used by organizations to measure their business performance post AI introduction. KPIS covered here are progress, Before versus After AI Implementation, risks issues.Deliver an awe inspiring pitch with this creative Artificial Intelligence For IT Operations Playbook KPI Dashboard For Tracking Business Performance Slides PDF bundle. Topics like Kpi Dashboard, Tracking Business, Performance can be discussed with this completely editable template. It is available for immediate download depending on the needs and requirements of the user.


This slide focuses on key performance indicators to track transportation management system performance which includes freight cost for each unit shipped, outbound and inbound freight costs, etc.Deliver and pitch your topic in the best possible manner with this Developing Excellence In Logistics Operations Kpis To Track Transportation Management System Performance Clipart PDF Use them to share invaluable insights on Inbound Freight, Transportation Time, Freight Billing and impress your audience. This template can be altered and modified as per your expectations. So, grab it now.


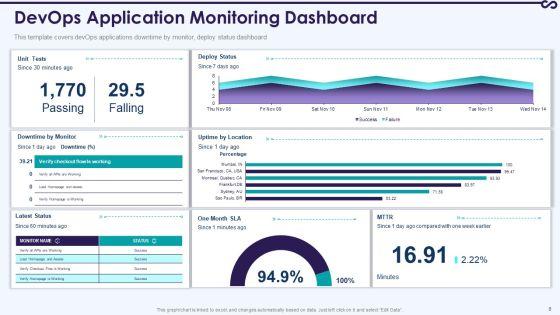
This slide covers about backend errors, anomalies, traffic volume with production errors on hourly basis due as expected.Pitch your topic with ease and precision using this Development And Operations KPI Dashboard With Traffic Volume Professional PDF This layout presents information on Anomalies, Traffics Volume, Production Errors It is also available for immediate download and adjustment. So, changes can be made in the color, design, graphics or any other component to create a unique layout.


This slide covers about devops project details with build summary, static analysis , test execution results and quality check on daily basis.Showcasing this set of slides titled Development And Operations KPI Dashboard With Total Builds Ideas PDF The topics addressed in these templates are Member Assignments, Code Repository, Quality Health All the content presented in this PPT design is completely editable. Download it and make adjustments in color, background, font etc. as per your unique business setting.


This slide template covers about devops dashboard key performing indicators with work items assigned details , work status and resource availability.Pitch your topic with ease and precision using this Development And Operations KPI Dashboard With Test Cast Status Graphics PDF This layout presents information on Items Requirement, Requirement Base, Assigned It is also available for immediate download and adjustment. So, changes can be made in the color, design, graphics or any other component to create a unique layout.


This template covers about total number of deployments with success ratio. Further, this slide includes average duration time and total breakdown due to errors in whole year.Showcasing this set of slides titled Development And Operations KPI Dashboard With Successful Deployments Inspiration PDF The topics addressed in these templates are Environment Deployments, Average Deployment, Breakdown Deployments All the content presented in this PPT design is completely editable. Download it and make adjustments in color, background, font etc. as per your unique business setting.


This slide covers about devops operational activities with performance metrics which includes input output operations and writing operations. Further it includes about central processing units operational efficiency.Pitch your topic with ease and precision using this Development And Operations KPI Dashboard With Operational Optimization Pictures PDF This layout presents information on Output Operations, Central Processing, Total Operations It is also available for immediate download and adjustment. So, changes can be made in the color, design, graphics or any other component to create a unique layout.


This slide covers about devops dashboard recording deployment status on daily basis with regional uptime according service level agreement.Showcasing this set of slides titled Development And Operations KPI Dashboard With Deployment Status And Uptime Structure PDF The topics addressed in these templates are Development Operations, Kpi Dashboard, Deployment Uptime All the content presented in this PPT design is completely editable. Download it and make adjustments in color, background, font etc. as per your unique business setting.


This slide covers about total changes submission on yearly basis with average time of devops changes with approval rate and awaiting time for change.Pitch your topic with ease and precision using this Development And Operations KPI Dashboard With Change Management Elements PDF This layout presents information on Awaiting Approval, Change Approval, Total Changes It is also available for immediate download and adjustment. So, changes can be made in the color, design, graphics or any other component to create a unique layout.
This slide covers devops KPI metrics dashboard with central processing unit statistics about input output statistics , network traffic volume under during recorded sessions. Further, this template includes numbers of sessions with waiting time.Showcasing this set of slides titled Development And Operations KPI Dashboard With Central Processing Unit Statistics Icons PDF The topics addressed in these templates are Central Processing, Output Statistics, Resource Limits All the content presented in this PPT design is completely editable. Download it and make adjustments in color, background, font etc. as per your unique business setting.


This slide covers devops KPI metrics dashboard with application activities which includes error code count, revenue by hour and average response time through application.Pitch your topic with ease and precision using this Development And Operations KPI Dashboard With Application Activities Information PDF This layout presents information on Development Operations Kpi Dashboard, Application Activities It is also available for immediate download and adjustment. So, changes can be made in the color, design, graphics or any other component to create a unique layout.


This slide template covers about determining email and voice bugs during production line. Further, it covers about active bugs on weekly basis.Showcasing this set of slides titled Development And Operations KPI Dashboard For Determining Active Bugs Portrait PDF The topics addressed in these templates are Development Operations, Dashboard Determining, Active Bugs All the content presented in this PPT design is completely editable. Download it and make adjustments in color, background, font etc. as per your unique business setting.


This slide presents the predictive maintenance dashboard such as normal, warning and critical engines with total engine status, optimal condition, monitor changes, requires immediate maintenance , etc. with predicted charts. Pitch your topic with ease and precision using this Predictive Maintenance KPI Dashboard With Total Engines In Operations Ppt Professional Inspiration PDF. This layout presents information on Total Engine Status, Optimal Condition Monitor, Changes Warning Engines, Required Immediate Maintenance. It is also available for immediate download and adjustment. So, changes can be made in the color, design, graphics or any other component to create a unique layout.


This slide focuses on dashboard to digitize production planning which includes order status, current status, advance warning, last backup, maintenance summary, invalid order with pending notifications, orders and redbox. Showcasing this set of slides titled Maintenance KPI Dashboard For Monitoring And Reporting Operations Ppt Model Guide PDF. The topics addressed in these templates are Maintenance Order Status, Dashboard Maintenance Notifications, Maintenance Order Status. All the content presented in this PPT design is completely editable. Download it and make adjustments in color, background, font etc. as per your unique business setting.


Purpose of the following slide is to show the KPIs or key performance indicators for measuring the progress of operational strategy. These KPIs can be customer satisfaction rate, net promoter score, Downtime etc. This is a Six Sigma Continuous Process Kpis To Measure The Growth Of Operational Strategy Rules PDF template with various stages. Focus and dispense information on four stages using this creative set, that comes with editable features. It contains large content boxes to add your information on topics like Customer KPIs, Employee KPIs, Production KPIs. You can also showcase facts, figures, and other relevant content using this PPT layout. Grab it now.


This is a Playbook For Improving Production Process Kpis To Measure The Growth Of Operational Strategy Summary PDF template with various stages. Focus and dispense information on four stages using this creative set, that comes with editable features. It contains large content boxes to add your information on topics like Customer KPIs, Employee KPIs, Production KPIs. You can also showcase facts, figures, and other relevant content using this PPT layout. Grab it now.


Purpose of the following slide is to show the KPIs or key performance indicators for measuring the progress of operational strategy. These KPIs can be customer satisfaction rate, net promoter score, Downtime etc. This is a Continuous Enhancement Strategy Kpis To Measure The Growth Of Operational Strategy Inspiration PDF template with various stages. Focus and dispense information on four stages using this creative set, that comes with editable features. It contains large content boxes to add your information on topics like Customer KPIs, Employee KPIs, Production KPIs, Customer Satisfaction rate. You can also showcase facts, figures, and other relevant content using this PPT layout. Grab it now.


Purpose of the following slide is to show the KPIs or key performance indicators for measuring the progress of operational strategy. These KPIs can be customer satisfaction rate, net promoter score, Downtime etc.This is a kpis to measure the growth of operational strategy information pdf template with various stages. Focus and dispense information on four stages using this creative set, that comes with editable features. It contains large content boxes to add your information on topics like unnecessary transportation, producing excessive, multiple products. You can also showcase facts, figures, and other relevant content using this PPT layout. Grab it now.


This slide shows software development project management dashboard. KPIs covered in the dashboard are status of planning, design, development, testing project launch date, project budget, overdue tasks, workload and upcoming deadlines. Deliver an awe inspiring pitch with this creative developer operations automated tools and initiatives it kpi dashboard for monitoring demonstration pdf bundle. Topics like kpi dashboard for monitoring software development can be discussed with this completely editable template. It is available for immediate download depending on the needs and requirements of the user.


This slide shows software development project management dashboard. KPIs covered in the dashboard are status of planning, design, development, testing project launch date, project budget, overdue tasks, workload and upcoming deadlines. Deliver and pitch your topic in the best possible manner with this implementing development and operations platforms for in time product launch it kpi dashboard for monitoring elements pdf. Use them to share invaluable insights on development, design, development, planning and impress your audience. This template can be altered and modified as per your expectations. So, grab it now.


This template covers DevOps global performance metrics such as deployment frequency trends, change failure trends and time to resolve trends etc. Deliver an awe inspiring pitch with this creative development and operations kpi dashboard it global devops performance metrics themes pdf bundle. Topics like global devops performance metrics can be discussed with this completely editable template. It is available for immediate download depending on the needs and requirements of the user.


This template covers DevOps website review dashboard including app upstreaming KPIs and appendix summary etc. Deliver and pitch your topic in the best possible manner with this development and operations kpi dashboard it devops website dashboard clipart pdf. Use them to share invaluable insights on devops website dashboard and impress your audience. This template can be altered and modified as per your expectations. So, grab it now.


This template covers DevOps dashboard for sprint management covering planned vs completed work items, active bugs by severity etc. Deliver an awe inspiring pitch with this creative development and operations kpi dashboard it devops sprint management dashboard portrait pdf bundle. Topics like devops sprint management dashboard can be discussed with this completely editable template. It is available for immediate download depending on the needs and requirements of the user.


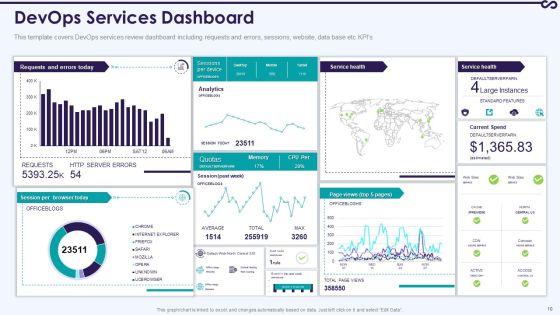
This template covers DevOps services review dashboard including requests and errors, sessions, website, data base etc KPIs. Deliver and pitch your topic in the best possible manner with this development and operations kpi dashboard it devops services dashboard infographics pdf. Use them to share invaluable insights on devops services dashboard and impress your audience. This template can be altered and modified as per your expectations. So, grab it now.
This template covers DevOps assessment key performance indicators such as activity by application, storefront users, revenue by hours etc. Deliver an awe inspiring pitch with this creative development and operations kpi dashboard it devops performance kpi dashboard icons pdf bundle. Topics like revenue, service can be discussed with this completely editable template. It is available for immediate download depending on the needs and requirements of the user.
Introducing our well designed icons slide for development and operations kpi dashboard it clipart pdf set of slides. The slide displays editable icons to enhance your visual presentation. The icons can be edited easily. So customize according to your business to achieve a creative edge. Download and share it with your audience.


This is a development and operations kpi dashboard it timeline diagrams pdf template with various stages. Focus and dispense information on five stages using this creative set, that comes with editable features. It contains large content boxes to add your information on topics like timeline, 2016 to 2021. You can also showcase facts, figures, and other relevant content using this PPT layout. Grab it now.


Presenting development and operations kpi dashboard it post it notes inspiration pdf to provide visual cues and insights. Share and navigate important information on four stages that need your due attention. This template can be used to pitch topics like post it notes. In addtion, this PPT design contains high resolution images, graphics, etc, that are easily editable and available for immediate download.


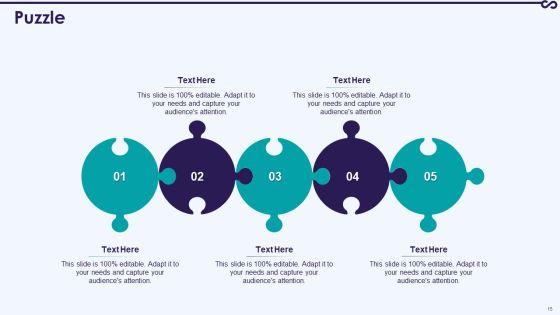
This is a development and operations kpi dashboard it circular diagram graphics pdf template with various stages. Focus and dispense information on seven stages using this creative set, that comes with editable features. It contains large content boxes to add your information on topics like circular diagram. You can also showcase facts, figures, and other relevant content using this PPT layout. Grab it now.
SHOW
- 60
- 120
- 180
DISPLAYING: 60 of 126 Item(s)
Page