- Sign up
- Sign In
 AI PPT Maker
 Templates
 PPT Bundles
 Design Services
 Business PPTs
 Business Plan
 Management
 Strategy
 Introduction PPT
 Roadmap
 Self Introduction
 Timelines
 Process
 Marketing
 Agenda
 Technology
 Medical
 Startup Business Plan
 Cyber Security
 Dashboards
 SWOT
SWOT Proposals
 Education
 Pitch Deck
 Digital Marketing
 KPIs
KPIs Project Management
 Product Management
 Artificial Intelligence
 Target Market
 Communication
 Supply Chain
 Google Slides
 Research Services
 One Pagers
 All Categories
Operational dashboard PowerPoint Presentation Templates and Google Slides
SHOW
- 60
- 120
- 180
DISPLAYING: 60 of 332 Item(s)
Page


Induce strategic thinking by presenting this complete deck. Enthrall your audience by deploying this thought provoking PPT deck. It can be downloaded in both standard and widescreen aspect ratios, thus making it a complete package to use and deploy. Convey your thoughts and actions using the twenty two slides presented in this complete deck. Additionally, feel free to alter its components like color, graphics, design, etc, to create a great first impression. Grab it now by clicking on the download button below.


Improve your presentation delivery using this Marketing And Operations Dashboard Ppt PowerPoint Presentation Complete With Slides. Support your business vision and objectives using this well-structured PPT deck. This template offers a great starting point for delivering beautifully designed presentations on the topic of your choice. Comprising tweleve this professionally designed template is all you need to host discussion and meetings with collaborators. Each slide is self-explanatory and equipped with high-quality graphics that can be adjusted to your needs. Therefore, you will face no difficulty in portraying your desired content using this PPT slideshow. This PowerPoint slideshow contains every important element that you need for a great pitch. It is not only editable but also available for immediate download and utilization. The color, font size, background, shapes everything can be modified to create your unique presentation layout. Therefore, download it now.


If designing a presentation takes a lot of your time and resources and you are looking for a better alternative, then this Development And Operations KPI Dashboard Ppt PowerPoint Presentation Complete Deck With Slides is the right fit for you. This is a prefabricated set that can help you deliver a great presentation on the topic. All the twelve slides included in this sample template can be used to present a birds-eye view of the topic. These slides are also fully editable, giving you enough freedom to add specific details to make this layout more suited to your business setting. Apart from the content, all other elements like color, design, theme are also replaceable and editable. This helps in designing a variety of presentations with a single layout. Not only this, you can use this PPT design in formats like PDF, PNG, and JPG once downloaded. Therefore, without any further ado, download and utilize this sample presentation as per your liking.


This slide highlights the workplace safety dashboard which showcase incidents per employee, worksite incident total, incidents by total and top injuries by body part. Do you know about Slidesgeeks Deploying Safe Operating Procedures In The Organization Workplace Safety Dashboard To Monitor Incidents Professional PDF. These are perfect for delivering any kind od presentation. Using it, create PowerPoint presentations that communicate your ideas and engage audiences. Save time and effort by using our pre designed presentation templates that are perfect for a wide range of topic. Our vast selection of designs covers a range of styles, from creative to business, and are all highly customizable and easy to edit. Download as a PowerPoint template or use them as Google Slides themes.


This slide highlights the dashboard which showcase the critical incidents, incident cost, injury consequence, type of incident and severity level of the injury. Take your projects to the next level with our ultimate collection of Deploying Safe Operating Procedures In The Organization Workplace Safety Dashboard Highlighting Injury Professional PDF. Slidegeeks has designed a range of layouts that are perfect for representing task or activity duration, keeping track of all your deadlines at a glance. Tailor these designs to your exact needs and give them a truly corporate look with your own brand colors they will make your projects stand out from the rest.


This slide showcases dashboard that can help organization to manage and track the warehouse operations. Its key elements are order, volume, inventory, monthly KPIs and global financial performance. Here you can discover an assortment of the finest PowerPoint and Google Slides templates. With these templates, you can create presentations for a variety of purposes while simultaneously providing your audience with an eye catching visual experience. Download Dashboard For Managing Warehouse Operations Mockup PDF to deliver an impeccable presentation. These templates will make your job of preparing presentations much quicker, yet still, maintain a high level of quality. Slidegeeks has experienced researchers who prepare these templates and write high quality content for you. Later on, you can personalize the content by editing the Dashboard For Managing Warehouse Operations Mockup PDF.


This slide portrays key performance dashboard for measuring retail business performance. KPIs covered in the dashboards are average shopping time, shop visitors, average basket spend and customer retention. Are you in need of a template that can accommodate all of your creative concepts This one is crafted professionally and can be altered to fit any style. Use it with Google Slides or PowerPoint. Include striking photographs, symbols, depictions, and other visuals. Fill, move around, or remove text boxes as desired. Test out color palettes and font mixtures. Edit and save your work, or work with colleagues. Download Retail Business Operation Management To Optimize Customer Experience KPI Dashboard For Retail Business Download PDF and observe how to make your presentation outstanding. Give an impeccable presentation to your group and make your presentation unforgettable.


Mentioned slide illustrates customer satisfaction dashboard. It includes information about net promoter score, customer retention rate and customer effort score. Present like a pro with Retail Business Operation Management To Optimize Customer Experience Dashboard Measuring Customer Infographics PDF Create beautiful presentations together with your team, using our easy to use presentation slides. Share your ideas in real time and make changes on the fly by downloading our templates. So whether you are in the office, on the go, or in a remote location, you can stay in sync with your team and present your ideas with confidence. With Slidegeeks presentation got a whole lot easier. Grab these presentations today.


This slide showcases analytics to track everyday tickets solved and escalated to ensure its timely completion of business operations. It further includes details about first response and full resolution time. Pitch your topic with ease and precision using this Dashboard For Daily Operational Progress Summary With Tickets Resolved Background PDF. This layout presents information on Dashboard For Daily Operational, Progress Summary, Tickets Resolved. It is also available for immediate download and adjustment. So, changes can be made in the color, design, graphics or any other component to create a unique layout.


This slide showcases business intelligence dashboard to track various aspects of IT functions, security issues and technology costs. It further includes metrics such as applications by spend, clusters, cloud accounts, cost, efficiency score, etc. Showcasing this set of slides titled Business Intelligence Dashboard For It Operations In Organization Themes PDF. The topics addressed in these templates are Business Intelligence Dashboard, IT Operations, Organization. All the content presented in this PPT design is completely editable. Download it and make adjustments in color, background, font etc. as per your unique business setting.


This slide presents a dashboard to analyze and monitor business operational activities and gain insights of functional performance. It includes key components such as revenue, sigh ups, visitors, revenue by source, monthly sign ups, top performing agents, etc. Showcasing this set of slides titled Business Operations Performance Assessment Dashboard Information PDF. The topics addressed in these templates are Source, Monthly, Agents. All the content presented in this PPT design is completely editable. Download it and make adjustments in color, background, font etc. as per your unique business setting.


This slide showcases manufacturing dashboard to track KPIs defined under lean and kaizen process improvement plans. Key performance metrics included here are TEEP, OEE, loading time, production quality, losses by hours, losses by categories etc. Pitch your topic with ease and precision using this Lean Operational Excellence Strategy Manufacturing Dashboard To Check Production System Efficiency Pictures PDF. This layout presents information on Loading, Availability, Performance. It is also available for immediate download and adjustment. So, changes can be made in the color, design, graphics or any other component to create a unique layout.
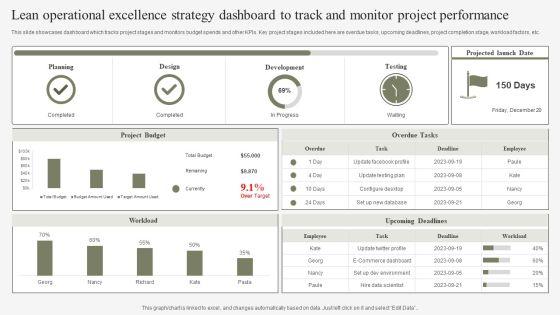
This slide showcases dashboard which tracks project stages and monitors budget spends and other KPIs. Key project stages included here are overdue tasks, upcoming deadlines, project completion stage, workload factors, etc. Pitch your topic with ease and precision using this Lean Operational Excellence Strategy Dashboard To Track And Monitor Project Performance Slides PDF. This layout presents information on Planning, Design, Development. It is also available for immediate download and adjustment. So, changes can be made in the color, design, graphics or any other component to create a unique layout.


This slide depicts a dashboard that will be used by managers to monitor the global footprint of supply chain operations. Major key performance indicators include total global emissions, time frame, allocation, electricity, etc. Showcasing this set of slides titled Dashboard To Monitor International Footprint Of Supply Chain Operations Brochure PDF. The topics addressed in these templates are Electricity, Footprint Emissions, Allocation. All the content presented in this PPT design is completely editable. Download it and make adjustments in color, background, font etc. as per your unique business setting.


This slide portrays key performance dashboard for measuring retail business performance. KPIs covered in the dashboards are average shopping time, shop visitors, average basket spend and customer retention. Boost your pitch with our creative Retail Business Optimization Through Operational Excellence Strategy KPI Dashboard For Retail Business Mockup PDF. Deliver an awe-inspiring pitch that will mesmerize everyone. Using these presentation templates you will surely catch everyones attention. You can browse the ppts collection on our website. We have researchers who are experts at creating the right content for the templates. So you do not have to invest time in any additional work. Just grab the template now and use them.


Mentioned slide illustrates customer satisfaction dashboard. It includes information about net promoter score, customer retention rate and customer effort score. Present like a pro with Retail Business Optimization Through Operational Excellence Strategy Dashboard Measuring Customer Template PDF Create beautiful presentations together with your team, using our easy to use presentation slides. Share your ideas in real time and make changes on the fly by downloading our templates. So whether you are in the office, on the go, or in a remote location, you can stay in sync with your team and present your ideas with confidence. With Slidegeeks presentation got a whole lot easier. Grab these presentations today.
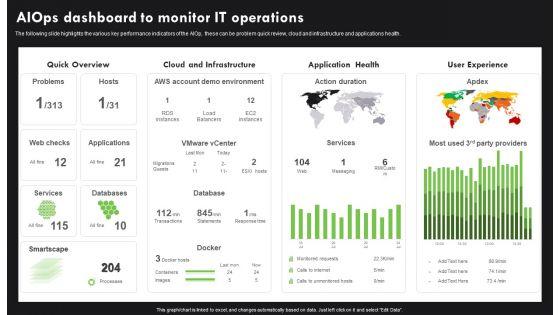

The following slide highlights the various key performance indicators of the AIOp, these can be problem quick review, cloud and infrastructure and applications health. If you are looking for a format to display your unique thoughts, then the professionally designed AI Deployment In IT Process Aiops Dashboard To Monitor IT Operations Infographics PDF is the one for you. You can use it as a Google Slides template or a PowerPoint template. Incorporate impressive visuals, symbols, images, and other charts. Modify or reorganize the text boxes as you desire. Experiment with shade schemes and font pairings. Alter, share or cooperate with other people on your work. Download AI Deployment In IT Process Aiops Dashboard To Monitor IT Operations Infographics PDF and find out how to give a successful presentation. Present a perfect display to your team and make your presentation unforgettable.


This slide highlights the banking operation strategy dashboard which showcases current account and saving account growth rate, savings account deposits, current account deposits and retail term deposits. Here you can discover an assortment of the finest PowerPoint and Google Slides templates. With these templates, you can create presentations for a variety of purposes while simultaneously providing your audience with an eye catching visual experience. Download Banking Operation Strategy Dashboard Highlighting Deposits And Growth Rate Structure PDF to deliver an impeccable presentation. These templates will make your job of preparing presentations much quicker, yet still, maintain a high level of quality. Slidegeeks has experienced researchers who prepare these templates and write high quality content for you. Later on, you can personalize the content by editing the Banking Operation Strategy Dashboard Highlighting Deposits And Growth Rate Structure PDF.


This slide highlights the banking operation strategy which includes accounts opened and closed, total deposit vs branch goal, accounts by type, expense to budget and referrals by product. Presenting this PowerPoint presentation, titled Banking Operation Strategy Dashboard Highlighting Accounts And Product Referrals Elements PDF, with topics curated by our researchers after extensive research. This editable presentation is available for immediate download and provides attractive features when used. Download now and captivate your audience. Presenting this Banking Operation Strategy Dashboard Highlighting Accounts And Product Referrals Elements PDF. Our researchers have carefully researched and created these slides with all aspects taken into consideration. This is a completely customizable Banking Operation Strategy Dashboard Highlighting Accounts And Product Referrals Elements PDF that is available for immediate downloading. Download now and make an impact on your audience. Highlight the attractive features available with our PPTs.


Following slide demonstrates KPI dashboard to monitor performance of sales executives to determine best performing employee. It includes key components such as monthly performance, targets achieved, sales by executives, lead funnel, total daily and monthly profits. Pitch your topic with ease and precision using this KPI Dashboard To Monitor Operational Sales Executive Performance Portrait PDF. This layout presents information on Revenue, Profit, Sales, Customers. It is also available for immediate download and adjustment. So, changes can be made in the color, design, graphics or any other component to create a unique layout.


The following slide highlights the various key performance indicators of the AIOps, these can be problem quick review, cloud and infrastructure and applications health If you are looking for a format to display your unique thoughts, then the professionally designed Operational Strategy For ML In IT Sector Aiops Dashboard To Monitor IT Operations Diagrams PDF is the one for you. You can use it as a Google Slides template or a PowerPoint template. Incorporate impressive visuals, symbols, images, and other charts. Modify or reorganize the text boxes as you desire. Experiment with shade schemes and font pairings. Alter, share or cooperate with other people on your work. Download Operational Strategy For ML In IT Sector Aiops Dashboard To Monitor IT Operations Diagrams PDF and find out how to give a successful presentation. Present a perfect display to your team and make your presentation unforgettable.


This slide depicts the predictive analytics dashboard to track manufacturing operations, including production volume, order volume, active machines, sales revenue, top five products, downtime causes, production volume by top five machines, and so on. If you are looking for a format to display your unique thoughts, then the professionally designed Intelligent Manufacturing Predictive Analytics Dashboard To Track Manufacturing Operations Information PDF is the one for you. You can use it as a Google Slides template or a PowerPoint template. Incorporate impressive visuals, symbols, images, and other charts. Modify or reorganize the text boxes as you desire. Experiment with shade schemes and font pairings. Alter, share or cooperate with other people on your work. Download Intelligent Manufacturing Predictive Analytics Dashboard To Track Manufacturing Operations Information PDF and find out how to give a successful presentation. Present a perfect display to your team and make your presentation unforgettable.


The following slide highlights the various key performance indicators of the AIOp, these can be problem quick review, cloud and infrastructure and applications health. If you are looking for a format to display your unique thoughts, then the professionally designed Information Technology Operations Administration With ML Aiops Dashboard To Monitor Diagrams PDF is the one for you. You can use it as a Google Slides template or a PowerPoint template. Incorporate impressive visuals, symbols, images, and other charts. Modify or reorganize the text boxes as you desire. Experiment with shade schemes and font pairings. Alter, share or cooperate with other people on your work. Download Information Technology Operations Administration With ML Aiops Dashboard To Monitor Diagrams PDF and find out how to give a successful presentation. Present a perfect display to your team and make your presentation unforgettable.


This slide shows the financial statement analysis dashboard of organization. It covers various KPIs such as OPEX Ratio, operating profit margin, gross profit margin, net profit margin, etc. Pitch your topic with ease and precision using this Financial Position Evaluation Dashboard With Operating Profit Margin Elements PDF. This layout presents information on Income Statement, Revenue, Operating Profit, Net Profit. It is also available for immediate download and adjustment. So, changes can be made in the color, design, graphics or any other component to create a unique layout.


This slide showcases dashboard that can help organization to track operating cost incurred by organization in different warehousing activities. Its other key elements are - perfect order rate, total shipments by country and on time shipments. Take your projects to the next level with our ultimate collection of Strategic Guidelines To Administer Dashboard To Track Warehouse Shipments And Operating Sample PDF. Slidegeeks has designed a range of layouts that are perfect for representing task or activity duration, keeping track of all your deadlines at a glance. Tailor these designs to your exact needs and give them a truly corporate look with your own brand colors theyll make your projects stand out from the rest.


This slide illustrates graphical representation of statistical data of sales operation. It includes sales pipeline, closed operations, open operations, operations by closing date etc. Pitch your topic with ease and precision using this Customer Relationship Management Dashboard With Industry Operations Data Statistics Pictures PDF. This layout presents information on Sales Pipeline, Insurance, Telecommunic. It is also available for immediate download and adjustment. So, changes can be made in the color, design, graphics or any other component to create a unique layout.


Following slide depicts a dashboard which can be used by supplier to get a centralized, real-time view of key metrics and data points related to the logistics performance. Key performance metrics are related to due receipts, number of products received,items in transit, items due for pickup etc. Pitch your topic with ease and precision using this Dashboard To Monitor Logistics Chains Warehouse Operations Diagrams PDF. This layout presents information on Product Status, Pickup List Status, Best Selling Products. It is also available for immediate download and adjustment. So, changes can be made in the color, design, graphics or any other component to create a unique layout.


The following slide highlights the various key performance indicators of the AIOp, these can be problem quick review, cloud and infrastructure and applications health. If you are looking for a format to display your unique thoughts, then the professionally designed Aiops Dashboard To Monitor IT Operations Aiops Integration Summary Report Clipart PDF is the one for you. You can use it as a Google Slides template or a PowerPoint template. Incorporate impressive visuals, symbols, images, and other charts. Modify or reorganize the text boxes as you desire. Experiment with shade schemes and font pairings. Alter, share or cooperate with other people on your work. Download Aiops Dashboard To Monitor IT Operations Aiops Integration Summary Report Clipart PDF and find out how to give a successful presentation. Present a perfect display to your team and make your presentation unforgettable.


This slide covers dashboard of IT operations to monitor the issues in the central database. It enables team members to identify, implement, and track solutions. The key Elements are issue type, issue category, Issue status. Showcasing this set of slides titled It Operation Management Dashboard For Immediate Response Demonstration PDF. The topics addressed in these templates are Support Status, Immediate Response, Time To Resolve. All the content presented in this PPT design is completely editable. Download it and make adjustments in color, background, font etc. as per your unique business setting.
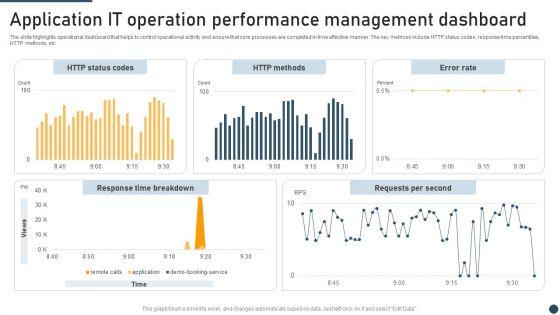

The slide highlights operational dashboard that helps to control operational activity and ensure that core processes are completed in time effective manner. The key metrices include HTTP status codes, response time percentiles, HTTP methods, etc. Showcasing this set of slides titled Application It Operation Performance Management Dashboard Themes PDF. The topics addressed in these templates are HTTP Status Codes, HTTP Methods, Error Rate. All the content presented in this PPT design is completely editable. Download it and make adjustments in color, background, font etc. as per your unique business setting.


Mentioned slide illustrates warehouse operations dashboard with key performance indicators KPIs. KPIs included are operating cost, order rate, total shipment by country and on-time shipment.Presenting this PowerPoint presentation, titled Kpi Dashboard For Monitoring Warehouse Operations Stand Out Digital Supply Chain Tactics Enhancing Information PDF, with topics curated by our researchers after extensive research. This editable presentation is available for immediate download and provides attractive features when used. Download now and captivate your audience. Presenting this Kpi Dashboard For Monitoring Warehouse Operations Stand Out Digital Supply Chain Tactics Enhancing Information PDF. Our researchers have carefully researched and created these slides with all aspects taken into consideration. This is a completely customizable Kpi Dashboard For Monitoring Warehouse Operations Stand Out Digital Supply Chain Tactics Enhancing Information PDF that is available for immediate downloading. Download now and make an impact on your audience. Highlight the attractive features available with our PPTs.


This slide illustrates dashboard showcasing customer relationship management ticketing tool operations. It provides information about satisfaction, new tickets, chats, calls, invoicing, tech support, sales, engineers, replies, etc. Want to ace your presentation in front of a live audience Our Implementing Advanced Service Help Desk Administration Program Dashboard Highlighting CRM Ticketing Tool Operations Mockup PDF can help you do that by engaging all the users towards you.. Slidegeeks experts have put their efforts and expertise into creating these impeccable powerpoint presentations so that you can communicate your ideas clearly. Moreover, all the templates are customizable, and easy-to-edit and downloadable. Use these for both personal and commercial use.
This slide represents dashboard representing the key metrics of operational risk management. It includes KPIs such as operational risk by rating, by month, operational risk list etc. The Operational Risk Assessment And Management Plan Operational Risk Management Key Metrics Dashboard Icons PDF is a compilation of the most recent design trends as a series of slides. It is suitable for any subject or industry presentation, containing attractive visuals and photo spots for businesses to clearly express their messages. This template contains a variety of slides for the user to input data, such as structures to contrast two elements, bullet points, and slides for written information. Slidegeeks is prepared to create an impression.
Operational Risk Assessment And Management Plan Enterprise Cyber Risk Management Dashboard Icons PDF
This slide represents dashboard representing details related to management of strategic risks in the organization. It includes details related to risk rating breakdown, risk heat map, top 5 vulnerabilities etc. Slidegeeks is here to make your presentations a breeze with Operational Risk Assessment And Management Plan Enterprise Cyber Risk Management Dashboard Icons PDF With our easy-to-use and customizable templates, you can focus on delivering your ideas rather than worrying about formatting. With a variety of designs to choose from, you are sure to find one that suits your needs. And with animations and unique photos, illustrations, and fonts, you can make your presentation pop. So whether you are giving a sales pitch or presenting to the board, make sure to check out Slidegeeks first.


This slide represents the key metrics dashboard representing the management of credit risks by the organization. It includes details related to key risk indicators, exposure by credit rating, sectors etc. Present like a pro with Operational Risk Assessment And Management Plan Credit Risk Management KPI Dashboard Guidelines PDF Create beautiful presentations together with your team, using our easy-to-use presentation slides. Share your ideas in real-time and make changes on the fly by downloading our templates. So whether you are in the office, on the go, or in a remote location, you can stay in sync with your team and present your ideas with confidence. With Slidegeeks presentation got a whole lot easier. Grab these presentations today.
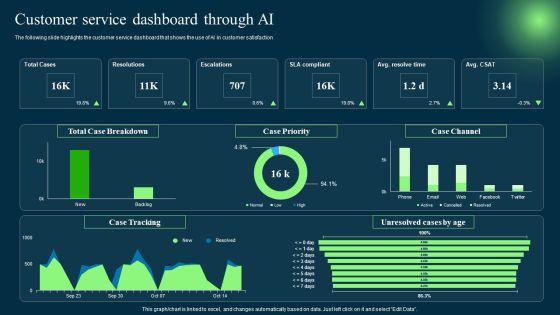

The following slide highlights the customer service dashboard that shows the use of AI in customer satisfaction. Slidegeeks is here to make your presentations a breeze with Introduction To Artificial Intelligence In Operation Management Industry Customer Service Dashboard Through AI Topics PDF With our easy-to-use and customizable templates, you can focus on delivering your ideas rather than worrying about formatting. With a variety of designs to choose from, you are sure to find one that suits your needs. And with animations and unique photos, illustrations, and fonts, you can make your presentation pop. So whether you are giving a sales pitch or presenting to the board, make sure to check out Slidegeeks first.
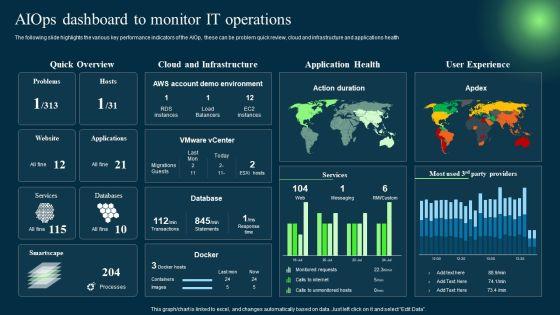
The following slide highlights the various key performance indicators of the AIOp, these can be problem quick review, cloud and infrastructure and applications health. Create an editable Introduction To Artificial Intelligence In Operation Management Industry Aiops Dashboard To Monitor IT Operations Clipart PDF that communicates your idea and engages your audience. Whether you are presenting a business or an educational presentation, pre-designed presentation templates help save time. Introduction To Artificial Intelligence In Operation Management Industry Aiops Dashboard To Monitor IT Operations Clipart PDF is highly customizable and very easy to edit, covering many different styles from creative to business presentations. Slidegeeks has creative team members who have crafted amazing templates. So, go and get them without any delay.
This slide covers the dashboard for tracking vehicle efficiency after transport automation. It include KPIs such as truck turnaround time, average revenue per hour, truckload capacity, transit time, on-time pickup, and average revenue per mile. Do you have to make sure that everyone on your team knows about any specific topic I yes, then you should give Streamlining Operations With Supply Chain Automation Dashboard For Tracking Impact Of Transport Automation Demonstration PDF a try. Our experts have put a lot of knowledge and effort into creating this impeccable Streamlining Operations With Supply Chain Automation Dashboard For Tracking Impact Of Transport Automation Demonstration PDF. You can use this template for your upcoming presentations, as the slides are perfect to represent even the tiniest detail. You can download these templates from the Slidegeeks website and these are easy to edit. So grab these today.
This slide covers the dashboard for back end tracking of overall impact automation. It include KPIs such as retailer capacity, warehouse capacity, truck efficiency, time to reach warehouse, sustainability, etc. There are so many reasons you need a Streamlining Operations With Supply Chain Automation Dashboard For Tracking Impact Of Supply Chain Automation Slides PDF. The first reason is you can not spend time making everything from scratch, Thus, Slidegeeks has made presentation templates for you too. You can easily download these templates from our website easily.
This slide describes the performance tracking dashboard for 5G architecture by covering the details of subscribers, quality of experience, consumption, customer support, coverage, devices, and dimensions. Are you searching for a 5G Network Operations Performance Tracking Dashboard For 5G Architecture Demonstration PDF that is uncluttered, straightforward, and original. Its easy to edit, and you can change the colors to suit your personal or business branding. For a presentation that expresses how much effort youve put in, this template is ideal With all of its features, including tables, diagrams, statistics, and lists, its perfect for a business plan presentation. Make your ideas more appealing with these professional slides. Download 5G Network Operations Performance Tracking Dashboard For 5G Architecture Demonstration PDF from Slidegeeks today.


This slide represents HRM operations dashboard. It covers metrics such as employee turnover, headcount in each division, payroll breakdown, salary distribution etc. Pitch your topic with ease and precision using thisHuman Resource Management Operation Mertrics Dashboard Background PDF. This layout presents information on Number Of Employees, Headcount Per Division, Employees By Salary. It is also available for immediate download and adjustment. So, changes can be made in the color, design, graphics or any other component to create a unique layout.


The following slide shows business operations budget summary dashboard. It provides information about expenses, difference, transportation, insurance, refreshment, etc. Pitch your topic with ease and precision using this Company Operations Budget Assessment Dashboard Template PDF. This layout presents information on Countdown, Budget, Expense. It is also available for immediate download and adjustment. So, changes can be made in the color, design, graphics or any other component to create a unique layout.


This slide illustrates dashboard of service desk professionals for managing ticketing tool operations. It provides information about satisfaction, new tickets, chats, calls, invoicing, tech support, sales, engineers, replies, etc. Crafting an eye-catching presentation has never been more straightforward. Let your presentation shine with this tasteful yet straightforward Help Desk Ticketing Dashboard Highlighting Customer Ticketing Tool Operations Introduction PDF maining professional. Construct the ideal Help Desk Ticketing Dashboard Highlighting Customer Ticketing Tool Operations Introduction PDF that effortlessly grabs the attention of your audience Begin now and be certain to wow your customers.


The slide includes a dashboard of hotel property management system that provides information about check in guests , reservations, housekeeping and other KPIs at a glance. Pitch your topic with ease and precision using this Hotel Operations Management Software Key Metrics Dashboard Inspiration PDF. This layout presents information on Reservations, Housekeeping, Occupancy. It is also available for immediate download and adjustment. So, changes can be made in the color, design, graphics or any other component to create a unique layout.


This slide illustrates dashboard showcasing customer relationship management ticketing tool operations. It provides information about satisfaction, new tickets, chats, calls, invoicing, tech support, sales, engineers, replies, etc. Want to ace your presentation in front of a live audience Our Dashboard Highlighting CRM Ticketing Tool Operations Diagrams PDF can help you do that by engaging all the users towards you. Slidegeeks experts have put their efforts and expertise into creating these impeccable powerpoint presentations so that you can communicate your ideas clearly. Moreover, all the templates are customizable, and easy to edit and downloadable. Use these for both personal and commercial use.


This slide illustrates dashboard showcasing customer relationship management ticketing tool operations. It provides information about satisfaction, new tickets, chats, calls, invoicing, tech support, sales, engineers, replies, etc. Want to ace your presentation in front of a live audience Our Dashboard Highlighting CRM Ticketing Tool Operations Ppt PowerPoint Presentation File Professional PDF can help you do that by engaging all the users towards you. Slidegeeks experts have put their efforts and expertise into creating these impeccable powerpoint presentations so that you can communicate your ideas clearly. Moreover, all the templates are customizable, and easy to edit and downloadable. Use these for both personal and commercial use.
This slide showcases dashboard that can help organization to manage and track the warehouse operations. Its key elements are order, volume, inventory, monthly KPIs and global financial performance. Explore a selection of the finest Stock Inventory Acquisition Dashboard For Managing Warehouse Operations Icons PDF here. With a plethora of professionally designed and pre-made slide templates, you can quickly and easily find the right one for your upcoming presentation. You can use our Stock Inventory Acquisition Dashboard For Managing Warehouse Operations Icons PDF to effectively convey your message to a wider audience. Slidegeeks has done a lot of research before preparing these presentation templates. The content can be personalized and the slides are highly editable. Grab templates today from Slidegeeks.


This slide depicts a dashboard to track the key performance metrics in sales and operations process of a manufacturing enterprise to analyze deviations in the actual and planned output. The key performing indicators are percentage deviation, dollar deviation, inventory in hand etc.Pitch your topic with ease and precision using this KPI Dashboard To Track Sales And Operations Process Of Manufacturing Enterprise Brochure PDF. This layout presents information on Planned Output, Yearly Growth, Inventory Hand. It is also available for immediate download and adjustment. So, changes can be made in the color, design, graphics or any other component to create a unique layout.


This slide showcases dashboard for procurement spend analysis. It include KPIs such as parts per supplier, suppliers per month, top saving opportunities, etc. Pitch your topic with ease and precision using this Procurement Optimization Dashboard For Supply Chain Management To Enhance Logistics Operations Elements PDF. This layout presents information on Procurement Optimization Dashboard, Supply Chain Management, Enhance Logistic Operations. It is also available for immediate download and adjustment. So, changes can be made in the color, design, graphics or any other component to create a unique layout.


Logistics KPI Dashboard For Supply Chain Management To Enhance Logistics Operations Professional PDF
This slide displays the logistics dashboard for monitoring and reporting warehouse operations and transportation processes. It include KPIs such as revenue, shipments, avg delivery time, fleet status, delivery status, average loading time and weight, etc. Pitch your topic with ease and precision using this Logistics KPI Dashboard For Supply Chain Management To Enhance Logistics Operations Professional PDF. This layout presents information on Logistics KPI, Dashboard For Supply Chain, Management To Enhance, Logistics Operations. It is also available for immediate download and adjustment. So, changes can be made in the color, design, graphics or any other component to create a unique layout.
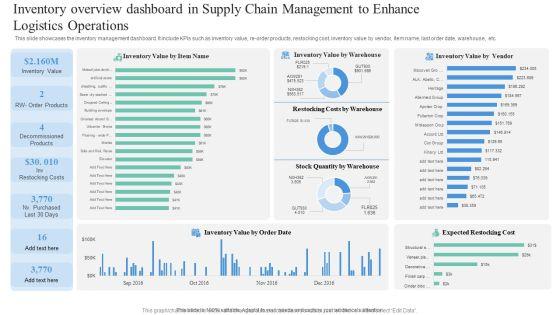

This slide showcases the inventory management dashboard. It include KPIs such as inventory value, re-order products, restocking cost, inventory value by vendor, item name, last order date, warehouse, etc. Showcasing this set of slides titled Inventory Overview Dashboard In Supply Chain Management To Enhance Logistics Operations Summary PDF. The topics addressed in these templates are Inventory Overview Dashboard, Supply Chain Management, Enhance Logistics Operations. All the content presented in this PPT design is completely editable. Download it and make adjustments in color, background, font etc. as per your unique business setting.


This slide represents the dashboard showing the operational analysis of the team project of the IT department. It shows details related to investment, billed amount, completion of project, revenue by month, total days spent on project completion, customer satisfaction etc.Showcasing this set of slides titled IT Team Project Operations Analysis Dashboard Clipart PDF. The topics addressed in these templates are Revenue Investment, Complete Each Project, Customer Satisfaction. All the content presented in this PPT design is completely editable. Download it and make adjustments in color, background, font etc. as per your unique business setting.


This slide represents the dashboard showing the operational analysis of the software development project undertaken by the IT team. It shows details related to overall progress, planning, design, development, testing, risks, budget, overdue tasks etc. related to the project.Pitch your topic with ease and precision using this IT Software Development Project Operations Analysis Dashboard Pictures PDF. This layout presents information on Interactive Dashboard, Currently Over Target, Overdue Task. It is also available for immediate download and adjustment. So, changes can be made in the color, design, graphics or any other component to create a unique layout.
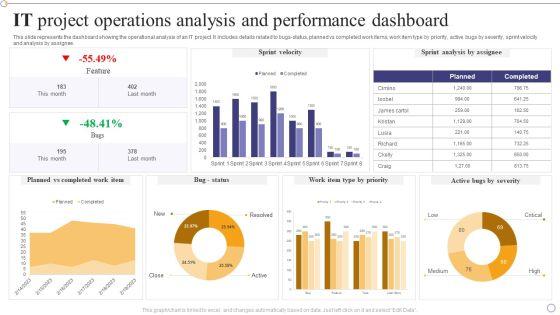

This slide represents the dashboard showing the operational analysis of an IT project. It includes details related to bugs-status, planned vs completed work items, work item type by priority, active bugs by severity, sprint velocity and analysis by assignee.Showcasing this set of slides titled IT Project Operations Analysis And Performance Dashboard Themes PDF. The topics addressed in these templates are Planned Completed, Sprint Analysis, Feature. All the content presented in this PPT design is completely editable. Download it and make adjustments in color, background, font etc. as per your unique business setting.
SHOW
- 60
- 120
- 180
DISPLAYING: 60 of 332 Item(s)
Page