 AI PPT Maker
 Templates
 PPT Bundles
 Design Services
 Business PPTs
 Business Plan
 Management
 Strategy
 Introduction PPT
 Roadmap
 Self Introduction
 Timelines
 Process
 Marketing
 Agenda
 Technology
 Medical
 Startup Business Plan
 Cyber Security
 Dashboards
 SWOT
SWOT Proposals
 Education
 Pitch Deck
 Digital Marketing
 KPIs
KPIs Project Management
 Product Management
 Artificial Intelligence
 Target Market
 Communication
 Supply Chain
 Google Slides
 Research Services
 One Pagers
 All Categories
Visualization-research PowerPoint Presentation Templates and Google Slides
SHOW
- 60
- 120
- 180
DISPLAYING: 60 of 73 Item(s)
Page


Take advantage of this well-researched and professionally-designed Branches For Visualization Research And Development Ppt PowerPoint Presentation Complete Deck With Slides to ace your next business meeting. Use this PPT complete deck to impress the management with your ideas for business growth and revenue increase. Use the fourt seven slide Template Bundle to leave no stone unturned as you present each step of your process. Employ the visual tools within the slides such as graphs, charts, and tables to ensure that the audience can never look away from the presentation. With attractive visuals, easy to understand structure, and your knowledge, your presentation will have the attention it deserves. Download this PPT Template from the link below.


Induce strategic thinking by presenting this complete deck. Enthrall your audience by deploying this thought provoking PPT deck. It can be downloaded in both standard and widescreen aspect ratios, thus making it a complete package to use and deploy. Convey your thoughts and actions using the fourty seven slides presented in this complete deck. Additionally, feel free to alter its components like color, graphics, design, etc, to create a great first impression. Grab it now by clicking on the download button below.


This is a Table Of Contents Departments Of Visualization Research Sample PDF template with various stages. Focus and dispense information on six stages using this creative set, that comes with editable features. It contains large content boxes to add your information on topics like Current Scenario Of The Company, Need For Visualization, About Visualization Research You can also showcase facts, figures, and other relevant content using this PPT layout. Grab it now.
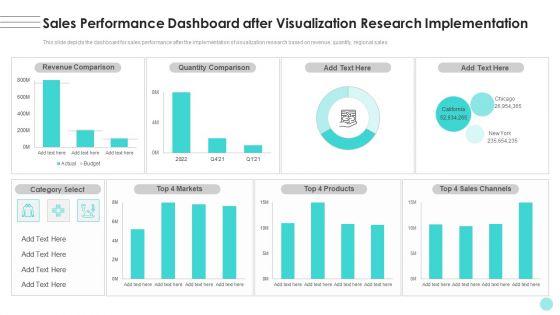

This slide depicts the dashboard for sales performance after the implementation of visualization research based on revenue, quantity, regional sales. Crafting an eye-catching presentation has never been more straightforward. Let your presentation shine with this tasteful yet straightforward Branches For Visualization Research And Development Sales Performance Dashboard After Infographics PDF template. It offers a minimalistic and classy look that is great for making a statement. The colors have been employed intelligently to add a bit of playfulness while still remaining professional. Construct the ideal Branches For Visualization Research And Development Sales Performance Dashboard After Infographics PDF that effortlessly grabs the attention of your audience Begin now and be certain to wow your customers.


This slide depicts the different issues faced by the company in a project, but the lack of data understanding is the primary concern among all. If you are looking for a format to display your unique thoughts, then the professionally designed Branches For Visualization Research And Development Lack Of Data Understanding Faced Introduction PDF is the one for you. You can use it as a Google Slides template or a PowerPoint template. Incorporate impressive visuals, symbols, images, and other charts. Modify or reorganize the text boxes as you desire. Experiment with shade schemes and font pairings. Alter, share or cooperate with other people on your work. Download Branches For Visualization Research And Development Lack Of Data Understanding Faced Introduction PDF and find out how to give a successful presentation. Present a perfect display to your team and make your presentation unforgettable.
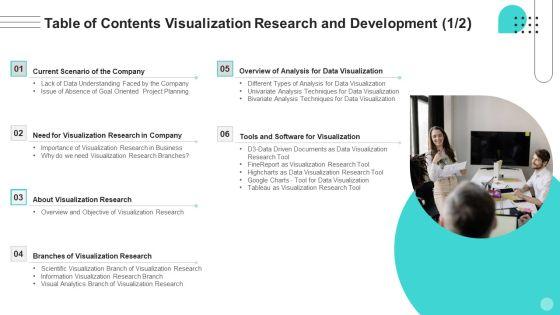
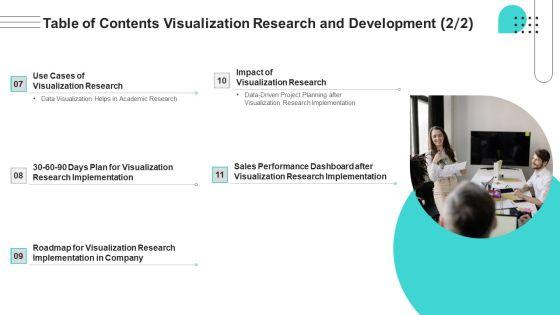
Do you know about Slidesgeeks Table Of Contents Visualization Research And Development Ppt Infographic Template Rules PDFThese are perfect for delivering any kind od presentation. Using it, create PowerPoint presentations that communicate your ideas and engage audiences. Save time and effort by using our pre-designed presentation templates that are perfect for a wide range of topic. Our vast selection of designs covers a range of styles, from creative to business, and are all highly customizable and easy to edit. Download as a PowerPoint template or use them as Google Slides themes.


This slide depicts the dashboard for sales performance after the implementation of visualization research based on revenue, quantity, regional sales. Welcome to our selection of the Sales Performance Dashboard After Visualization Research Implementation Introduction PDF. These are designed to help you showcase your creativity and bring your sphere to life. Planning and Innovation are essential for any business that is just starting out. This collection contains the designs that you need for your everyday presentations. All of our PowerPoints are 100 percent editable, so you can customize them to suit your needs. This multi purpose template can be used in various situations. Grab these presentation templates today.


Presenting Departments Of Visualization Research Overview And Objective Of Visualization Research summary PDF to provide visual cues and insights. Share and navigate important information on five stages that need your due attention.This template can be used to pitch topics like Visualization Research, Generate Good Visualization, Advanced Training In addtion, this PPT design contains high resolution images, graphics, etc, that are easily editable and available for immediate download.


This slide depicts the different issues faced by the company in a project, but the lack of data understanding is the primary concern among all.Deliver an awe inspiring pitch with this creative Departments Of Visualization Research Lack Of Data Understanding Faced By The Company Download PDF bundle. Topics like Analytics Is Experienced, Lack Of Understanding, Analytics And Data Science can be discussed with this completely editable template. It is available for immediate download depending on the needs and requirements of the user.


Departments Of Visualization Research Issue Of Absence Of Goal Oriented Project Planning Designs PDF
This slide describes the lack of goal oriented project planning, which hampers the quality of the project that ultimately leads to the loss of the companys reputation. This is a Departments Of Visualization Research Issue Of Absence Of Goal Oriented Project Planning Designs PDF template with various stages. Focus and dispense information on six stages using this creative set, that comes with editable features. It contains large content boxes to add your information on topics like Planning Is The Primary, Representation And Difficult, Lacked Proper Data You can also showcase facts, figures, and other relevant content using this PPT layout. Grab it now.


This slide explains information visualization as a branch of visualization research that includes visuals like histograms, trend graphs, flow charts.Presenting Departments Of Visualization Research Information Visualization Research Branch Clipart PDF to provide visual cues and insights. Share and navigate important information on four stages that need your due attention. This template can be used to pitch topics like Interactive Visual, Representations Of Abstract, Information In addtion, this PPT design contains high resolution images, graphics, etc, that are easily editable and available for immediate download.


This slide represents the importance of visualization research, including analyzing data more effectively, faster decision making, and understanding complex information.This is a Departments Of Visualization Research Importance Of Visualization Research In Business Designs PDF template with various stages. Focus and dispense information on three stages using this creative set, that comes with editable features. It contains large content boxes to add your information on topics like Analyzing Data In A More Effective, Making Sense Of Difficult Information, Faster Decision Making You can also showcase facts, figures, and other relevant content using this PPT layout. Grab it now.


This slide represents another data visualization research tool that provides a high level of compatibility and is also a popular tool for commercial use.Presenting Departments Of Visualization Research Highcharts As Data Visualization Research Tool Ideas PDF to provide visual cues and insights. Share and navigate important information on four stages that need your due attention. This template can be used to pitch topics like Integrate Interactive, Necessitates The Purchase, Javascript Chart Framework In addtion, this PPT design contains high resolution images, graphics, etc, that are easily editable and available for immediate download.


This slide depicts google charts as the tool for data visualization, which can extract data from various sources, including SQL, databases, google sheets.This is a Departments Of Visualization Research Google Charts Tool For Data Visualization Themes PDF template with various stages. Focus and dispense information on five stages using this creative set, that comes with editable features. It contains large content boxes to add your information on topics like Popular Free Alternative, Create Dynamic Data, Including SQL Databases You can also showcase facts, figures, and other relevant content using this PPT layout. Grab it now.


This slide describes the fine report as the visualization research tool that can connect to various databases directly, making it easier to design.Presenting Departments Of Visualization Research Finereport As Visualization Research Tool Elements PDF to provide visual cues and insights. Share and navigate important information on six stages that need your due attention. This template can be used to pitch topics like Reporting Application, Visualization And Data, Complicated Reports In addtion, this PPT design contains high resolution images, graphics, etc, that are easily editable and available for immediate download.


Departments Of Visualization Research Different Types Of Analysis For Data Visualization Summary PDF
This slide describes the different types of analysis for data visualization, such as univariate analysis, bivariate analysis, and multivariate analysis.This is a Departments Of Visualization Research Different Types Of Analysis For Data Visualization Summary PDF template with various stages. Focus and dispense information on five stages using this creative set, that comes with editable features. It contains large content boxes to add your information on topics like Multivariate Analysis, Assess Practically, Univariate Analysis You can also showcase facts, figures, and other relevant content using this PPT layout. Grab it now.
This slide describes that using visualization in academic areas caters to easy detection of trendy data sets and helps understand the data. Presenting Departments Of Visualization Research Data Visualization Helps In Academic Research Icons PDF to provide visual cues and insights. Share and navigate important information on six stages that need your due attention. This template can be used to pitch topics like Eliminating Irrelevant, Visualizations Condense, Employed Successfully In addtion, this PPT design contains high resolution images, graphics, etc, that are easily editable and available for immediate download.


This slide depicts the impact of visualization research implementation, which results in data-driven project planning, due to which there is a 23 times increase in happy customers.This is a Departments Of Visualization Research Data Driven Project Planning After Visualization Rules PDF template with various stages. Focus and dispense information on three stages using this creative set, that comes with editable features. It contains large content boxes to add your information on topics like Visualization Research, Strategy Of The Company, Customers Are Regained You can also showcase facts, figures, and other relevant content using this PPT layout. Grab it now.


This slide depicts the D3 as the data visualization research tool based on java and includes various tools and techniques for data processing, layout algorithms, and generating graphics.Presenting Departments Of Visualization Research D3 Data Driven Documents As Data Visualization Structure PDF to provide visual cues and insights. Share and navigate important information on seven stages that need your due attention. This template can be used to pitch topics like Manipulation Documentation, Visualization Components, Generating Graphics In addtion, this PPT design contains high resolution images, graphics, etc, that are easily editable and available for immediate download.


Departments Of Visualization Research Bivariate Analysis Techniques For Data Visualization Ideas PDF
This slide describes the second analysis technique, bivariate analysis for data visualization, which includes three plots line, bar, and scatter.This is a Departments Of Visualization Research Bivariate Analysis Techniques For Data Visualization Ideas PDF template with various stages. Focus and dispense information on three stages using this creative set, that comes with editable features. It contains large content boxes to add your information on topics like Effective In Evaluating, Displaying Basic, Range Of Applications, Including You can also showcase facts, figures, and other relevant content using this PPT layout. Grab it now.
This slide shows the 30 60 90 days plan for visualization research, such as knowing and sorting the data, analyzing the information, and different tools required. Presenting Departments Of Visualization 30 60 90 Days Plan For Visualization Research Icons PDF to provide visual cues and insights. Share and navigate important information on three stages that need your due attention. This template can be used to pitch topics like Obtaining The Necessary Information, Sorting The Information, Analyzing The Information In addtion, this PPT design contains high resolution images, graphics, etc, that are easily editable and available for immediate download.


This is a Agenda For Departments Of Visualization Research Download PDF template with various stages. Focus and dispense information on four stages using this creative set, that comes with editable features. It contains large content boxes to add your information on topics like Agenda You can also showcase facts, figures, and other relevant content using this PPT layout. Grab it now.


Presenting Table Of Contents For Departments Of Visualization Research Information PDF to provide visual cues and insights. Share and navigate important information on one stage that need your due attention. This template can be used to pitch topics like Tools And Software, Visualization , Tableau As Visualization In addtion, this PPT design contains high resolution images, graphics, etc, that are easily editable and available for immediate download.
Introducing our well designed Icons Slide For Departments Of Visualization Research Elements PDF set of slides. The slide displays editable icons to enhance your visual presentation. The icons can be edited easily. So customize according to your business to achieve a creative edge. Download and share it with your audience.


This slide depicts the need for visualization research, including it can assist us in dealing with complex data, improve the efficiency of the organization, and enhance memory.This is a Departments Of Visualization Research Why Do We Need Visualization Research Infographics PDF template with various stages. Focus and dispense information on five stages using this creative set, that comes with editable features. It contains large content boxes to add your information on topics like Organization Efficiency, Information Also Enhances, Visualization Can Assist You can also showcase facts, figures, and other relevant content using this PPT layout. Grab it now.


This slide shows visual analytics, the last branch of visualization research, which emerged from the advancements in the other two branches and mainly focused on analytical reasoning.Presenting Departments Of Visualization Research Visual Analytics Branch Of Visualization Research Information PDF to provide visual cues and insights. Share and navigate important information on five stages that need your due attention. This template can be used to pitch topics like Information Visualization, Advancements In Scientific, Interactive Visual Interface In addtion, this PPT design contains high resolution images, graphics, etc, that are easily editable and available for immediate download.


This slide depicts the univariate analysis technique for data visualization, including distribution, box and whisker, and the violin plot.This is a Departments Of Visualization Research Univariate Analysis Techniques For Data Visualization Microsoft PDF template with various stages. Focus and dispense information on three stages using this creative set, that comes with editable features. It contains large content boxes to add your information on topics like Distribution Plot, Box And Whisker Plot, Violin Plot You can also showcase facts, figures, and other relevant content using this PPT layout. Grab it now.


This slide shows the tableau visualization research tool in which users can construct and share interactive and editable dashboards that represent data in charts.Presenting Departments Of Visualization Research Tableau As Visualization Research Tool Demonstration PDF to provide visual cues and insights. Share and navigate important information on ten stages that need your due attention. This template can be used to pitch topics like Business Intelligence, Dashboards That Represent, Business Intelligence In addtion, this PPT design contains high resolution images, graphics, etc, that are easily editable and available for immediate download.


This slide explains scientific visualization, the first branch of visualization research which focuses on 3D phenomena and visually represents scientific data.This is a Departments Of Visualization Research Scientific Visualization Branch Of Visualization Research Brochure PDF template with various stages. Focus and dispense information on four stages using this creative set, that comes with editable features. It contains large content boxes to add your information on topics like Architecture Meteorology, Medicine And Biological, Scientists May Better You can also showcase facts, figures, and other relevant content using this PPT layout. Grab it now.


This slide depicts the dashboard for sales performance after the implementation of visualization research based on revenue, quantity, regional sales.Deliver an awe inspiring pitch with this creative Departments Of Visualization Research Sales Performance Dashboard After Visualization Sample PDF bundle. Topics like Revenue Comparison, Quantity Comparison, Category Select can be discussed with this completely editable template. It is available for immediate download depending on the needs and requirements of the user.


This slide explains the roadmap for implementing visualization research in the company, including understanding and collecting the data, categorizing it, analyzing and visualizing the data. This is a Departments Of Visualization Research Roadmap For Visualization Research Summary PDF template with various stages. Focus and dispense information on four stages using this creative set, that comes with editable features. It contains large content boxes to add your information on topics like Understanding The Data, Categorizing The Data, Collecting The Relevant Data You can also showcase facts, figures, and other relevant content using this PPT layout. Grab it now.


This slide explains the roadmap for implementing visualization research in the company, including understanding and collecting the data, categorizing it, analyzing and visualizing the data. Presenting graphical representation of research it roadmap for visualization research summary pdf to provide visual cues and insights. Share and navigate important information on four stages that need your due attention. This template can be used to pitch topics like roadmap for visualization research implementation in company. In addtion, this PPT design contains high resolution images, graphics, etc, that are easily editable and available for immediate download.
This slide explains information visualization as a branch of visualization research that includes visuals like histograms, trend graphs, flow charts. Presenting graphical representation of research it information visualization research branch icons pdf to provide visual cues and insights. Share and navigate important information on four stages that need your due attention. This template can be used to pitch topics like geographic, information, design. In addtion, this PPT design contains high resolution images, graphics, etc, that are easily editable and available for immediate download.


This slide shows the tableau visualization research tool in which users can construct and share interactive and editable dashboards that represent data in charts. Deliver and pitch your topic in the best possible manner with this graphical representation of research it tableau as visualization research tool graphics pdf. Use them to share invaluable insights on process data, sources, sales, application and impress your audience. This template can be altered and modified as per your expectations. So, grab it now.


Graphical Representation Of Research IT Importance Of Visualization Research In Business Summary PDF
This slide represents the importance of visualization research, including analyzing data more effectively, faster decision making, and understanding complex information. This is a graphical representation of research it importance of visualization research in business summary pdf template with various stages. Focus and dispense information on three stages using this creative set, that comes with editable features. It contains large content boxes to add your information on topics like business customers, marketing plan, growth, data. You can also showcase facts, figures, and other relevant content using this PPT layout. Grab it now.


This is a graphical representation of research it why do we need visualization research graphics pdf template with various stages. Focus and dispense information on five stages using this creative set, that comes with editable features. It contains large content boxes to add your information on topics like why do we need visualization research. You can also showcase facts, figures, and other relevant content using this PPT layout. Grab it now.


This slide represents another data visualization research tool that provides a high level of compatibility and is also a popular tool for commercial use. This is a graphical representation of research it highcharts as data visualization research demonstration pdf template with various stages. Focus and dispense information on four stages using this creative set, that comes with editable features. It contains large content boxes to add your information on topics like highcharts as data visualization research tool. You can also showcase facts, figures, and other relevant content using this PPT layout. Grab it now.


This slide describes the fine report as the visualization research tool that can connect to various databases directly, making it easier to design. Presenting graphical representation of research it finereport as visualization research tool structure pdf to provide visual cues and insights. Share and navigate important information on eight stages that need your due attention. This template can be used to pitch topics like application, dashboards, databases. In addtion, this PPT design contains high resolution images, graphics, etc, that are easily editable and available for immediate download.


Retrieve professionally designed 30 60 90 Days Plan For Visualization Research Implementation Ppt Professional Show PDF to effectively convey your message and captivate your listeners. Save time by selecting pre-made slideshows that are appropriate for various topics, from business to educational purposes. These themes come in many different styles, from creative to corporate, and all of them are easily adjustable and can be edited quickly. Access them as PowerPoint templates or as Google Slides themes. You dont have to go on a hunt for the perfect presentation because Slidegeeks got you covered from everywhere.


This slide depicts the need for visualization research, including it can assist us in dealing with complex data, improve the efficiency of the organization, and enhance memory. Welcome to our selection of the Branches For Visualization Research And Development Why Do We Need Visualization Formats PDF. These are designed to help you showcase your creativity and bring your sphere to life. Planning and Innovation are essential for any business that is just starting out. This collection contains the designs that you need for your everyday presentations. All of our PowerPoints are 100 percent editable, so you can customize them to suit your needs. This multi-purpose template can be used in various situations. Grab these presentation templates today.


This slide depicts the univariate analysis technique for data visualization, including distribution, box and whisker, and the violin plot. This Branches For Visualization Research And Development Univariate Analysis Techniques Download PDF is perfect for any presentation, be it in front of clients or colleagues. It is a versatile and stylish solution for organizing your meetings. The Branches For Visualization Research And Development Univariate Analysis Techniques Download PDF features a modern design for your presentation meetings. The adjustable and customizable slides provide unlimited possibilities for acing up your presentation. Slidegeeks has done all the homework before launching the product for you. So, dont wait, grab the presentation templates today.


This slide shows the tableau visualization research tool in which users can construct and share interactive and editable dashboards that represent data in charts. This modern and well-arranged Branches For Visualization Research And Development Tableau As Visualization Research Introduction PDF provides lots of creative possibilities. It is very simple to customize and edit with the Powerpoint Software. Just drag and drop your pictures into the shapes. All facets of this template can be edited with Powerpoint, no extra software is necessary. Add your own material, put your images in the places assigned for them, adjust the colors, and then you can show your slides to the world, with an animated slide included.


This slide explains scientific visualization, the first branch of visualization research which focuses on 3D phenomena and visually represents scientific data. Make sure to capture your audiences attention in your business displays with our gratis customizable Branches For Visualization Research And Development Scientific Visualization Branch Of Clipart PDF. These are great for business strategies, office conferences, capital raising or task suggestions. If you desire to acquire more customers for your tech business and ensure they stay satisfied, create your own sales presentation with these plain slides.


This slide depicts the overview and objective of visualization research which is to know the limitations of ideas and obtain more value from data. Are you in need of a template that can accommodate all of your creative concepts This one is crafted professionally and can be altered to fit any style. Use it with Google Slides or PowerPoint. Include striking photographs, symbols, depictions, and other visuals. Fill, move around, or remove text boxes as desired. Test out color palettes and font mixtures. Edit and save your work, or work with colleagues. Download Branches For Visualization Research And Development Overview Ad Objective Of Visualization Brochure PDF and observe how to make your presentation outstanding. Give an impeccable presentation to your group and make your presentation unforgettable.


This slide describes the lack of goal-oriented project planning, which hampers the quality of the project that ultimately leads to the loss of the companys reputation. If your project calls for a presentation, then Slidegeeks is your go-to partner because we have professionally designed, easy-to-edit templates that are perfect for any presentation. After downloading, you can easily edit Branches For Visualization Research And Development Issue Of Absence Of Goal Oriented Inspiration PDF and make the changes accordingly. You can rearrange slides or fill them with different images. Check out all the handy templates.


This slide represents the importance of visualization research, including analyzing data more effectively, faster decision making, and understanding complex information. Find highly impressive Branches For Visualization Research And Development Importance Of Visualization Research Mockup PDF on Slidegeeks to deliver a meaningful presentation. You can save an ample amount of time using these presentation templates. No need to worry to prepare everything from scratch because Slidegeeks experts have already done a huge research and work for you. You need to download Branches For Visualization Research And Development Importance Of Visualization Research Mockup PDF for your upcoming presentation. All the presentation templates are 100 percent editable and you can change the color and personalize the content accordingly. Download now.


This slide represents another data visualization research tool that provides a high level of compatibility and is also a popular tool for commercial use. Whether you have daily or monthly meetings, a brilliant presentation is necessary. Branches For Visualization Research And Development Highcharts As Data Visualization Ideas PDF can be your best option for delivering a presentation. Represent everything in detail using Branches For Visualization Research And Development Highcharts As Data Visualization Ideas PDF and make yourself stand out in meetings. The template is versatile and follows a structure that will cater to your requirements. All the templates prepared by Slidegeeks are easy to download and edit. Our research experts have taken care of the corporate themes as well. So, give it a try and see the results.


This slide depicts google charts as the tool for data visualization, which can extract data from various sources, including SQL, databases, google sheets. Do you have an important presentation coming up Are you looking for something that will make your presentation stand out from the rest Look no further than Branches For Visualization Research And Development Google Charts Tool For Data Elements PDF. With our professional designs, you can trust that your presentation will pop and make delivering it a smooth process. And with Slidegeeks, you can trust that your presentation will be unique and memorable. So why wait Grab Branches For Visualization Research And Development Google Charts Tool For Data Elements PDF today and make your presentation stand out from the rest.


This slide describes the fine report as the visualization research tool that can connect to various databases directly, making it easier to design. Slidegeeks is here to make your presentations a breeze with Branches For Visualization Research And Development Finereport As Visualization Brochure PDF With our easy-to-use and customizable templates, you can focus on delivering your ideas rather than worrying about formatting. With a variety of designs to choose from, youre sure to find one that suits your needs. And with animations and unique photos, illustrations, and fonts, you can make your presentation pop. So whether youre giving a sales pitch or presenting to the board, make sure to check out Slidegeeks first.


This slide describes the different types of analysis for data visualization, such as univariate analysis, bivariate analysis, and multivariate analysis. Present like a pro with Branches For Visualization Research And Development Different Types Of Analysis Clipart PDF Create beautiful presentations together with your team, using our easy-to-use presentation slides. Share your ideas in real-time and make changes on the fly by downloading our templates. So whether youre in the office, on the go, or in a remote location, you can stay in sync with your team and present your ideas with confidence. With Slidegeeks presentation got a whole lot easier. Grab these presentations today.


This slide describes that using visualization in academic areas caters to easy detection of trendy data sets and helps understand the data. From laying roadmaps to briefing everything in detail, our templates are perfect for you. You can set the stage with your presentation slides. All you have to do is download these easy-to-edit and customizable templates. Branches For Visualization Research And Development Data Visualization Helps In Academic Download PDF will help you deliver an outstanding performance that everyone would remember and praise you for. Do download this presentation today.


This slide depicts the impact of visualization research implementation, which results in data-driven project planning, due to which there is a 23 times increase in happy customers. Get a simple yet stunning designed Branches For Visualization Research And Development Data Driven Project Planning Template PDF. It is the best one to establish the tone in your meetings. It is an excellent way to make your presentations highly effective. So, download this PPT today from Slidegeeks and see the positive impacts. Our easy-to-edit Branches For Visualization Research And Development Data Driven Project Planning Template PDF can be your go-to option for all upcoming conferences and meetings. So, what are you waiting for Grab this template today.


This slide depicts the D3 as the data visualization research tool based on java and includes various tools and techniques for data processing, layout algorithms, and generating graphics. Do you have to make sure that everyone on your team knows about any specific topic I yes, then you should give Branches For Visualization Research And Development D3 Data Driven Documents As Data Brochure PDF a try. Our experts have put a lot of knowledge and effort into creating this impeccable Branches For Visualization Research And Development D3 Data Driven Documents As Data Brochure PDF. You can use this template for your upcoming presentations, as the slides are perfect to represent even the tiniest detail. You can download these templates from the Slidegeeks website and these are easy to edit. So grab these today.


This slide describes the second analysis technique, bivariate analysis for data visualization, which includes three plots line, bar, and scatter. There are so many reasons you need a Branches For Visualization Research And Development Bivariate Analysis Techniques For Data Structure PDF. The first reason is you cant spend time making everything from scratch, Thus, Slidegeeks has made presentation templates for you too. You can easily download these templates from our website easily.


This slide shows visual analytics, the last branch of visualization research, which emerged from the advancements in the other two branches and mainly focused on analytical reasoning. Want to ace your presentation in front of a live audience Our Branches For Visual Analytics Branch Of Visualization Research And Development Slides PDF can help you do that by engaging all the users towards you. Slidegeeks experts have put their efforts and expertise into creating these impeccable powerpoint presentations so that you can communicate your ideas clearly. Moreover, all the templates are customizable, and easy-to-edit and downloadable. Use these for both personal and commercial use.


This slide explains the roadmap for implementing visualization research in the company, including understanding and collecting the data, categorizing it, analyzing and visualizing the data. This Roadmap For Visualization Research Implementation In Company Ppt Inspiration Summary PDF from Slidegeeks makes it easy to present information on your topic with precision. It provides customization options, so you can make changes to the colors, design, graphics, or any other component to create a unique layout. It is also available for immediate download, so you can begin using it right away. Slidegeeks has done good research to ensure that you have everything you need to make your presentation stand out. Make a name out there for a brilliant performance.


This slide explains information visualization as a branch of visualization research that includes visuals like histograms, trend graphs, flow charts. Here you can discover an assortment of the finest PowerPoint and Google Slides templates. With these templates, you can create presentations for a variety of purposes while simultaneously providing your audience with an eye-catching visual experience. Download Information Visualization Research And Development Ppt Infographics Gallery PDF to deliver an impeccable presentation. These templates will make your job of preparing presentations much quicker, yet still, maintain a high level of quality. Slidegeeks has experienced researchers who prepare these templates and write high-quality content for you. Later on, you can personalize the content by editing the Information Visualization Research And Development Ppt Infographics Gallery PDF.


Help your business to create an attention-grabbing presentation using our Icons Slide For Visualization Research And Development Ppt Ideas Outfit PDF set of slides. The slide contains innovative icons that can be flexibly edited. Choose this Icons Slide For Visualization Research And Development Ppt Ideas Outfit PDF template to create a satisfactory experience for your customers. Go ahead and click the download button.


Slidegeeks has constructed Agenda For Visualization Research And Development Ppt Icon Slides PDF after conducting extensive research and examination. These presentation templates are constantly being generated and modified based on user preferences and critiques from editors. Here, you will find the most attractive templates for a range of purposes while taking into account ratings and remarks from users regarding the content. This is an excellent jumping-off point to explore our content and will give new users an insight into our top-notch PowerPoint Templates.


This slide explains the roadmap for implementing visualization research in the company, including understanding and collecting the data, categorizing it, analyzing and visualizing the data. This Roadmap For Visualization Research Implementation In Company Background PDF is perfect for any presentation, be it in front of clients or colleagues. It is a versatile and stylish solution for organizing your meetings. The product features a modern design for your presentation meetings. The adjustable and customizable slides provide unlimited possibilities for acing up your presentation. Slidegeeks has done all the homework before launching the product for you. So, do not wait, grab the presentation templates today.
SHOW
- 60
- 120
- 180
DISPLAYING: 60 of 73 Item(s)
Page