 AI PPT Maker
 Templates
 PPT Bundles
 Design Services
 Business PPTs
 Business Plan
 Management
 Strategy
 Introduction PPT
 Roadmap
 Self Introduction
 Timelines
 Process
 Marketing
 Agenda
 Technology
 Medical
 Startup Business Plan
 Cyber Security
 Dashboards
 SWOT
SWOT Proposals
 Education
 Pitch Deck
 Digital Marketing
 KPIs
KPIs Project Management
 Product Management
 Artificial Intelligence
 Target Market
 Communication
 Supply Chain
 Google Slides
 Research Services
 One Pagers
 All Categories
New performance PowerPoint Presentation Templates and Google Slides
SHOW
- 60
- 120
- 180
DISPLAYING: 60 of 208 Item(s)
Page


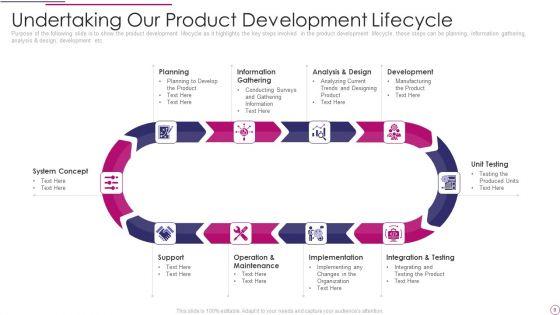


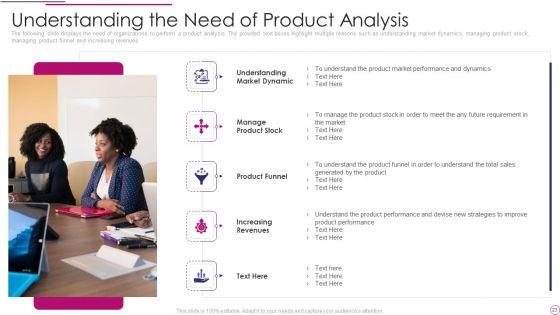
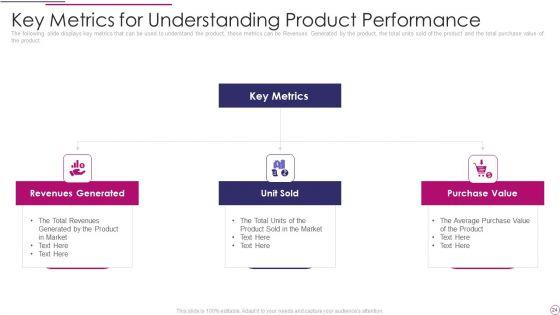


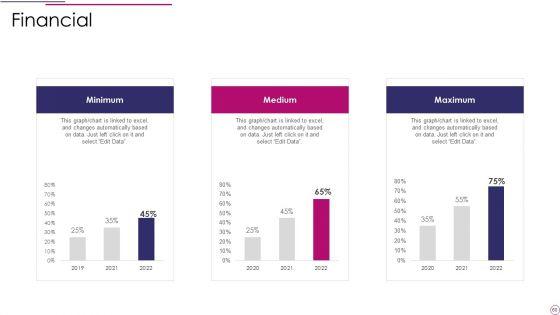


Induce strategic thinking by presenting this complete deck. Enthrall your audience by deploying this thought provoking PPT deck. It can be downloaded in both standard and widescreen aspect ratios, thus making it a complete package to use and deploy. Convey your thoughts and actions using the sixty five slides presented in this complete deck. Additionally, feel free to alter its components like color, graphics, design, etc, to create a great first impression. Grab it now by clicking on the download button below.


Induce strategic thinking by presenting this complete deck. Enthrall your audience by deploying this thought provoking PPT deck. It can be downloaded in both standard and widescreen aspect ratios, thus making it a complete package to use and deploy. Convey your thoughts and actions using the thirty one slides presented in this complete deck. Additionally, feel free to alter its components like color, graphics, design, etc, to create a great first impression. Grab it now by clicking on the download button below.


Presenting this set of slides with name new product performance cost analysis ppt powerpoint presentation complete deck with slides. The topics discussed in these slides are recurrent costs, cost decreasing, cost benefits analysis. This is a completely editable PowerPoint presentation and is available for immediate download. Download now and impress your audience.


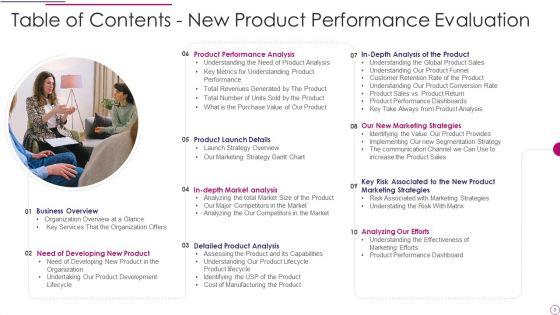
New Product Development Performance Evaluation Ppt PowerPoint Presentation Complete Deck With Slides
Presenting this set of slides with name new product development performance evaluation ppt powerpoint presentation complete deck with slides. The topics discussed in these slides are management, product, analysis, performance, customer. This is a completely editable PowerPoint presentation and is available for immediate download. Download now and impress your audience.


This lunar new year celebration performance ppt powerpoint presentation complete deck acts as backup support for your ideas, vision, thoughts, etc. Use it to present a thorough understanding of the topic. This PPT slideshow can be utilized for both in-house and outside presentations depending upon your needs and business demands. Entailing twelve slides with a consistent design and theme, this template will make a solid use case. As it is intuitively designed, it suits every business vertical and industry. All you have to do is make a few tweaks in the content or any other component to design unique presentations. The biggest advantage of this complete deck is that it can be personalized multiple times once downloaded. The color, design, shapes, and other elements are free to modify to add personal touches. You can also insert your logo design in this PPT layout. Therefore a well-thought and crafted presentation can be delivered with ease and precision by downloading this lunar new year celebration performance ppt powerpoint presentation complete deck PPT slideshow.


This slide showcases analyzing major performance indicators which can help branding managers to assess extension strategy KPIs. It provides details about market share, product line, launch, variants, color, size, net promotor score NPS, etc. Create an editable Extending Brand To Introduce New Commodities And Offerings Analyzing Major Performance Indicators Demonstration PDF that communicates your idea and engages your audience. Whether youre presenting a business or an educational presentation, pre designed presentation templates help save time. Extending Brand To Introduce New Commodities And Offerings Analyzing Major Performance Indicators Demonstration PDF is highly customizable and very easy to edit, covering many different styles from creative to business presentations. Slidegeeks has creative team members who have crafted amazing templates. So, go and get them without any delay.


This slide showcases analyzing major performance indicators which can help branding managers to assess extension strategy KPIs. It provides details about market share, product line, launch, variants, color, size, net promotor score NPS, etc. Boost your pitch with our creative Advertising New Commodities Through Analyzing Major Performance Indicators Post Download PDF. Deliver an awe-inspiring pitch that will mesmerize everyone. Using these presentation templates you will surely catch everyones attention. You can browse the ppts collection on our website. We have researchers who are experts at creating the right content for the templates. So you dont have to invest time in any additional work. Just grab the template now and use them.


This slide covers the marketing campaign tracker for the new product launch. It includes KPIs such as sessions, new sessions, page or session, avg. Session duration, bounce rate, goal conversion rate, and traffic by source. Welcome to our selection of the New Product Marketing Campaign Performance Analysis Dashboard Ppt Slides Grid PDF. These are designed to help you showcase your creativity and bring your sphere to life. Planning and Innovation are essential for any business that is just starting out. This collection contains the designs that you need for your everyday presentations. All of our PowerPoints are 100 percent editable, so you can customize them to suit your needs. This multi-purpose template can be used in various situations. Grab these presentation templates today


This slide showcases product line performance and outlook by market division which can help branding managers identify overall inputs. It provides details about increased sales, overseas market, lower marketing expenses, increased demand, etc. This modern and well arranged Extending Brand To Introduce New Commodities And Offerings Product Line Performance And Outlook Rules PDF provides lots of creative possibilities. It is very simple to customize and edit with the Powerpoint Software. Just drag and drop your pictures into the shapes. All facets of this template can be edited with Powerpoint no extra software is necessary. Add your own material, put your images in the places assigned for them, adjust the colors, and then you can show your slides to the world, with an animated slide included.


This slide showcases product line performance and outlook by market division which can help branding managers identify overall inputs. It provides details about increased sales, overseas market, lower marketing expenses, increased demand, etc. Get a simple yet stunning designed Advertising New Commodities Through Product Line Performance And Outlook Rules PDF. It is the best one to establish the tone in your meetings. It is an excellent way to make your presentations highly effective. So, download this PPT today from Slidegeeks and see the positive impacts. Our easy-to-edit Advertising New Commodities Through Product Line Performance And Outlook Rules PDF can be your go-to option for all upcoming conferences and meetings. So, what are you waiting for Grab this template today.


This slide showcases product line performance and outlook by market division which can help branding managers identify overall inputs. It provides details about increased sales, overseas market, lower marketing expenses, increased demand, etc. The Introducing New Commodities Through Product Line Extension Product Line Performance And Outlook Infographics PDF is a compilation of the most recent design trends as a series of slides. It is suitable for any subject or industry presentation, containing attractive visuals and photo spots for businesses to clearly express their messages. This template contains a variety of slides for the user to input data, such as structures to contrast two elements, bullet points, and slides for written information. Slidegeeks is prepared to create an impression.


The following slide showcases key performance indicator dashboard which can be used to measure the performance of new store. It covers information about net sales, sales per square foot, average basket size ABS, total visitors count etc.Create an editable Kpi Dashboard To Evaluate The New Retail Store Performance Opening Retail Store In Untapped Download PDF that communicates your idea and engages your audience. Whether you are presenting a business or an educational presentation, pre-designed presentation templates help save time. Kpi Dashboard To Evaluate The New Retail Store Performance Opening Retail Store In Untapped Download PDF is highly customizable and very easy to edit, covering many different styles from creative to business presentations. Slidegeeks has creative team members who have crafted amazing templates. So, go and get them without any delay.


This slide provides information regarding product launch team performance with key result area scores for idea generation, engineering AND design and key result areas performance. Retrieve professionally designed New Product Launch Product Launch Team Performance Dashboard Portrait PDF to effectively convey your message and captivate your listeners. Save time by selecting pre-made slideshows that are appropriate for various topics, from business to educational purposes. These themes come in many different styles, from creative to corporate, and all of them are easily adjustable and can be edited quickly. Access them as PowerPoint templates or as Google Slides themes. You dont have to go on a hunt for the perfect presentation because Slidegeeks got you covered from everywhere.
This slide illustrates informational stats about organizations best performing products at global level. This presentation shows the stats of Americas and APAC regions. Formulating a presentation can take up a lot of effort and time, so the content and message should always be the primary focus. The visuals of the PowerPoint can enhance the presenters message, so our Introduction To New Product Portfolio Globally Analyzing The Best Performing Products Ppt Icon Layout PDF was created to help save time. Instead of worrying about the design, the presenter can concentrate on the message while our designers work on creating the ideal templates for whatever situation is needed. Slidegeeks has experts for everything from amazing designs to valuable content, we have put everything into Introduction To New Product Portfolio Globally Analyzing The Best Performing Products Ppt Icon Layout PDF.


This slide illustrates a dashboard that can be used by a product manager to measure the business performance. Metrics covered in the dashboard are revenue, launches, cash flow, EPS, average revenue by product and average cost by phase. Are you in need of a template that can accommodate all of your creative concepts. This one is crafted professionally and can be altered to fit any style. Use it with Google Slides or PowerPoint. Include striking photographs, symbols, depictions, and other visuals. Fill, move around, or remove text boxes as desired. Test out color palettes and font mixtures. Edit and save your work, or work with colleagues. Download Introduction To New Product Portfolio Dashboard To Measure Business Performance Ppt Ideas Clipart Images PDF and observe how to make your presentation outstanding. Give an impeccable presentation to your group and make your presentation unforgettable.


This slide provides information regarding product launch team performance with key result area scores for idea generation, engineering and design and key result areas performance. From laying roadmaps to briefing everything in detail, our templates are perfect for you. You can set the stage with your presentation slides. All you have to do is download these easy to edit and customizable templates. New Product Launch To Market Playbook Product Launch Team Performance Dashboard Introduction PDF will help you deliver an outstanding performance that everyone would remember and praise you for. Do download this presentation today.
This slide illustrates informational stats about organizations best performing products at global level. This presentation shows the stats of americas and APAC regions.Slidegeeks is here to make your presentations a breeze with Globally Analyzing The Best Performing Creating And Offering Multiple Product Ranges In New Business Territories Icons PDF our easy-to-use and customizable templates, you can focus on delivering your ideas rather than worrying about formatting. With a variety of designs to choose from, you are sure to find one that suits your needs. And with animations and unique photos, illustrations, and fonts, you can make your presentation pop. So whether you are giving a sales pitch or presenting to the board, make sure to check out Slidegeeks first.


This slide illustrates a dashboard that can be used by a product manager to measure the business performance. Metrics covered in the dashboard are revenue, launches, cash flow, EPS, average revenue by product and average cost by phase.There are so many reasons you need a Dashboard To Measure Business Performance Creating And Offering Multiple Product Ranges In New Business Introduction PDF. The first reason is you can notspend time making everything from scratch, Thus, Slidegeeks has made presentation templates for you too. You can easily download these templates from our website easily.


This slide illustrates learning and development programs for various teams. It provides information about communication, spreadsheet management, task management, reporting, finance, trading, analytics, dashboard, email writing, etc.This modern and well-arranged Positive Impact Of New Team Performance Management System Building Efficient Template PDF provides lots of creative possibilities. It is very simple to customize and edit with the Powerpoint Software. Just drag and drop your pictures into the shapes. All facets of this template can be edited with Powerpoint no extra software is necessary. Add your own material, put your images in the places assigned for them, adjust the colors, and then you can show your slides to the world, with an animated slide included.


This slide shows sales performance monitoring dashboard. Metrics included in the dashboard are sales revenue, sales growth, average revenue per unit, customer lifetime value and customer acquisition cost. This modern and well arranged Creating New Product Launch Campaign Strategy Kpi Dashboard To Monitor Sales Performance Introduction PDF provides lots of creative possibilities. It is very simple to customize and edit with the Powerpoint Software. Just drag and drop your pictures into the shapes. All facets of this template can be edited with Powerpoint no extra software is necessary. Add your own material, put your images in the places assigned for them, adjust the colors, and then you can show your slides to the world, with an animated slide included.


This slide illustrates sales representative performance measurement dashboard with key metrics such as average first contact resolution rate, occupancy rate, NPS and top agents by solved tickets. Make sure to capture your audiences attention in your business displays with our gratis customizable Creating New Product Launch Campaign Strategy Dashboard To Measure Sales Rep Performance Introduction PDF. These are great for business strategies, office conferences, capital raising or task suggestions. If you desire to acquire more customers for your tech business and ensure they stay satisfied, create your own sales presentation with these plain slides.
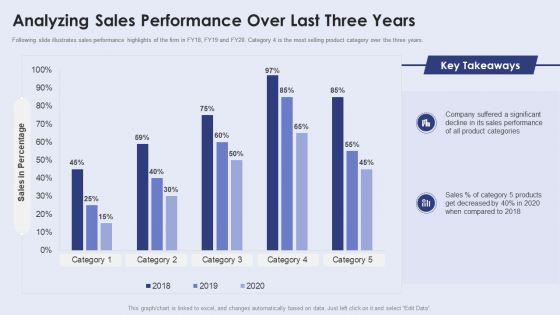
Following slide illustrates sales performance highlights of the firm in FY18, FY19 and FY20. Category 4 is the most selling product category over the three years. If your project calls for a presentation, then Slidegeeks is your go to partner because we have professionally designed, easy to edit templates that are perfect for any presentation. After downloading, you can easily edit Creating New Product Launch Campaign Strategy Analyzing Sales Performance Over Last Three Years Structure PDF and make the changes accordingly. You can rearrange slides or fill them with different images. Check out all the handy templates.


This slide illustrates informational stats about organizations best performing products at global level. This presentation shows the stats of Americas and APAC regions. Deliver an awe inspiring pitch with this creative Method To Introduce New Product Offerings In The Industry Globally Analyzing The Best Performing Products Ideas PDF bundle. Topics like Globally Analyzing, Performing Products can be discussed with this completely editable template. It is available for immediate download depending on the needs and requirements of the user.


This slide illustrates a dashboard that can be used by a product manager to measure the business performance. Metrics covered in the dashboard are revenue, launches, cash flow, EPS, average revenue by product and average cost by phase. Deliver and pitch your topic in the best possible manner with this Method To Introduce New Product Offerings In The Industry Dashboard To Measure Business Performance Pictures PDF. Use them to share invaluable insights on Revenue, Cash Flow, Development Cost and impress your audience. This template can be altered and modified as per your expectations. So, grab it now.


This slide shows the dashboard representing the performance evaluation of the new staff members of the support team staff. It shoes details related to occupancy rate, net promoter score, average first contact resolution rate etc. Pitch your topic with ease and precision using this Support Team New Employee Members Performance Dashboard Designs PDF. This layout presents information on Target Range, Occupancy Rate, Contact Resolution Rate. It is also available for immediate download and adjustment. So, changes can be made in the color, design, graphics or any other component to create a unique layout.


This slide shows the dashboard representing the management of performance of new staff members. It shows details related to head count, absenteeism percentage, average employee age and tenure, gender diversity ratio, their salary range etc. Pitch your topic with ease and precision using this New Marketing Employee Members Performance Management Dashboard Summary PDF. This layout presents information on Employee Ratio, Average Employee Tenure. It is also available for immediate download and adjustment. So, changes can be made in the color, design, graphics or any other component to create a unique layout.


Deliver an awe inspiring pitch with this creative Yearly Product Performance Assessment Repor Our New Customer Engagement Strategy Brochure PDF bundle. Topics like Interaction Platforms, Customer Satisfaction, Community Event can be discussed with this completely editable template. It is available for immediate download depending on the needs and requirements of the user.


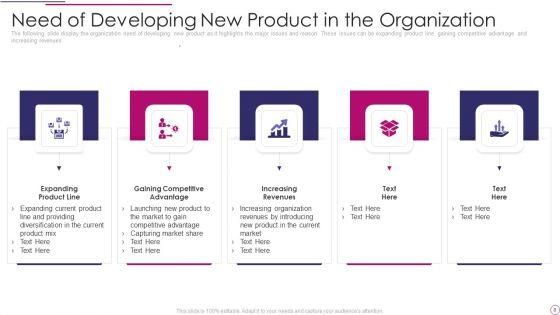
The following slide display the organization need of developing new product as it highlights the major issues and reason. These issues can be expanding product line, gaining competitive advantage and increasing revenues.Presenting Yearly Product Performance Assessment Repor Need Of Developing New Product Structure PDF to provide visual cues and insights. Share and navigate important information on five stages that need your due attention. This template can be used to pitch topics like Expanding Product, Gaining Competitive, Increasing Revenues In addtion, this PPT design contains high resolution images, graphics, etc, that are easily editable and available for immediate download.


The following slide provides with new segmentation strategy for the organization based on demographics psychographics geographic and behavioral aspects.This is a Yearly Product Performance Assessment Repor Implementing Our New Segmentation Strategy Inspiration PDF template with various stages. Focus and dispense information on one stage using this creative set, that comes with editable features. It contains large content boxes to add your information on topics like Technical Individual, Psychographic, Geographic You can also showcase facts, figures, and other relevant content using this PPT layout. Grab it now.


This slide shows sales performance monitoring dashboard. Metrics included in the dashboard are sales revenue, sales growth, average revenue per unit, customer lifetime value and customer acquisition cost.Deliver an awe inspiring pitch with this creative Effective Sales Plan For New Product Introduction In Market KPI Dashboard To Monitor Sales Performance Portrait PDF bundle. Topics like Average Revenue, Country Performance, Customer Lifetime can be discussed with this completely editable template. It is available for immediate download depending on the needs and requirements of the user.


Following slide illustrates sales performance highlights of the firm in FY20, FY21 and FY22. Category 4 is the most selling product category over the three years.Deliver and pitch your topic in the best possible manner with this Effective Sales Plan For New Product Introduction In Market Analyzing Sales Performance Mockup PDF Use them to share invaluable insights on Company Suffered, Product Categories, Products Decreased and impress your audience. This template can be altered and modified as per your expectations. So, grab it now.


This slide provides information regarding preparing SWOT analysis for candidates in order to select suitable candidate by assessing them based on their strengths, weaknesses, opportunities and threats. Presenting New Hire Onboarding Process Enhancement Performing Swot Analysis In Selecting Right Candidate Infographics PDF to provide visual cues and insights. Share and navigate important information on four stages that need your due attention. This template can be used to pitch topics like Weaknesses, Threats, External Opportunities. In addtion, this PPT design contains high resolution images, graphics, etc, that are easily editable and available for immediate download.


This slide shows sales performance monitoring dashboard. Metrics included in the dashboard are sales revenue, sales growth, average revenue per unit, customer lifetime value and customer acquisition cost. Deliver an awe inspiring pitch with this creative New Product Sales Strategy And Marketing KPI Dashboard To Monitor Sales Performance Information PDF bundle. Topics like Sales Revenue, Monthly Sales Growth, Sales Country Performance can be discussed with this completely editable template. It is available for immediate download depending on the needs and requirements of the user.
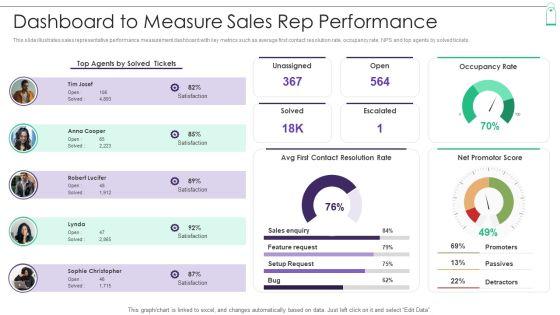
This slide illustrates sales representative performance measurement dashboard with key metrics such as average first contact resolution rate, occupancy rate, NPS and top agents by solved tickets. Deliver an awe inspiring pitch with this creative New Product Sales Strategy And Marketing Dashboard To Measure Sales Rep Performance Guidelines PDF bundle. Topics like Contact Resolution Rate, Contact Resolution Rate, Net Promoter Score can be discussed with this completely editable template. It is available for immediate download depending on the needs and requirements of the user.


Following slide illustrates sales performance highlights of the firm in FY20, FY21 and FY22. Category 5 is the most selling product category over the three years. Deliver an awe inspiring pitch with this creative New Product Sales Strategy And Marketing Analyzing Sales Performance Over Last Three Years Introduction PDF bundle. Topics like Project Management Roles, Job Opportunities, Product Categories can be discussed with this completely editable template. It is available for immediate download depending on the needs and requirements of the user.


This slide shows sales performance monitoring dashboard. Metrics included in the dashboard are sales revenue, sales growth, average revenue per unit, customer lifetime value and customer acquisition cost.Deliver an awe inspiring pitch with this creative Effective Sales Technique For New Product Launch KPI Dashboard To Monitor Sales Performance Graphics PDF bundle. Topics like Country Performance, Average Revenue, Customer Acquisition can be discussed with this completely editable template. It is available for immediate download depending on the needs and requirements of the user.


This slide illustrates sales representative performance measurement dashboard with key metrics such as average first contact resolution rate, occupancy rate, NPS and top agents by solved tickets.Deliver and pitch your topic in the best possible manner with this Effective Sales Technique For New Product Launch Dashboard To Measure Sales Rep Performance Themes PDF Use them to share invaluable insights on Contact Resolution, Feature Request, Promoters and impress your audience. This template can be altered and modified as per your expectations. So, grab it now.
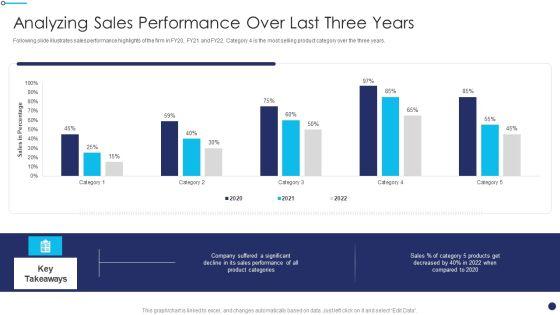

Following slide illustrates sales performance highlights of the firm in FY20, FY21 and FY22. Category 4 is the most selling product category over the three years.Deliver and pitch your topic in the best possible manner with this Effective Sales Technique For New Product Launch Analyzing Sales Performance Over Last Three Years Introduction PDF Use them to share invaluable insights on Sales Performance, Suffered Significant, Product Categories and impress your audience. This template can be altered and modified as per your expectations. So, grab it now.


The following slide displays the dashboard which highlights the performance of the product, multiple metrics such as Revenues, New customer, gross profit, customer satisfaction and global sales breakdown Deliver and pitch your topic in the best possible manner with this New Commodity Market Viability Review Product Performance Dashboards Guidelines PDF Use them to share invaluable insights on Gross Profit, Customer Satisfaction, Product Category and impress your audience. This template can be altered and modified as per your expectations. So, grab it now.


The following slide displays the product performance dashboard as it highlights the top product by revenue, online vs. in store purchase, the sales by campaign Deliver an awe inspiring pitch with this creative New Commodity Market Viability Review Product Performance Dashboard Infographics PDF bundle. Topics like Online Purchase, Products Revenue, Sales Campaign can be discussed with this completely editable template. It is available for immediate download depending on the needs and requirements of the user.


The following slide displays the dashboard which highlights the performance of the product, multiple metrics such as Revenues, New customer, gross profit, customer satisfaction and global sales breakdown Deliver and pitch your topic in the best possible manner with this Evaluating New Commodity Impact On Market Product Performance Dashboards Template PDF Use them to share invaluable insights on Brand Profitability, Customer Satisfaction, Gross Profit and impress your audience. This template can be altered and modified as per your expectations. So, grab it now.


The following slide displays the product performance dashboard as it highlights the top product by revenue, online vs. in store purchase, the sales by campaign Deliver an awe inspiring pitch with this creative Evaluating New Commodity Impact On Market Product Performance Dashboard Elements PDF bundle. Topics like Sales Campaign, Products In Revenue, Online Purchase can be discussed with this completely editable template. It is available for immediate download depending on the needs and requirements of the user.
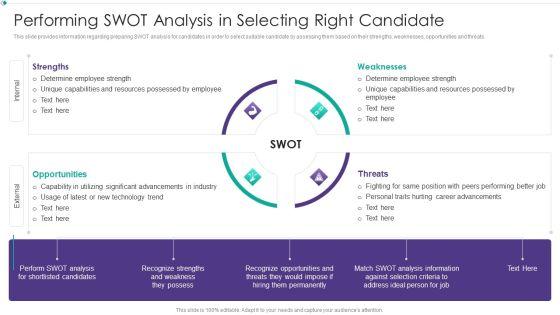

This slide provides information regarding preparing SWOT analysis for candidates in order to select suitable candidate by assessing them based on their strengths, weaknesses, opportunities and threats. Presenting Hiring New Employees At Workplace Performing Swot Analysis In Selecting Right Candidate Rules PDF to provide visual cues and insights. Share and navigate important information on four stages that need your due attention. This template can be used to pitch topics like Strengths, Weaknesses, Threats, Opportunities. In addtion, this PPT design contains high resolution images, graphics, etc, that are easily editable and available for immediate download.


This slide portrays the performance benchmarking of existing digital marketing channels in terms of website traffic, total engagements, total unique visitors etc.Deliver and pitch your topic in the best possible manner with this Linkedin Marketing For New Ventures Performance Benchmarking Of Company Slides PDF Use them to share invaluable insights on Total Engagements, Total Potential Impressions, Total Unique Visitors and impress your audience. This template can be altered and modified as per your expectations. So, grab it now.


This slide depicts the dashboard for LinkedIn marketing campaign providing information regarding impressions, clicks, engagement rate, CTR monthly trend, budget etc.Deliver and pitch your topic in the best possible manner with this Linkedin Marketing For New Ventures Campaign Performance Evaluation Dashboard Themes PDF Use them to share invaluable insights on Impressions, Engagement Rate, Total Engagements and impress your audience. This template can be altered and modified as per your expectations. So, grab it now.


Below slide highlights performance rating scorecard based on key parameters such as sales revenue, customer chur, customer engagement, customer satisfaction etc.Deliver an awe inspiring pitch with this creative Linkedin Marketing For New Ventures Brand Performance Ranking Scorecard Infographics PDF bundle. Topics like Sales Revenue, Customer Engagement, Customer Satisfaction can be discussed with this completely editable template. It is available for immediate download depending on the needs and requirements of the user.


The following slide highlights the performance of various channels to attain new customers. It includes a bar graph showcasing the performance of various channels such as social media, mobile marketing, content marketing, email marketing, paid ads etc. Showcasing this set of slides titled Top Performing New Client Acquire Channels Elements PDF The topics addressed in these templates are Top Performing New Client Acquire Channels All the content presented in this PPT design is completely editable. Download it and make adjustments in color, background, font etc. as per your unique business setting.


This slide shows sales performance monitoring dashboard. Metrics included in the dashboard are sales revenue, sales growth, average revenue per unit, customer lifetime value and customer acquisition cost.Deliver and pitch your topic in the best possible manner with this Go To Market Approach For New Product KPI Dashboard To Monitor Sales Performance Clipart PDF Use them to share invaluable insights on Kpi Dashboard To Monitor Sales Performance and impress your audience. This template can be altered and modified as per your expectations. So, grab it now.


This slide illustrates sales representative performance measurement dashboard with key metrics such as average first contact resolution rate, occupancy rate, NPS and top agents by solved tickets.Deliver and pitch your topic in the best possible manner with this Go To Market Approach For New Product Dashboard To Measure Sales Rep Performance Formats PDF Use them to share invaluable insights on Dashboard To Measure Sales Rep Performance and impress your audience. This template can be altered and modified as per your expectations. So, grab it now.


Following slide illustrates sales performance highlights of the firm in FY20, FY21 and FY22. Category 4 is the most selling product category over the three years.Deliver an awe inspiring pitch with this creative Go To Market Approach For New Product Analyzing Sales Performance Over Last Three Years Inspiration PDF bundle. Topics like Analyzing Sales Performance Over Last Three Years can be discussed with this completely editable template. It is available for immediate download depending on the needs and requirements of the user.


This slide illustrates informational stats about organizations best performing products at global level. This presentation shows the stats of Americas and APAC regions.Deliver and pitch your topic in the best possible manner with this Product Portfolio Management For New Target Region Globally Analyzing The Best Performing Summary PDF Use them to share invaluable insights on Globally Analyzing the Best Performing Products and impress your audience. This template can be altered and modified as per your expectations. So, grab it now.


This slide illustrates sales performance highlight of the company in financial year 2022. It also shows the statistics of units sold across different the regions.Deliver an awe inspiring pitch with this creative Introducing A New Product To The Market Sales Performance Highlight In FY22 Inspiration PDF bundle. Topics like Sales Performance Highlight In Fy22 can be discussed with this completely editable template. It is available for immediate download depending on the needs and requirements of the user.


This slide illustrates various goals set by the firm to enhance its current business performance. Goals are set based on focus areas namely market share, brand awareness and revenue generation.This is a Introducing A New Product To The Market Goals Setting Based On Business Performance Diagrams PDF template with various stages. Focus and dispense information on one stage using this creative set, that comes with editable features. It contains large content boxes to add your information on topics like Revenue Generation, Brand Awareness, Current Performance You can also showcase facts, figures, and other relevant content using this PPT layout. Grab it now.


Following slide shows competitive landscape based on performance criteria. Criteria covered are product quality, product price, after sales service and customer service. Deliver and pitch your topic in the best possible manner with this Introducing A New Product To The Market Competitive Landscape Performance Specific Information PDF Use them to share invaluable insights on Competitive Landscape Performance Specific and impress your audience. This template can be altered and modified as per your expectations. So, grab it now.


Following slide covers campaign performance dashboard of the firm. It includes metrics such as total spend, total impressions, total clicks, total acquisitions and cost per acquisition.Deliver and pitch your topic in the best possible manner with this Introducing A New Product To The Market Campaign Performance Dashboard Pictures PDF Use them to share invaluable insights on Per Acquisition, Total Acquisitions, Total Impressions and impress your audience. This template can be altered and modified as per your expectations. So, grab it now.


Following slide covers business performance dashboard of the firm. It include KPIs such as average weekly sales revenue, above sales target, sales revenue and profit generated.Deliver and pitch your topic in the best possible manner with this Introducing A New Product To The Market Business Performance KPI Dashboard Brochure PDF Use them to share invaluable insights on Business Performance KPI Dashboard and impress your audience. This template can be altered and modified as per your expectations. So, grab it now.


This slide provides information regarding product launch team performance with key result area scores for idea generation, engineering and design and key result areas performance. Deliver an awe inspiring pitch with this creative new product launch playbook product launch team performance dashboard elements pdf bundle. Topics like product launch team performance dashboard can be discussed with this completely editable template. It is available for immediate download depending on the needs and requirements of the user.


This slide shows sample buyers persona with demographics, buyer motivation of the target audience, marketing messages and elevator pitch to tackle common questions of target audience Presenting approaches for new product release target buyer persona to enhance sales performance infographics pdf to provide visual cues and insights. Share and navigate important information on four stages that need your due attention. This template can be used to pitch topics like target buyer persona to enhance sales performance . In addtion, this PPT design contains high resolution images, graphics, etc, that are easily editable and available for immediate download.
SHOW
- 60
- 120
- 180
DISPLAYING: 60 of 208 Item(s)
Page