 AI PPT Maker
 Templates
 PPT Bundles
 Design Services
 Business PPTs
 Business Plan
 Management
 Strategy
 Introduction PPT
 Roadmap
 Self Introduction
 Timelines
 Process
 Marketing
 Agenda
 Technology
 Medical
 Startup Business Plan
 Cyber Security
 Dashboards
 SWOT
SWOT Proposals
 Education
 Pitch Deck
 Digital Marketing
 KPIs
KPIs Project Management
 Product Management
 Artificial Intelligence
 Target Market
 Communication
 Supply Chain
 Google Slides
 Research Services
 One Pagers
 All Categories
Kpis for tracking PowerPoint Presentation Templates and Google Slides
SHOW
- 60
- 120
- 180
DISPLAYING: 60 of 117 Item(s)
Page


Following slide showcases KPI dashboard to determine best market for launching new business. It includes key components such as growth rate by different industries, best states to launch startup, sales forecast, market growth forecast, projected sales by different states. Showcasing this set of slides titled KPI Dashboard To Track Best Market Opportunities For New Established Business Pictures PDF. The topics addressed in these templates are Forecasted Sales, Growth Rate, Startup Industries. All the content presented in this PPT design is completely editable. Download it and make adjustments in color, background, font etc. as per your unique business setting.
This slide covers the dashboard for analyzing customer loyalty with metrics such as NPS, loyal customer rate, premium users, CLV, customer churn, revenue churn, net retention, MRR growth, etc. Welcome to our selection of the Ultimate Guide To Improve Customer Support And Services Kpi Dashboard For Tracking Customer Retention Guidelines PDF. These are designed to help you showcase your creativity and bring your sphere to life. Planning and Innovation are essential for any business that is just starting out. This collection contains the designs that you need for your everyday presentations. All of our PowerPoints are 100 percent editable, so you can customize them to suit your needs. This multi purpose template can be used in various situations. Grab these presentation templates today.
Following slide showcases marketing mix progress monitoring dashboard to determine business performance. It includes elements such as clicks, impressions, click through rate, conversion rate, cost per click and monthly overview to Google ads. Showcasing this set of slides titled KPI Dashboard For Tracking Marcom Mix Strategy Progress Ideas PDF. The topics addressed in these templates are Kpi Dashboard, Tracking Marcom, Mix Strategy Progress. All the content presented in this PPT design is completely editable. Download it and make adjustments in color, background, font etc. as per your unique business setting.
Google Keyword Assessment KPI Dashboard For Tracking Improvement In Website Traffic Infographics PDF
Following slide demonstrates keyword analysis dashboard which can be used by business to track website traffic performance. It includes metrics such as average keyword position, keyword ranking distribution, keyword ranking, keyword in top 3, top 10, top 20 and top 100. Showcasing this set of slides titled Google Keyword Assessment KPI Dashboard For Tracking Improvement In Website Traffic Infographics PDF. The topics addressed in these templates are Keyword Ranking, Keyword Ranking Distribution, Average Keyword Position. All the content presented in this PPT design is completely editable. Download it and make adjustments in color, background, font etc. as per your unique business setting.


Mentioned slide demonstrates KPI dashboard for monitoring talent sourcing team performance. It includes key components such as time to hire, time to fill, recruitment cost , hiring funnel, hiring ratio by gender, candidate age range. Do you know about Slidesgeeks Detailed Guide For Talent Acquisition KPI Dashboard To Track Talent Sourcing Funnel Elements PDF These are perfect for delivering any kind od presentation. Using it, create PowerPoint presentations that communicate your ideas and engage audiences. Save time and effort by using our pre designed presentation templates that are perfect for a wide range of topic. Our vast selection of designs covers a range of styles, from creative to business, and are all highly customizable and easy to edit. Download as a PowerPoint template or use them as Google Slides themes.
Following slide demonstrates progress tracking dashboard to determine objectives achieved by business. It includes elements such as objectives achieved, unachieved objectives, objectives achievement in progress and all objectives status. Showcasing this set of slides titled KPI Dashboard For Tracking Corporate Objectives Progress Template PDF. The topics addressed in these templates are Objectives Achieved, Unachieved Objectives, Objectives Progress . All the content presented in this PPT design is completely editable. Download it and make adjustments in color, background, font etc. as per your unique business setting.
Following slide demonstrates key performance indicator dashboard for tracking monthly sales to monitor business performance. It includes components such as monthly execution cost, sales, state wise events, Brand market, and programs. Showcasing this set of slides titled Monthly Sales KPI Dashboard For Tracking Brand Recommendation Progress Background PDF. The topics addressed in these templates are Products Sold, Engagements, Events, Active Markets, Sampled, Attendance. All the content presented in this PPT design is completely editable. Download it and make adjustments in color, background, font etc. as per your unique business setting.
This slide covers the dashboard for analyzing customer loyalty with metrics such as NPS, loyal customer rate, premium users, CLV, customer churn, revenue churn, net retention, MRR growth, etc. Presenting this PowerPoint presentation, titled KPI Dashboard For Tracking Customer Retention Elements PDF, with topics curated by our researchers after extensive research. This editable presentation is available for immediate download and provides attractive features when used. Download now and captivate your audience. Presenting this KPI Dashboard For Tracking Customer Retention Elements PDF. Our researchers have carefully researched and created these slides with all aspects taken into consideration. This is a completely customizable KPI Dashboard For Tracking Customer Retention Elements PDF that is available for immediate downloading. Download now and make an impact on your audience. Highlight the attractive features available with our PPTs.
This slide showcases the KPI dashboard that would help the business organization to track shareholder and companys valuation. It includes parameters such as total dividend growth rate, total capital return, share count reduced, etc. Retrieve professionally designed Kpi Dashboard For Tracking Shareholder Value Maximization Ppt PowerPoint Presentation File Icon PDF to effectively convey your message and captivate your listeners. Save time by selecting pre made slideshows that are appropriate for various topics, from business to educational purposes. These themes come in many different styles, from creative to corporate, and all of them are easily adjustable and can be edited quickly. Access them as PowerPoint templates or as Google Slides themes. You do not have to go on a hunt for the perfect presentation because Slidegeeks got you covered from everywhere.
The following slide illustrates dashboard which helps brand managers to improve their communication campaign performance. It presents information related to campaigns, cost per acquisitions, etc. Pitch your topic with ease and precision using this KPI Dashboard For Tracking Brand Communication Techniques Performance Topics PDF. This layout presents information on KPI Dashboard, Tracking Brand Communication, Techniques Performance. It is also available for immediate download and adjustment. So, changes can be made in the color, design, graphics or any other component to create a unique layout.
This slide covers the KPI dashboard for analyzing SEO metrics such as authority score, organic traffic, organic keywords, paid keywords, ref. Domains, site audit, link-building tool, organic traffic, on-page SEO checker, backlink audit, etc. This Marketers Guide To Data Analysis Optimization KPI Dashboard For Tracking SEO Analytics Template PDF from Slidegeeks makes it easy to present information on your topic with precision. It provides customization options, so you can make changes to the colors, design, graphics, or any other component to create a unique layout. It is also available for immediate download, so you can begin using it right away. Slidegeeks has done good research to ensure that you have everything you need to make your presentation stand out. Make a name out there for a brilliant performance.
This slide covers the dashboard for analyzing paid search metrics such as ad cost, clicks, impressions, click-through rate, cost per conversion, conversion rate, cost per click, etc. Here you can discover an assortment of the finest PowerPoint and Google Slides templates. With these templates, you can create presentations for a variety of purposes while simultaneously providing your audience with an eye catching visual experience. Download Marketers Guide To Data Analysis Optimization KPI Dashboard For Tracking Paid Ad Campaign Performance Clipart PDF to deliver an impeccable presentation. These templates will make your job of preparing presentations much quicker, yet still, maintain a high level of quality. Slidegeeks has experienced researchers who prepare these templates and write high quality content for you. Later on, you can personalize the content by editing the Marketers Guide To Data Analysis Optimization KPI Dashboard For Tracking Paid Ad Campaign Performance Clipart PDF.
This slide covers the dashboard for analyzing email marketing metrics such as overall open rate, click-through rate, click-to-open ratio, unsubscribe rate, hard bounce rate, soft rate, monthly open rate, total monthly subscribers, etc. Presenting this PowerPoint presentation, titled Marketers Guide To Data Analysis Optimization KPI Dashboard For Tracking Email Marketing Campaign Infographics PDF, with topics curated by our researchers after extensive research. This editable presentation is available for immediate download and provides attractive features when used. Download now and captivate your audience. Presenting this Marketers Guide To Data Analysis Optimization KPI Dashboard For Tracking Email Marketing Campaign Infographics PDF. Our researchers have carefully researched and created these slides with all aspects taken into consideration. This is a completely customizable Marketers Guide To Data Analysis Optimization KPI Dashboard For Tracking Email Marketing Campaign Infographics PDF that is available for immediate downloading. Download now and make an impact on your audience. Highlight the attractive features available with our PPTs.
This slide covers the dashboard for analyzing blogging KPIs such as performance, published posts, views, new blog subscribers, top blog posts by pageviews, top blog posts by CTR, etc. Coming up with a presentation necessitates that the majority of the effort goes into the content and the message you intend to convey. The visuals of a PowerPoint presentation can only be effective if it supplements and supports the story that is being told. Keeping this in mind our experts created Marketers Guide To Data Analysis Optimization Dashboard For Tracking Business Blog Kpis Infographics PDF to reduce the time that goes into designing the presentation. This way, you can concentrate on the message while our designers take care of providing you with the right template for the situation.
This slide covers the dashboard for analyzing blogging KPIs such as performance, published posts, views, new blog subscribers, top blog posts by pageviews, top blog posts by CTR, etc. Retrieve professionally designed Marketing Success Metrics Dashboard For Tracking Business Blog Kpis Brochure PDF to effectively convey your message and captivate your listeners. Save time by selecting pre-made slideshows that are appropriate for various topics, from business to educational purposes. These themes come in many different styles, from creative to corporate, and all of them are easily adjustable and can be edited quickly. Access them as PowerPoint templates or as Google Slides themes. You dont have to go on a hunt for the perfect presentation because Slidegeeks got you covered from everywhere.
This slide covers the KPI dashboard for analyzing SEO metrics such as authority score, organic traffic, organic keywords, paid keywords, ref. Domains, site audit, link-building tool, organic traffic, on-page SEO checker, backlink audit, etc. This Marketing Success Metrics KPI Dashboard For Tracking Seo Analytics Background PDF from Slidegeeks makes it easy to present information on your topic with precision. It provides customization options, so you can make changes to the colors, design, graphics, or any other component to create a unique layout. It is also available for immediate download, so you can begin using it right away. Slidegeeks has done good research to ensure that you have everything you need to make your presentation stand out. Make a name out there for a brilliant performance.
This slide covers the dashboard for analysing paid search metrics such as ad cost, clicks, impressions, click-through rate, cost per conversion, conversion rate, cost per click, etc. Here you can discover an assortment of the finest PowerPoint and Google Slides templates. With these templates, you can create presentations for a variety of purposes while simultaneously providing your audience with an eye-catching visual experience. Download Marketing Success Metrics KPI Dashboard For Tracking Paid Ad Campaign Microsoft PDF to deliver an impeccable presentation. These templates will make your job of preparing presentations much quicker, yet still, maintain a high level of quality. Slidegeeks has experienced researchers who prepare these templates and write high-quality content for you. Later on, you can personalize the content by editing the Marketing Success Metrics KPI Dashboard For Tracking Paid Ad Campaign Microsoft PDF.
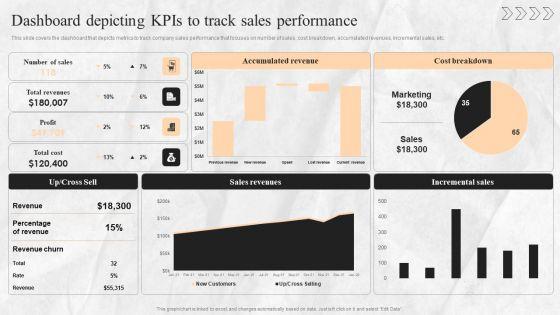

This slide covers the dashboard that depicts metrics to track company sales performance that focuses on number of sales, cost breakdown, accumulated revenues, incremental sales, etc. Are you in need of a template that can accommodate all of your creative concepts This one is crafted professionally and can be altered to fit any style. Use it with Google Slides or PowerPoint. Include striking photographs, symbols, depictions, and other visuals. Fill, move around, or remove text boxes as desired. Test out color palettes and font mixtures. Edit and save your work, or work with colleagues. Download Digital Transition Plan For Managing Business Dashboard Depicting Kpis To Track Sales Performance Guidelines PDF and observe how to make your presentation outstanding. Give an impeccable presentation to your group and make your presentation unforgettable.


This slide covers dashboard to assess results of direct mail campaign. It involves details such as total number of recipients, number of delivered items, re routed and mailing breakdown status. Take your projects to the next level with our ultimate collection of Complete Strategic Manual For Direct Mail Marketing Kpi Dashboard To Track Direct Mail Campaign Results Inspiration PDF. Slidegeeks has designed a range of layouts that are perfect for representing task or activity duration, keeping track of all your deadlines at a glance. Tailor these designs to your exact needs and give them a truly corporate look with your own brand colors they will make your projects stand out from the rest.
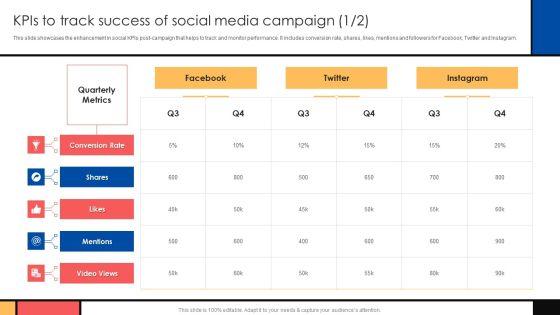
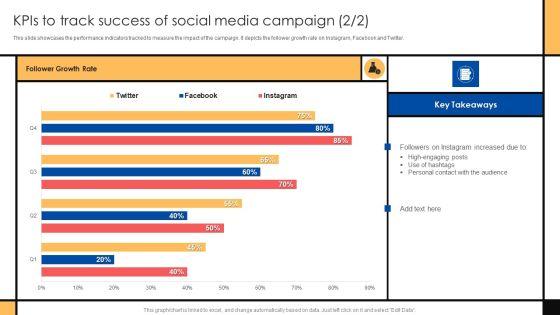
This slide showcases the enhancement in social KPIs post-campaign that helps to track and monitor performance. It includes conversion rate, shares, likes, mentions and followers for Facebook, Twitter and Instagram. Take your projects to the next level with our ultimate collection of Guide To Create Advertising Campaign For Client Engagement Kpis To Track Success Of Social Media Campaign Demonstration PDF. Slidegeeks has designed a range of layouts that are perfect for representing task or activity duration, keeping track of all your deadlines at a glance. Tailor these designs to your exact needs and give them a truly corporate look with your own brand colors they will make your projects stand out from the rest.
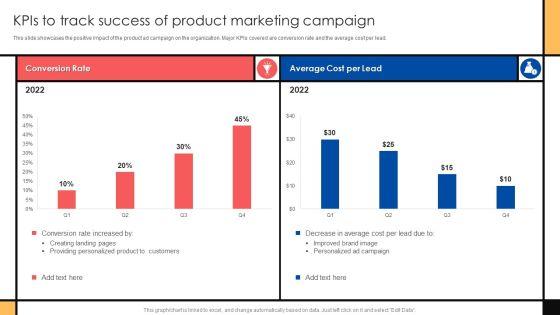
This slide showcases the positive impact of the product ad campaign on the organization. Major KPIs covered are conversion rate and the average cost per lead. Here you can discover an assortment of the finest PowerPoint and Google Slides templates. With these templates, you can create presentations for a variety of purposes while simultaneously providing your audience with an eye catching visual experience. Download Guide To Create Advertising Campaign For Client Engagement Kpis To Track Success Of Product Marketing Campaign Summary PDF to deliver an impeccable presentation. These templates will make your job of preparing presentations much quicker, yet still, maintain a high level of quality. Slidegeeks has experienced researchers who prepare these templates and write high-quality content for you. Later on, you can personalize the content by editing the Guide To Create Advertising Campaign For Client Engagement Kpis To Track Success Of Product Marketing Campaign Summary PDF.


This slide covers the dashboard that depicts metrics to track company sales performance that focuses on number of sales, cost breakdown, accumulated revenues, incremental sales, etc. From laying roadmaps to briefing everything in detail, our templates are perfect for you. You can set the stage with your presentation slides. All you have to do is download these easy-to-edit and customizable templates. Transition Plan For Business Management Dashboard Depicting Kpis To Track Sales Performance Template PDF will help you deliver an outstanding performance that everyone would remember and praise you for. Do download this presentation today.
Do you have to make sure that everyone on your team knows about any specific topic. I yes, then you should give Ecommerce Website Creation Action Steps Playbook Dashboard Tracking Essential Kpis For Ecommerce Download PDF a try. Our experts have put a lot of knowledge and effort into creating this impeccable Ecommerce Website Creation Action Steps Playbook Dashboard Tracking Essential Kpis For Ecommerce Download PDF. You can use this template for your upcoming presentations, as the slides are perfect to represent even the tiniest detail. You can download these templates from the Slidegeeks website and these are easy to edit. So grab these today.
This slide covers project monitoring and control dashboard which can be used by PM. It provides information about metrics such as project health, actual budget, at risk project, start and finish date of the project. Showcasing this set of slides titled Performance Kpi Dashboard For Project Tracking And Control Pictures PDF. The topics addressed in these templates are Finance, Customer Support, Business Development. All the content presented in this PPT design is completely editable. Download it and make adjustments in color, background, font etc. as per your unique business setting.
This slide depicts a dashboard for tracking the banking and financial activities of a business enterprise to measure the income and expenses. The key performing indicators are business accounts, paid, pending and cancelled transactions etc. Pitch your topic with ease and precision using this KPI Dashboard For Tracking Commercial Banking And Financial Activities Download PDF. This layout presents information on KPI Dashboard, Tracking Commercial Banking, Financial Activities. It is also available for immediate download and adjustment. So, changes can be made in the color, design, graphics or any other component to create a unique layout.
This slide covers the dashboard for analysing paid search metrics such as ad cost, clicks, impressions, click-through rate, cost per conversion, conversion rate, cost per click, etc. Do you have to make sure that everyone on your team knows about any specific topic I yes, then you should give Optimizing Marketing Analytics To Enhance Organizational Growth KPI Dashboard For Tracking Inspiration PDF a try. Our experts have put a lot of knowledge and effort into creating this impeccable Optimizing Marketing Analytics To Enhance Organizational Growth KPI Dashboard For Tracking Inspiration PDF. You can use this template for your upcoming presentations, as the slides are perfect to represent even the tiniest detail. You can download these templates from the Slidegeeks website and these are easy to edit. So grab these today.
This slide covers the KPI dashboard for analyzing SEO metrics such as authority score, organic traffic, organic keywords, paid keywords, ref. Domains, site audit, link-building tool, organic traffic, on-page SEO checker, backlink audit, etc. There are so many reasons you need a Optimizing Marketing Analytics To Enhance Organizational Growth KPI Dashboard For Tracking Paid Ad Campaign Template PDF. The first reason is you can not spend time making everything from scratch, Thus, Slidegeeks has made presentation templates for you too. You can easily download these templates from our website easily.
This slide covers the dashboard for analysing email marketing metrics such as overall open rate, click-through rate, click to open ratio, unsubscribe rate, hard bounce rate, soft rate, monthly open rate, total monthly subscribers, etc. Presenting this PowerPoint presentation, titled KPI Dashboard For Tracking Email Marketing Campaign Performance Microsoft PDF, with topics curated by our researchers after extensive research. This editable presentation is available for immediate download and provides attractive features when used. Download now and captivate your audience. Presenting this KPI Dashboard For Tracking Email Marketing Campaign Performance Microsoft PDF. Our researchers have carefully researched and created these slides with all aspects taken into consideration. This is a completely customizable KPI Dashboard For Tracking Email Marketing Campaign Performance Microsoft PDF that is available for immediate downloading. Download now and make an impact on your audience. Highlight the attractive features available with our PPTs.
This slide covers the dashboard for analyzing customer loyalty with metrics such as NPS, loyal customer rate, premium users, CLV, customer churn, revenue churn, net retention, MRR growth, etc. From laying roadmaps to briefing everything in detail, our templates are perfect for you. You can set the stage with your presentation slides. All you have to do is download these easy-to-edit and customizable templates. Increasing Customer Kpi Dashboard For Tracking Customer Retention Download PDF will help you deliver an outstanding performance that everyone would remember and praise you for. Do download this presentation today.


This slide reflects the key performance indicator dashboard to track the performance of safety program. It includes information regarding the total manpower, manhours, unsafe conditions, lost time injuries frequency, injuries severity rate, along with the training hours. Create an editable Security Control Techniques For Real Estate Project KPI Dashboard To Track Safety Program Performance Brochure PDF that communicates your idea and engages your audience. Whether youre presenting a business or an educational presentation, pre-designed presentation templates help save time. Security Control Techniques For Real Estate Project KPI Dashboard To Track Safety Program Performance Brochure PDF is highly customizable and very easy to edit, covering many different styles from creative to business presentations. Slidegeeks has creative team members who have crafted amazing templates. So, go and get them without any delay.
This slide shows dashboard for tracking social media key performance indicators KPIs. It provides details about average social engagement, reactions, comments, shares, clicks, thumbnail, platform, post message, etc. Are you in need of a template that can accommodate all of your creative concepts This one is crafted professionally and can be altered to fit any style. Use it with Google Slides or PowerPoint. Include striking photographs, symbols, depictions, and other visuals. Fill, move around, or remove text boxes as desired. Test out color palettes and font mixtures. Edit and save your work, or work with colleagues. Download Using Social Media Platforms To Enhance Dashboard For Tracking Social Media Kpis Formats PDF and observe how to make your presentation outstanding. Give an impeccable presentation to your group and make your presentation unforgettable.


This slide shows the dashboard which can be used by organization to monitor cloud security. It includes metrics overall progress, risk identified, number of critical incidents, initiatives, incident and threat management etc. Showcasing this set of slides titled KPI Dashboard To Track Performance Of Security For Cloud Based Systems Clipart PDF. The topics addressed in these templates are Kpi Dashboard To Track, Performance Of Security, Cloud Based Systems . All the content presented in this PPT design is completely editable. Download it and make adjustments in color, background, font etc. as per your unique business setting.
This slide represents graph showing key performance indicators tracked by companies for assessment of safety and health performance of their workplace. It includes key metrics such as workforce awareness, safety meetings held, recordable injuries, lost work days, compliance, severity rates etc. Pitch your topic with ease and precision using this Safety And Health Kpis For Tracking Performance Graph Mockup PDF. This layout presents information on Safety And Health, Kpis For Tracking, Performance Graph. It is also available for immediate download and adjustment. So, changes can be made in the color, design, graphics or any other component to create a unique layout.
This slide shows dashboard for tracking social media key performance indicators KPIs. It provides details about average social engagement, reactions, comments, shares, clicks, thumbnail, platform, post message, etc. Want to ace your presentation in front of a live audience Our Social Media Marketing Strategies To Generate Lead Dashboard For Tracking Social Media Kpis Summary PDF can help you do that by engaging all the users towards you. Slidegeeks experts have put their efforts and expertise into creating these impeccable powerpoint presentations so that you can communicate your ideas clearly. Moreover, all the templates are customizable, and easy to edit and downloadable. Use these for both personal and commercial use.


The following slide outlines performance key performance indicator KPI which can be used to evaluate business process automation performance in employee onboarding. The metrics highlighted in the slide are onboarding completion status, hires per office, etc. There are so many reasons you need a BPA Tools For Process Enhancement And Cost Minimization KPI Dashboard To Track Automation Performance In Employee Onboarding Graphics PDF. The first reason is you can not spend time making everything from scratch, Thus, Slidegeeks has made presentation templates for you too. You can easily download these templates from our website easily.
This slide represents the KPI dashboard to track the multiple cost associated with supply chain in food manufacturing industry. It includes information regarding cash to cash cycle in days, carry cost of inventory along with details of net sales. There are so many reasons you need a Food Processing Industry Latest Insights Trends And Analytics KPI Dashboard For Tracking Supply Chain Costs Demonstration PDF. The first reason is you can not spend time making everything from scratch, Thus, Slidegeeks has made presentation templates for you too. You can easily download these templates from our website easily.
This slide represents the KPI dashboard to track the multiple cost associated with supply chain in food manufacturing industry. It includes information regarding cash to cash cycle in days, carry cost of inventory along with details of net sales.Find a pre-designed and impeccable KPI Dashboard For Tracking Supply Chain Costs Industry Analysis Of Food Formats PDF. The templates can ace your presentation without additional effort. You can download these easy-to-edit presentation templates to make your presentation stand out from others. So, what are you waiting for Download the template from Slidegeeks today and give a unique touch to your presentation.
This slide shows dashboard for tracking social media key performance indicators KPIs. It provides details about average social engagement, reactions, comments, shares, clicks, thumbnail, platform, post message, etc. Deliver and pitch your topic in the best possible manner with this Dashboard For Tracking Social Media Kpis Mockup PDF. Use them to share invaluable insights on Social Engagements, Dashboard, Tracking Social Media KPIS and impress your audience. This template can be altered and modified as per your expectations. So, grab it now.
This slide depicts how threat risk will be monitored and threat detection will be done in the organization through web application firewall implementation. Deliver an awe inspiring pitch with this creative WAF Platform Kpis Dashboard For Threat Tracking In WAF Demonstration PDF bundle. Topics like Current Risk Status, Threat Dashboard, Risk By Threats can be discussed with this completely editable template. It is available for immediate download depending on the needs and requirements of the user.
This slide represents the KPI dashboard to track the multiple cost associated with supply chain in food manufacturing industry. It includes information regarding cash to cash cycle in days, carry cost of inventory along with details of net sales.Deliver an awe inspiring pitch with this creative Precooked Food Industry Analysis KPI Dashboard For Tracking Supply Chain Costs Diagrams PDF bundle. Topics like Processing Industry, Food Processing, Manufacturing Industry can be discussed with this completely editable template. It is available for immediate download depending on the needs and requirements of the user.
Mentioned slide portrays KPI dashboard that can be used by organizations to measure their business performance post AI introduction. KPIS covered here are progress, before versus after AI implementation, risks and issues. Deliver and pitch your topic in the best possible manner with this AI Playbook For Business KPI Dashboard For Tracking Business Performance Demonstration PDF. Use them to share invaluable insights on Performance KPIs, Progress, Risk And Issues and impress your audience. This template can be altered and modified as per your expectations. So, grab it now.
This slide shows dashboard for tracking social media key performance indicators KPIs. It provides details about average social engagement, reactions, comments, shares, clicks, thumbnail, platform, post message, etc. Deliver an awe inspiring pitch with this creative Integrating Social Media Tactics Dashboard For Tracking Social Media Kpis Introduction PDF bundle. Topics like Month Upper Fence, Social KPIs, Conversion Rate can be discussed with this completely editable template. It is available for immediate download depending on the needs and requirements of the user.
This slide provides information regarding essential KPIs for ecommerce performance dashboard tracking average bounce rate, new vs. old customers, channel revenue vs. channel acquisitions costs, channel revenue vs. sales, average conversion rate, etc. Deliver an awe inspiring pitch with this creative Dashboard Tracking Essential Kpis For Ecommerce Performance Slides PDF bundle. Topics like Average Bounce Rate, Channel Acquisition Costs, Channel Revenue can be discussed with this completely editable template. It is available for immediate download depending on the needs and requirements of the user.
This slide provides information regarding essential KPIs for ecommerce performance dashboard tracking average bounce rate, new vs. old customers, channel revenue vs. channel acquisitions costs, channel revenue vs. sales, average conversion rate, etc. Deliver an awe inspiring pitch with this creative Strategy Playbook For Ecommerce Business Dashboard Tracking Essential Kpis For Ecommerce Performance Rules PDF bundle. Topics like Returning Customers, Acquisition Cost, Channel Revenue can be discussed with this completely editable template. It is available for immediate download depending on the needs and requirements of the user.
This slide represents the KPI dashboard to track the multiple cost associated with supply chain in food manufacturing industry. It includes information regarding cash to cash cycle in days, carry cost of inventory along with details of net sales. Deliver an awe inspiring pitch with this creative KPI Dashboard For Tracking Supply Chain Costs Inspiration PDF bundle. Topics like Supply Chain Costs, Average Cash, Service can be discussed with this completely editable template. It is available for immediate download depending on the needs and requirements of the user.
This slide covers a touchpoint dashboard with different customer journey stages. It also includes a detailed evaluation of each stage on the basis of experience, importance, etc. Deliver and pitch your topic in the best possible manner with this Online Customer Interaction KPI Dashboard For Tracking Consumer Journey Touchpoints Information PDF. Use them to share invaluable insights on Consumer Journey, Purchasing, Consumer Service and impress your audience. This template can be altered and modified as per your expectations. So, grab it now.
This slide represents the KPI dashboard to track the multiple cost associated with supply chain in food manufacturing industry. It includes information regarding cash to cash cycle in days, carry cost of inventory along with details of net sales. Deliver an awe inspiring pitch with this creative KPI Dashboard For Tracking Supply Chain Costs Ppt Summary Templates PDF bundle. Topics like Supply Chain, Costs vs Sales, Carrying Costs Inventory, Supply Chain Costs can be discussed with this completely editable template. It is available for immediate download depending on the needs and requirements of the user.


This slide shows the dashboard that depicts sales KPIs to track current status which involves won and lost opportunities, revenues and pipeline by territory, sales by different products, etc.Deliver and pitch your topic in the best possible manner with this Sales Process Automation For Revenue Growth Dashboard Depicting Sales Kpis To Track Current Status Introduction PDF. Use them to share invaluable insights on Marketing Effectiveness, Forecast Accuracy, Pipeline Thickness and impress your audience. This template can be altered and modified as per your expectations. So, grab it now.
Following slide illustrates performance monitoring dashboard that can be used by managers to track their developers team efficiency. It also includes details about billable and non billable hours along with task summary.Deliver an awe inspiring pitch with this creative KPI Dashboard For Tracking Project Team Performance Pictures PDF bundle. Topics like Task Summary, Employee Productivity, Project Manager can be discussed with this completely editable template. It is available for immediate download depending on the needs and requirements of the user.
This slide represents the KPI Dashboard to track the Multiple Cost Associated with Supply Chain in Food Manufacturing Industry. It includes information regarding Cash to Cash Cycle in days, Carry Cost of Inventory along with details of Net Sales.Deliver an awe inspiring pitch with this creative Industry Analysis For Food Manufacturing Market KPI Dashboard For Tracking Supply Chain Costs Information PDF bundle. Topics like Carrying Inventory, Supply Costs, Supply Chain can be discussed with this completely editable template. It is available for immediate download depending on the needs and requirements of the user.
This slide shows the KPI dashboard for monitoring the performance of strategy implemented. It covers KPIs such as bookings, location, housekeeping, etc. Pitch your topic with ease and precision using this KPI Dashboard For Tracking Hospitality And Tourism Management Plan Performance Infographics PDF. This layout presents information on Booking Type, Housekeeping, Check In Guest. It is also available for immediate download and adjustment. So, changes can be made in the color, design, graphics or any other component to create a unique layout.
This slide covers checklist for planning event communication. It includes activities such as creating Facebook events, entering into community event calendar, planning event stories and timeline, creating poster, updating information on Facebook, etc. Presenting Effective Company Event Communication Plan Kpis For Tracking Event Communication Success Elements PDF to provide visual cues and insights. Share and navigate important information on five stages that need your due attention. This template can be used to pitch topics like Attendances, Social Media, Website Visits. In addtion, this PPT design contains high resolution images, graphics, etc, that are easily editable and available for immediate download.
Mentioned slide portrays KPI dashboard that can be used by organizations to measure their business performance post AI introduction. KPIS covered here are progress, Before versus After AI Implementation, risks issues.Deliver an awe inspiring pitch with this creative Artificial Intelligence For IT Operations Playbook KPI Dashboard For Tracking Business Performance Slides PDF bundle. Topics like Kpi Dashboard, Tracking Business, Performance can be discussed with this completely editable template. It is available for immediate download depending on the needs and requirements of the user.
This slide showcases app launch success metrics such as beta testing, deadline for creating landing page, application downloads, daily active users, monthly active users, app store rating, retention rate, churn ratio, etc.Presenting Performance Tracking Kpis For 3 Stage App Marketing Plan Pictures PDF to dispense important information. This template comprises three stages. It also presents valuable insights into the topics including Pre Launch Stage, Launch Stage, Post Launch Stage. This is a completely customizable PowerPoint theme that can be put to use immediately. So, download it and address the topic impactfully.
Following slide illustrates performance monitoring dashboard that can be used by managers to track their developers team efficiency. It also includes details about billable and non billable hours along with task summary.Deliver an awe inspiring pitch with this creative playbook for application developers kpi dashboard for tracking project team performance slides pdf bundle. Topics like kpi dashboard for tracking project team performance can be discussed with this completely editable template. It is available for immediate download depending on the needs and requirements of the user.
Following slide illustrates performance monitoring dashboard that can be used by managers to track their developers team efficiency. It also includes details about billable and non-billable hours along with task summary. Deliver an awe inspiring pitch with this creative software developer playbook kpi dashboard for tracking project team performance guidelines pdf bundle. Topics like task milestone, employee productivity, estimated time, actual time can be discussed with this completely editable template. It is available for immediate download depending on the needs and requirements of the user.
Following slide illustrates performance monitoring dashboard that can be used by managers to track their developers team efficiency. It also includes details about billable and non-billable hours along with task summary. Deliver an awe inspiring pitch with this creative guide for software developers kpi dashboard for tracking project team performance guidelines pdf bundle. Topics like task milestone, employee productivity, estimated time, actual time can be discussed with this completely editable template. It is available for immediate download depending on the needs and requirements of the user.
Mentioned slide portrays KPI dashboard that can be used by organizations to measure their business performance post AI introduction. KPIS covered here are progress, Before versus After AI Implementation, risks and issues. Deliver an awe inspiring pitch with this creative artificial intelligence playbook kpi dashboard for tracking business performance formats pdf bundle. Topics like performance kpis, progress, risk and issues can be discussed with this completely editable template. It is available for immediate download depending on the needs and requirements of the user.
This slide provides information regarding essential KPIs for ecommerce performance dashboard tracking average bounce rate, new vs. old customers, channel revenue vs. channel acquisitions costs, channel revenue vs. sales, average conversion rate, etc. Deliver an awe inspiring pitch with this creative retail trading platform dashboard tracking essential kpis for ecommerce performance diagrams pdf bundle. Topics like average bounce rate, average conversion rate, bounce rate, channel revenue sales can be discussed with this completely editable template. It is available for immediate download depending on the needs and requirements of the user.
Mentioned slide portrays KPI dashboard that can be used by organizations to measure their business performance post AI introduction. KPIS covered here are progress, Before versus After AI Implementation, risks and issues. Deliver an awe inspiring pitch with this creative artificial intelligence transformation playbook kpi dashboard for tracking business performance designs pdf bundle. Topics like risk and issues, progress, performance kpis, before versus after all implementation can be discussed with this completely editable template. It is available for immediate download depending on the needs and requirements of the user.
SHOW
- 60
- 120
- 180
DISPLAYING: 60 of 117 Item(s)
Page