 AI PPT Maker
 Templates
 PPT Bundles
 Design Services
 Business PPTs
 Business Plan
 Management
 Strategy
 Introduction PPT
 Roadmap
 Self Introduction
 Timelines
 Process
 Marketing
 Agenda
 Technology
 Medical
 Startup Business Plan
 Cyber Security
 Dashboards
 SWOT
SWOT Proposals
 Education
 Pitch Deck
 Digital Marketing
 KPIs
KPIs Project Management
 Product Management
 Artificial Intelligence
 Target Market
 Communication
 Supply Chain
 Google Slides
 Research Services
 One Pagers
 All Categories
Kpis evaluation PowerPoint Presentation Templates and Google Slides
SHOW
- 60
- 120
- 180
DISPLAYING: 60 of 165 Item(s)
Page


Enhancing Client Experience By Evaluating Kpis Ppt PowerPoint Presentation Complete Deck With Slides
Take advantage of this well-researched and professionally-designed Enhancing Client Experience By Evaluating Kpis Ppt PowerPoint Presentation Complete Deck With Slides to ace your next business meeting. Use this PPT complete deck to impress the management with your ideas for business growth and revenue increase. Use the fifty five slide Template Bundle to leave no stone unturned as you present each step of your process. Employ the visual tools within the slides such as graphs, charts, and tables to ensure that the audience can never look away from the presentation. With attractive visuals, easy to understand structure, and your knowledge, your presentation will have the attention it deserves. Download this PPT Template from the link below.


Induce strategic thinking by presenting this complete deck. Enthrall your audience by deploying this thought provoking PPT deck. It can be downloaded in both standard and widescreen aspect ratios, thus making it a complete package to use and deploy. Convey your thoughts and actions using the forty four slides presented in this complete deck. Additionally, feel free to alter its components like color, graphics, design, etc, to create a great first impression. Grab it now by clicking on the download button below.


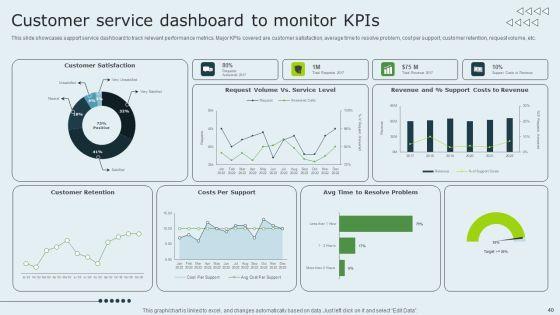
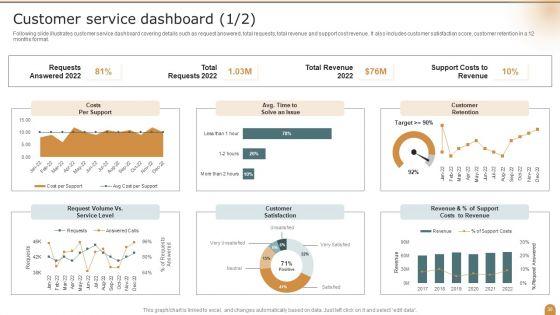
Following slide illustrates customer service dashboard covering details such as request answered, total requests, total revenue and support cost revenue. It also includes customer satisfaction score, customer retention in a 12 months format. Deliver and pitch your topic in the best possible manner with this Customer Service Dashboard Company Performance Evaluation Using KPI Themes PDF. Use them to share invaluable insights on Requests Answered, Total Revenue, Customer Retention and impress your audience. This template can be altered and modified as per your expectations. So, grab it now.


Mentioned slide covers customer satisfaction dashboard with a 12 month format. It includes customer satisfaction details by region and by district. Deliver an awe inspiring pitch with this creative Customer Satisfaction Dashboard Company Performance Evaluation Using KPI Graphics PDF bundle. Topics like Customer Satisfaction, Dashboard, Best Demonstrated can be discussed with this completely editable template. It is available for immediate download depending on the needs and requirements of the user.


Following slide covers cash flow dashboard covering details like beginning cash on hand, cash going in, cash going out, profit loss and ending cash on hand. It also includes detail of accounts receivable and payable. Deliver an awe inspiring pitch with this creative Cash Flow Dashboard Company Performance Evaluation Using KPI Formats PDF bundle. Topics like Beginning Cash, Profit, Cash Flow Dashboard can be discussed with this completely editable template. It is available for immediate download depending on the needs and requirements of the user.


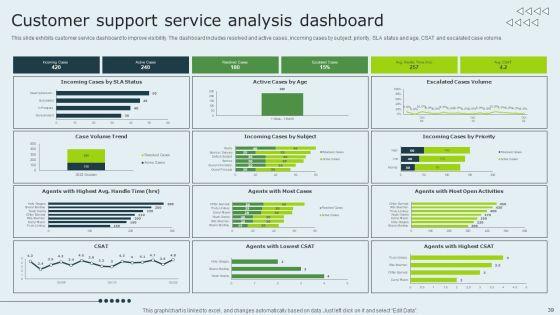
Following slide illustrates customer service dashboard covering details such as request answered, total requests, total revenue and support cost revenue. It also includes customer satisfaction score, customer retention in a 12 months format. Deliver and pitch your topic in the best possible manner with this Kpis For Evaluating Business Sustainability Customer Service Dashboard Designs PDF. Use them to share invaluable insights on Costs Per Support, Customer Retention, Customer Satisfaction and impress your audience. This template can be altered and modified as per your expectations. So, grab it now.


Mentioned slide covers customer satisfaction dashboard with a 12-month format. It includes customer satisfaction details by region and by district. Deliver an awe inspiring pitch with this creative Kpis For Evaluating Business Sustainability Customer Satisfaction Dashboard Clipart PDF bundle. Topics like Best Demonstrated, Worst Demonstrated, 12 Month Trend can be discussed with this completely editable template. It is available for immediate download depending on the needs and requirements of the user.


Following slide covers cash flow dashboard covering details like beginning cash on hand, cash going in, cash going out, profit or loss and ending cash on hand. It also includes detail of accounts receivable and payable. Deliver an awe inspiring pitch with this creative Kpis For Evaluating Business Sustainability Cash Flow Dashboard Background PDF bundle. Topics like Accounts Receivable, Accounts Payable, Cash Flow can be discussed with this completely editable template. It is available for immediate download depending on the needs and requirements of the user.


The following slide depicts email campaign performance analytical dashboard to connect with audience and gather real time insights. It includes elements such as emails sent, unique subscribers, opens, clicks, investment and revenue by campaign type etc. Create an editable Guide For Marketing Analytics To Improve Decisions Email Campaign Performance Evaluation KPI Dashboard Summary PDF that communicates your idea and engages your audience. Whether youre presenting a business or an educational presentation, pre designed presentation templates help save time. Guide For Marketing Analytics To Improve Decisions Email Campaign Performance Evaluation KPI Dashboard Summary PDF is highly customizable and very easy to edit, covering many different styles from creative to business presentations. Slidegeeks has creative team members who have crafted amazing templates. So, go and get them without any delay.


The following slide represents KPI dashboard to evaluate social media results of micromarketing to anticipate campaign responses. It includes elements such as social events, facebook shares, twitter retweets, interactions etc. Are you searching for a Niche Marketing Guide To Target Specific Customer Groups Evaluating Social Media Results With Kpi Dashboard Inspiration PDF that is uncluttered, straightforward, and original Its easy to edit, and you can change the colors to suit your personal or business branding. For a presentation that expresses how much effort you have put in, this template is ideal. With all of its features, including tables, diagrams, statistics, and lists, its perfect for a business plan presentation. Make your ideas more appealing with these professional slides. Download Niche Marketing Guide To Target Specific Customer Groups Evaluating Social Media Results With Kpi Dashboard Inspiration PDF from Slidegeeks today.


The following slide depicts dashboard to measure energy utilization during the year at workplace to gain operational efficiency and develop smart ways to save for future. It includes elements such as progress by segment, transport, waste management, packaging, warehousing etc. Do you know about Slidesgeeks KPI Dashboard To Evaluate Energy Consumption Designs PDF These are perfect for delivering any kind od presentation. Using it, create PowerPoint presentations that communicate your ideas and engage audiences. Save time and effort by using our pre designed presentation templates that are perfect for a wide range of topic. Our vast selection of designs covers a range of styles, from creative to business, and are all highly customizable and easy to edit. Download as a PowerPoint template or use them as Google Slides themes.


The following slide depicts dashboard to evaluate consequences of sustainable marketing on sales performance and plan future actions. It includes key performance indicators such as orders, net profit margin, sales by location, channel, packaging costs, sales price etc. This Evaluating Impact Of Green Marketing With Kpi Dashboard Inspiration PDF from Slidegeeks makes it easy to present information on your topic with precision. It provides customization options, so you can make changes to the colors, design, graphics, or any other component to create a unique layout. It is also available for immediate download, so you can begin using it right away. Slidegeeks has done good research to ensure that you have everything you need to make your presentation stand out. Make a name out there for a brilliant performance.


This slide showcases dashboard that can help organization to evaluate key changes in financial KPIs post fundraising. Its key components are net profit margin, revenue, gross profit margin, debt to equity and return on equity. Do you have to make sure that everyone on your team knows about any specific topic I yes, then you should give Financial Kpi Dashboard To Evaluate Fundraising Impact Topics PDF a try. Our experts have put a lot of knowledge and effort into creating this impeccable Financial Kpi Dashboard To Evaluate Fundraising Impact Topics PDF. You can use this template for your upcoming presentations, as the slides are perfect to represent even the tiniest detail. You can download these templates from the Slidegeeks website and these are easy to edit. So grab these today.


The following slide outlines a comprehensive KPI dashboard which can be used to analyze the performance of Facebook video campaign. It provides information about page video views, page video views organic etc. Formulating a presentation can take up a lot of effort and time, so the content and message should always be the primary focus. The visuals of the PowerPoint can enhance the presenters message, so our KPI Metrics Dashboard To Evaluate Facebook Video Campaign Performance Introduction PDF was created to help save time. Instead of worrying about the design, the presenter can concentrate on the message while our designers work on creating the ideal templates for whatever situation is needed. Slidegeeks has experts for everything from amazing designs to valuable content, we have put everything into KPI Metrics Dashboard To Evaluate Facebook Video Campaign Performance Introduction PDF.


The following slide outlines a comprehensive KPI dashboard which can be used to analyze the performance of Facebook video campaign. It provides information about page video views, page video views organic etc. Whether you have daily or monthly meetings, a brilliant presentation is necessary. Kpi Metrics Dashboard To Evaluate Facebook Video Campaign Performance Information PDF can be your best option for delivering a presentation. Represent everything in detail using Kpi Metrics Dashboard To Evaluate Facebook Video Campaign Performance Information PDF and make yourself stand out in meetings. The template is versatile and follows a structure that will cater to your requirements. All the templates prepared by Slidegeeks are easy to download and edit. Our research experts have taken care of the corporate themes as well. So, give it a try and see the results.


The following slide outlines a performance Key performance indicator dashboard that can be used by the company to analyze the digital marketing campaign performance. The key metrics covered in the slide are total sales, revenue, profit, cost, up-sell and crop sell, incremental sales, etc. Want to ace your presentation in front of a live audience Our Marketing Tactics To Increase KPI Dashboard To Evaluate Online Marketing Campaign Infographics PDF can help you do that by engaging all the users towards you. Slidegeeks experts have put their efforts and expertise into creating these impeccable powerpoint presentations so that you can communicate your ideas clearly. Moreover, all the templates are customizable, and easy-to-edit and downloadable. Use these for both personal and commercial use.


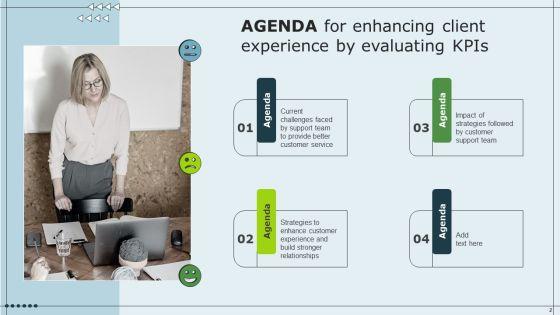
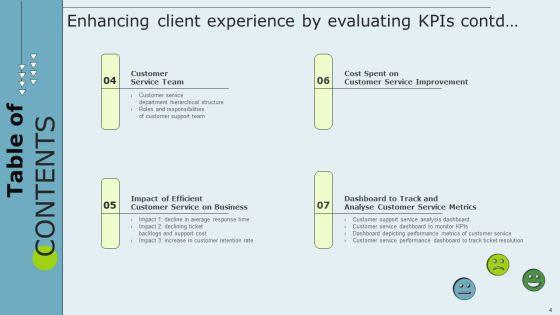
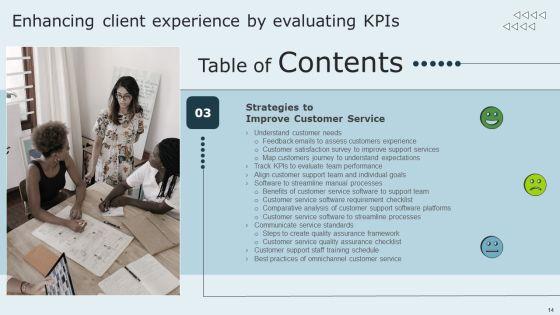
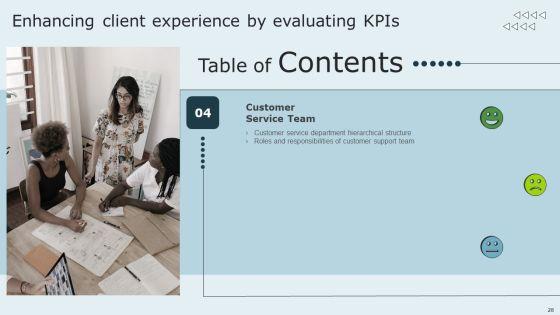
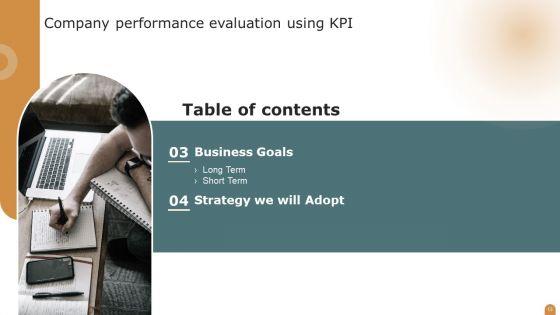
Coming up with a presentation necessitates that the majority of the effort goes into the content and the message you intend to convey. The visuals of a PowerPoint presentation can only be effective if it supplements and supports the story that is being told. Keeping this in mind our experts created Table Of Contents Enhancing Client Experience By Evaluating Kpis Introduction PDF to reduce the time that goes into designing the presentation. This way, you can concentrate on the message while our designers take care of providing you with the right template for the situation.


The following slide outlines the key performance indicator dashboard used by the marketing manager to find out the success rate of the advertising campaign. The major KPIs are total cost, clicks, impressions, conversions, AD impressions etc. Do you have to make sure that everyone on your team knows about any specific topic I yes, then you should give KPI Dashboard To Evaluate Effectiveness Of Digital Advertisement Campaign Pictures PDF a try. Our experts have put a lot of knowledge and effort into creating this impeccable KPI Dashboard To Evaluate Effectiveness Of Digital Advertisement Campaign Pictures PDF. You can use this template for your upcoming presentations, as the slides are perfect to represent even the tiniest detail. You can download these templates from the Slidegeeks website and these are easy to edit. So grab these today.


This slide contains KPI dashboard which can be used by company to track e-commerce sales. It includes kpis such as total orders, order quantity, sales quantity, sales by location, etc. Pitch your topic with ease and precision using this KPI Dashboard To Evaluate Corporate Sales Introduction PDF. This layout presents information on KPI Dashboard, Evaluate Corporate Sales. It is also available for immediate download and adjustment. So, changes can be made in the color, design, graphics or any other component to create a unique layout.


The following slide outlines key performance indicator KPI dashboard which can be used to track the social media marketing campaign performance, post implementing automation. It covers information about the social media followers, page impressions, instagram overview, etc. Retrieve professionally designed Introducing AI Tools Performance KPI Dashboard To Evaluate Social Media Marketing Ideas PDF to effectively convey your message and captivate your listeners. Save time by selecting pre-made slideshows that are appropriate for various topics, from business to educational purposes. These themes come in many different styles, from creative to corporate, and all of them are easily adjustable and can be edited quickly. Access them as PowerPoint templates or as Google Slides themes. You dont have to go on a hunt for the perfect presentation because Slidegeeks got you covered from everywhere.


The following slide showcases key performance indicator dashboard which can be used to measure the performance of new store. It covers information about net sales, sales per square foot, average basket size ABS, total visitors count etc.Create an editable Kpi Dashboard To Evaluate The New Retail Store Performance Opening Retail Store In Untapped Download PDF that communicates your idea and engages your audience. Whether you are presenting a business or an educational presentation, pre-designed presentation templates help save time. Kpi Dashboard To Evaluate The New Retail Store Performance Opening Retail Store In Untapped Download PDF is highly customizable and very easy to edit, covering many different styles from creative to business presentations. Slidegeeks has creative team members who have crafted amazing templates. So, go and get them without any delay.


Mentioned slide showcases KPI dashboard that can be used to check the financial performance of a brand. Metrics covered in the dashboard are return on assets, working capital ratio, return on equity etc.Coming up with a presentation necessitates that the majority of the effort goes into the content and the message you intend to convey. The visuals of a PowerPoint presentation can only be effective if it supplements and supports the story that is being told. Keeping this in mind our experts created Financial KPI Dashboard To Measure Brand Performance Brand And Equity Evaluation Techniques Elements PDF to reduce the time that goes into designing the presentation. This way, you can concentrate on the message while our designers take care of providing you with the right template for the situation.


Mentioned slide showcases KPI dashboard that can be used to check the financial performance of a brand. Metrics covered in the dashboard are return on assets, working capital ratio, return on equity etc.From laying roadmaps to briefing everything in detail, our templates are perfect for you. You can set the stage with your presentation slides. All you have to do is download these easy-to-edit and customizable templates. Brand Awareness Measuring Kpi Dashboard Brand And Equity Evaluation Techniques Ideas PDF will help you deliver an outstanding performance that everyone would remember and praise you for. Do download this presentation today.


This slide represents the KPI dashboard to measure sales pipeline reporting for increasing customer conversion rate. It includes activity by representative, forecast by month and monthly growth. Pitch your topic with ease and precision using this KPI Dashboard To Evaluate Growth In Sales Funnel Reporting Topics PDF. This layout presents information on Pipeline Requirement, Key Activities, Pipeline Closed Date. It is also available for immediate download and adjustment. So, changes can be made in the color, design, graphics or any other component to create a unique layout.


The following slide outlines a comprehensive KPI dashboard which can be used to analyze the performance of Facebook video campaign. It provides information about page video views, page video views organic etc. Coming up with a presentation necessitates that the majority of the effort goes into the content and the message you intend to convey. The visuals of a PowerPoint presentation can only be effective if it supplements and supports the story that is being told. Keeping this in mind our experts created Executing Video Promotional KPI Metrics Dashboard To Evaluate Facebook Video Campaign Summary PDF to reduce the time that goes into designing the presentation. This way, you can concentrate on the message while our designers take care of providing you with the right template for the situation.


This slide showcases dashboard that can help organization to evaluate key changes in financial kpis post fundraising. Its key components are net profit margin, revenue, gross profit margin, debt to equity and return on equity. This Assessing Debt And Equity Fundraising Alternatives For Business Growth Financial KPI Dashboard To Evaluate Infographics PDF is perfect for any presentation, be it in front of clients or colleagues. It is a versatile and stylish solution for organizing your meetings. TheAssessing Debt And Equity Fundraising Alternatives For Business Growth Financial KPI Dashboard To Evaluate Infographics PDF features a modern design for your presentation meetings. The adjustable and customizable slides provide unlimited possibilities for acing up your presentation. Slidegeeks has done all the homework before launching the product for you. So, do not wait, grab the presentation templates today


The following slide outlines a comprehensive key performance indicator KPI dashboard highlighting different financial metrics. The KPIs are quick and current ratio, cash balance, days sales outstanding etc. The best PPT templates are a great way to save time, energy, and resources. Slidegeeks have 100 percent editable powerpoint slides making them incredibly versatile. With these quality presentation templates, you can create a captivating and memorable presentation by combining visually appealing slides and effectively communicating your message. Download Monetary Planning And Evaluation Guide Performance KPI Dashboard To Measure Financial Position Of Organization Ppt File Slides PDF from Slidegeeks and deliver a wonderful presentation.


The following slide outlines key performance indicator KPI dashboard showcasing various financial metrics of the organization. The key metrics are gross revenue, product revenue, service revenue, gross profit, net profit etc. Coming up with a presentation necessitates that the majority of the effort goes into the content and the message you intend to convey. The visuals of a PowerPoint presentation can only be effective if it supplements and supports the story that is being told. Keeping this in mind our experts created Monetary Planning And Evaluation Guide KPI Metrics Dashboard Highlighting Organization Revenue Profitability And Liquidity Ppt Diagram Images PDF to reduce the time that goes into designing the presentation. This way, you can concentrate on the message while our designers take care of providing you with the right template for the situation.


Performance KPI Dashboard To Evaluate Social Media Marketing Performance Post Automation Formats PDF
The following slide outlines key performance indicator KPI dashboard which can be used to track the social media marketing campaign performance, post implementing automation. It covers information about the social media followers, page impressions, instagram overview, etc. Slidegeeks is here to make your presentations a breeze with Performance KPI Dashboard To Evaluate Social Media Marketing Performance Post Automation Formats PDF With our easy to use and customizable templates, you can focus on delivering your ideas rather than worrying about formatting. With a variety of designs to choose from, you are sure to find one that suits your needs. And with animations and unique photos, illustrations, and fonts, you can make your presentation pop. So whether you are giving a sales pitch or presenting to the board, make sure to check out Slidegeeks first.


The following slide outlines a comprehensive KPI dashboard which can be used to analyze the performance of Facebook video campaign. It provides information about page video views, page video views organic etc. The best PPT templates are a great way to save time, energy, and resources. Slidegeeks have 100 percent editable powerpoint slides making them incredibly versatile. With these quality presentation templates, you can create a captivating and memorable presentation by combining visually appealing slides and effectively communicating your message. Download Video Promotion Techniques KPI Metrics Dashboard To Evaluate Facebook Video Introduction PDF from Slidegeeks and deliver a wonderful presentation.


This slide showcases dashboard that can help organization to evaluate key changes in financial KPIs post fundraising. Its key components are net profit margin, revenue, gross profit margin, debt to equity and return on equity. From laying roadmaps to briefing everything in detail, our templates are perfect for you. You can set the stage with your presentation slides. All you have to do is download these easy-to-edit and customizable templates. Financial Kpi Dashboard To Evaluate Fundraising Impact Developing Fundraising Techniques Diagrams PDF will help you deliver an outstanding performance that everyone would remember and praise you for. Do download this presentation today.


This slide showcases dashboard that can help organization to evaluate key changes in financial KPIs post fundraising. Its key components are net profit margin, revenue, gross profit margin, debt to equity and return on equity. There are so many reasons you need a Strategic Fund Acquisition Plan For Business Opertions Expansion Financial KPI Dashboard To Evaluate Fundraising Impact Guidelines PDF. The first reason is you can not spend time making everything from scratch, Thus, Slidegeeks has made presentation templates for you too. You can easily download these templates from our website easily.
The following slide outlines a comprehensive KPI dashboard which can be used to analyze the performance of facebook video campaign. It provides information about page video views, page video views organic etc. Retrieve professionally designed KPI Metrics Dashboard To Evaluate Facebook Video Campaign Performance Icons PDF to effectively convey your message and captivate your listeners. Save time by selecting pre-made slideshows that are appropriate for various topics, from business to educational purposes. These themes come in many different styles, from creative to corporate, and all of them are easily adjustable and can be edited quickly. Access them as PowerPoint templates or as Google Slides themes. You do not have to go on a hunt for the perfect presentation because Slidegeeks got you covered from everywhere.


Following slide illustrates KPI dashboard to measure brand value. KPIs covered are brand value and percentage change, brand value over time, most followed brands on social media.Take your projects to the next level with our ultimate collection of Brand Value Measuring KPI Dashboard Guide To Understand Evaluate And Enhance Brand Value Slides PDF. Slidegeeks has designed a range of layouts that are perfect for representing task or activity duration, keeping track of all your deadlines at a glance. Tailor these designs to your exact needs and give them a truly corporate look with your own brand colors they all make your projects stand out from the rest


This slide signifies the construction project management projection plan. It covers information regarding to the estimate ID, Task, effort hours, resource quantity, performance factor and duration evaluation. Pitch your topic with ease and precision using this Project KPI Dashboard To Monitor Financial Evaluation Background PDF. This layout presents information on Actual Expenses, Payable Account, Budget Allocated. It is also available for immediate download and adjustment. So, changes can be made in the color, design, graphics or any other component to create a unique layout.


This slide signifies the key performance indicator dashboard to evaluate financial estimation. It covers information regarding to expense, payable account and monthly performance. Showcasing this set of slides titled Project KPI Dashboard To Monitor Financial Budget Evaluation Demonstration PDF. The topics addressed in these templates are Project KPI Dashboard, Monitor Financial Budget Evaluation. All the content presented in this PPT design is completely editable. Download it and make adjustments in color, background, font etc. as per your unique business setting.


The following slide outlines key performance indicator KPI dashboard which can be used to track the social media marketing campaign performance, post implementing automation. It covers information about the social media followers, page impressions, instagram overview, etc.Deliver an awe inspiring pitch with this creative Performance KPI Dashboard To Evaluate Social Media Marketing Performance Post Automation Ideas PDF bundle. Topics like Page Impressions, Twitter Favorites, Instagram Overview can be discussed with this completely editable template. It is available for immediate download depending on the needs and requirements of the user.


Mentioned slide covers revenue and employment cost dashboard. It includes details like full time employee number, total employment cost, total revenue and average revenue per FTE. Deliver and pitch your topic in the best possible manner with this Revenue And Employment Cost Dashboard Company Performance Evaluation Using KPI Microsoft PDF. Use them to share invaluable insights on Total Employment, Average Revenue, Dashboard and impress your audience. This template can be altered and modified as per your expectations. So, grab it now.


This slide covers real time utilization dashboard covering logged time such as billable, non-billable, estimated time and scheduled. It also include details of allotted hours to each employee and weekly hours for the assignment. Deliver an awe inspiring pitch with this creative Real Time Utilization Dashboard Company Performance Evaluation Using KPI Clipart PDF bundle. Topics like Real Time, Utilization Dashboard can be discussed with this completely editable template. It is available for immediate download depending on the needs and requirements of the user.


Following slide illustrates profit margin dashboard with a 12 months format. It also includes gross profit margin, operating profit margin and net profit margin. Deliver and pitch your topic in the best possible manner with this Profit Margin Dashboard Company Performance Evaluation Using KPI Elements PDF. Use them to share invaluable insights on Gross Profit Margin, Operating Profit Margin, Net Profit Margin and impress your audience. This template can be altered and modified as per your expectations. So, grab it now.


This slide shows current and future product pricing strategy of the company. In current strategy, company opted cost plus pricing to recover their profits and in future they will opt penetration pricing for capturing market share. Deliver an awe inspiring pitch with this creative Product Pricing Strategy We Will Adopt Company Performance Evaluation Using KPI Slides PDF bundle. Topics like Strategy, Penetration Pricing, Our Company can be discussed with this completely editable template. It is available for immediate download depending on the needs and requirements of the user.


Following slide provides financial details of company including revenue and operating profit. Revenue recorded in FY22 was doller 518,932 while operating profit recorded was doller 481,932. Deliver an awe inspiring pitch with this creative Key Financials Of The Company Company Performance Evaluation Using KPI Rules PDF bundle. Topics like Revenue, Operating Profit, Company can be discussed with this completely editable template. It is available for immediate download depending on the needs and requirements of the user.


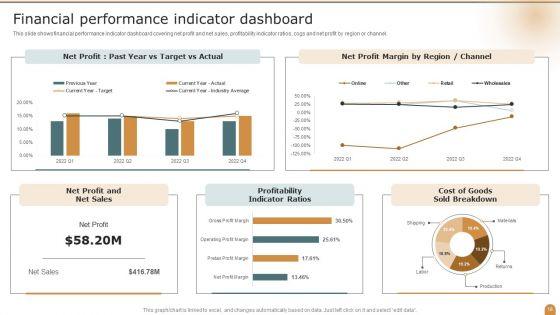
This slide shows financial performance indicator dashboard covering net profit and net sales, profitability indicator ratios, cogs and net profit by region or channel. Deliver and pitch your topic in the best possible manner with this Financial Performance Indicator Dashboard Company Performance Evaluation Using KPI Structure PDF. Use them to share invaluable insights on Financial Performance, Indicator Dashboard, Profitability Indicator and impress your audience. This template can be altered and modified as per your expectations. So, grab it now.


Following slide shows employee engagement and company culture dashboard. It includes employee details, engagement score, total given recognition, previous seven days performance and radar chart to measure employee performance. Deliver an awe inspiring pitch with this creative Employee Engagement And Company Culture Dashboard Company Performance Evaluation Using KPI Pictures PDF bundle. Topics like Employee Engagement, Company, Culture Dashboard can be discussed with this completely editable template. It is available for immediate download depending on the needs and requirements of the user.


Following slide shows employee billable hours dashboard covering total hours capacity, allocated hours billable, total hours worked, and total billable hours worked for the assignment. It also includes details of each team member indulged for same assignment. Deliver and pitch your topic in the best possible manner with this Employee Billable Hours Dashboard Company Performance Evaluation Using KPI Topics PDF. Use them to share invaluable insights on Employee Billable, Hours Dashboard, Budgeted Billings and impress your audience. This template can be altered and modified as per your expectations. So, grab it now.
SHOW
- 60
- 120
- 180
DISPLAYING: 60 of 165 Item(s)
Page