 AI PPT Maker
 Templates
 PPT Bundles
 Design Services
 Business PPTs
 Business Plan
 Management
 Strategy
 Introduction PPT
 Roadmap
 Self Introduction
 Timelines
 Process
 Marketing
 Agenda
 Technology
 Medical
 Startup Business Plan
 Cyber Security
 Dashboards
 SWOT
SWOT Proposals
 Education
 Pitch Deck
 Digital Marketing
 KPIs
KPIs Project Management
 Product Management
 Artificial Intelligence
 Target Market
 Communication
 Supply Chain
 Google Slides
 Research Services
 One Pagers
 All Categories
Kpi analysis PowerPoint Presentation Templates and Google Slides
SHOW
- 60
- 120
- 180
DISPLAYING: 60 of 170 Item(s)
Page


This is a financials stretch plan kpi analysis powerpoint slide show. This is a five stage process. The stages in this process are kpi1, kpi1, kpi3, revenue, cost of sales, gross profit, customer acquisition cost, other operating cost expense, operating profit, change in cash, ending cash, employees ftes.


Presenting this set of slides with name analysis kpi management ppt powerpoint presentation inspiration vector cpb. This is a four stage process. The stages in this process are marketing, business, management, planning, strategy. This is a completely editable PowerPoint presentation and is available for immediate download. Download now and impress your audience.


The following slide outlines a comprehensive visual representation of customer satisfaction CSAT that can assist companies to measure how happy are customers wit the brand. The kpis covered are net promoter score NPS, customer effort score CES, product quality, pricing, etc. Retrieve professionally designed Market Analysis Overview And Different Categories KPI Dashboard To Analyze Customer Satisfaction Elements PDF to effectively convey your message and captivate your listeners. Save time by selecting pre made slideshows that are appropriate for various topics, from business to educational purposes. These themes come in many different styles, from creative to corporate, and all of them are easily adjustable and can be edited quickly. Access them as PowerPoint templates or as Google Slides themes. You do not have to go on a hunt for the perfect presentation because Slidegeeks got you covered from everywhere.


The following slide outlines key performance indicator KPI dashboard that can assist marketers to evaluate brand performance on social media channels. The metrics covered are age group, gender, brand perception, branding themes, celebrity analysis, etc. Present like a pro with Market Analysis Overview And Different Categories Brand Analytics Kpi Dashboard For Organization Rules PDF Create beautiful presentations together with your team, using our easy to use presentation slides. Share your ideas in real time and make changes on the fly by downloading our templates. So whether you are in the office, on the go, or in a remote location, you can stay in sync with your team and present your ideas with confidence. With Slidegeeks presentation got a whole lot easier. Grab these presentations today.


The following slide depicts the data breach trends to minimize information leakage and patch affected system. It includes elements such as breach risk trend, breach by risk category, current and future goal analysis etc. This modern and well arranged Data Breach Trend Analysis With KPI Dashboard Ppt PowerPoint Presentation File Portfolio PDF provides lots of creative possibilities. It is very simple to customize and edit with the Powerpoint Software. Just drag and drop your pictures into the shapes. All facets of this template can be edited with Powerpoint no extra software is necessary. Add your own material, put your images in the places assigned for them, adjust the colors, and then you can show your slides to the world, with an animated slide included.


The following slide showcases green marketing campaign costs assessment to evaluate overall expenses and allocate funds adequately for future. It includes elements such as conversions, clicks, click through rate CTR, Ad group, cost per conversion, expense by location etc. Presenting this PowerPoint presentation, titled Campaign Cost Analysis With Kpi Dashboard Summary PDF, with topics curated by our researchers after extensive research. This editable presentation is available for immediate download and provides attractive features when used. Download now and captivate your audience. Presenting this Campaign Cost Analysis With Kpi Dashboard Summary PDF. Our researchers have carefully researched and created these slides with all aspects taken into consideration. This is a completely customizable Campaign Cost Analysis With Kpi Dashboard Summary PDF that is available for immediate downloading. Download now and make an impact on your audience. Highlight the attractive features available with our PPTs.


This slide covers social media and paid ad campaigns. It includes metrics such as ad spend, cost per thousand, cost per click, click-through rate, ad clicks, and ad reach. Coming up with a presentation necessitates that the majority of the effort goes into the content and the message you intend to convey. The visuals of a PowerPoint presentation can only be effective if it supplements and supports the story that is being told. Keeping this in mind our experts created Marketing Campaign KPI Analysis Dashboard Ppt Inspiration Example File PDF to reduce the time that goes into designing the presentation. This way, you can concentrate on the message while our designers take care of providing you with the right template for the situation.
This slide covers a dashboard for analyzing the metrics of the website landing page. It includes KPIs such as conversions, conversion rate, sessions, bounce rate, engagement sickness, etc. Present like a pro with Marketers Guide To Data Analysis Optimization Website Landing Page KPI Tracking Dashboard Information PDF Create beautiful presentations together with your team, using our easy to use presentation slides. Share your ideas in real time and make changes on the fly by downloading our templates. So whether you are in the office, on the go, or in a remote location, you can stay in sync with your team and present your ideas with confidence. With Slidegeeks presentation got a whole lot easier. Grab these presentations today.
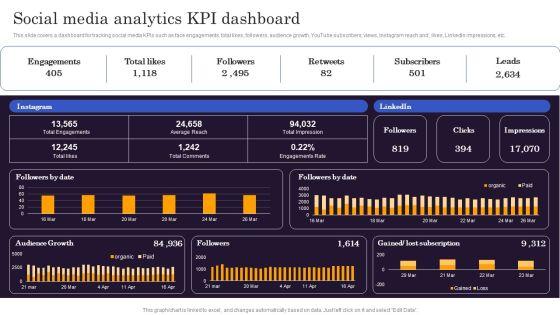

This slide covers a dashboard for tracking social media KPIs such as face engagements, total likes, followers, audience growth, YouTube subscribers, views, Instagram reach and , likes, LinkedIn impressions, etc. Find a pre designed and impeccable Marketers Guide To Data Analysis Optimization Social Media Analytics KPI Dashboard Clipart PDF. The templates can ace your presentation without additional effort. You can download these easy to edit presentation templates to make your presentation stand out from others. So, what are you waiting for Download the template from Slidegeeks today and give a unique touch to your presentation.
This slide covers the KPI dashboard for analyzing SEO metrics such as authority score, organic traffic, organic keywords, paid keywords, ref. Domains, site audit, link-building tool, organic traffic, on-page SEO checker, backlink audit, etc. This Marketers Guide To Data Analysis Optimization KPI Dashboard For Tracking SEO Analytics Template PDF from Slidegeeks makes it easy to present information on your topic with precision. It provides customization options, so you can make changes to the colors, design, graphics, or any other component to create a unique layout. It is also available for immediate download, so you can begin using it right away. Slidegeeks has done good research to ensure that you have everything you need to make your presentation stand out. Make a name out there for a brilliant performance.
This slide covers the dashboard for analyzing paid search metrics such as ad cost, clicks, impressions, click-through rate, cost per conversion, conversion rate, cost per click, etc. Here you can discover an assortment of the finest PowerPoint and Google Slides templates. With these templates, you can create presentations for a variety of purposes while simultaneously providing your audience with an eye catching visual experience. Download Marketers Guide To Data Analysis Optimization KPI Dashboard For Tracking Paid Ad Campaign Performance Clipart PDF to deliver an impeccable presentation. These templates will make your job of preparing presentations much quicker, yet still, maintain a high level of quality. Slidegeeks has experienced researchers who prepare these templates and write high quality content for you. Later on, you can personalize the content by editing the Marketers Guide To Data Analysis Optimization KPI Dashboard For Tracking Paid Ad Campaign Performance Clipart PDF.
This slide covers the dashboard for analyzing email marketing metrics such as overall open rate, click-through rate, click-to-open ratio, unsubscribe rate, hard bounce rate, soft rate, monthly open rate, total monthly subscribers, etc. Presenting this PowerPoint presentation, titled Marketers Guide To Data Analysis Optimization KPI Dashboard For Tracking Email Marketing Campaign Infographics PDF, with topics curated by our researchers after extensive research. This editable presentation is available for immediate download and provides attractive features when used. Download now and captivate your audience. Presenting this Marketers Guide To Data Analysis Optimization KPI Dashboard For Tracking Email Marketing Campaign Infographics PDF. Our researchers have carefully researched and created these slides with all aspects taken into consideration. This is a completely customizable Marketers Guide To Data Analysis Optimization KPI Dashboard For Tracking Email Marketing Campaign Infographics PDF that is available for immediate downloading. Download now and make an impact on your audience. Highlight the attractive features available with our PPTs.
This slide covers the dashboard for analyzing blogging KPIs such as performance, published posts, views, new blog subscribers, top blog posts by pageviews, top blog posts by CTR, etc. Coming up with a presentation necessitates that the majority of the effort goes into the content and the message you intend to convey. The visuals of a PowerPoint presentation can only be effective if it supplements and supports the story that is being told. Keeping this in mind our experts created Marketers Guide To Data Analysis Optimization Dashboard For Tracking Business Blog Kpis Infographics PDF to reduce the time that goes into designing the presentation. This way, you can concentrate on the message while our designers take care of providing you with the right template for the situation.


This slide displays project health indicators to review and compare companys performance with quality parameters decided by management. It includes details about project schedule, tasks, budget and resources. Showcasing this set of slides titled Quality Kpis Dashboard With Project Portfolio Analysis Download PDF. The topics addressed in these templates are Schedule, Tasks, Budget, Resources. All the content presented in this PPT design is completely editable. Download it and make adjustments in color, background, font etc. as per your unique business setting.
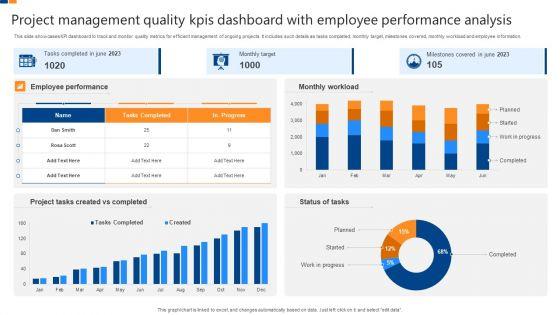

This slide showcases KPI dashboard to track and monitor quality metrics for efficient management of ongoing projects. It includes such details as tasks completed, monthly target, milestones covered, monthly workload and employee information. Showcasing this set of slides titled Project Management Quality Kpis Dashboard With Employee Performance Analysis Professional PDF. The topics addressed in these templates are Employee Performance, Monthly Workload, Milestones Covered, Monthly Target, Project Tasks Created Completed. All the content presented in this PPT design is completely editable. Download it and make adjustments in color, background, font etc. as per your unique business setting.


The following slide depicts targeted customer profile to address their challenges and track their interactions. It includes element such as brands, timeline, activities, average spending, visits, engagement score, interests, customer lifetime value CLV etc. The best PPT templates are a great way to save time, energy, and resources. Slidegeeks have 100 percent editable powerpoint slides making them incredibly versatile. With these quality presentation templates, you can create a captivating and memorable presentation by combining visually appealing slides and effectively communicating your message. Download Comprehensive Customer Data Platform Guide Optimizing Promotional Initiatives Customer Profile Analysis KPI Dashboard Pictures PDF from Slidegeeks and deliver a wonderful presentation.


The following slide showcases customer behavior assessment to gain competitive advantages and analyze their purchase pattern. It includes elements such as visitors, by device, page views, top pages, domains etc. Coming up with a presentation necessitates that the majority of the effort goes into the content and the message you intend to convey. The visuals of a PowerPoint presentation can only be effective if it supplements and supports the story that is being told. Keeping this in mind our experts created Comprehensive Customer Data Platform Guide Optimizing Promotional Initiatives Customer Behaviour Analysis KPI Brochure PDF to reduce the time that goes into designing the presentation. This way, you can concentrate on the message while our designers take care of providing you with the right template for the situation.


This slide represents the dashboard representing key metrics to analyze the performance of overall workforce. It includes details related to absence rate, benefits satisfaction, engagement index etc. Here you can discover an assortment of the finest PowerPoint and Google Slides templates. With these templates, you can create presentations for a variety of purposes while simultaneously providing your audience with an eye-catching visual experience. Download Tools For HR Business Analytics Workforce Performance Analysis KPI Dashboard Pictures PDF to deliver an impeccable presentation. These templates will make your job of preparing presentations much quicker, yet still, maintain a high level of quality. Slidegeeks has experienced researchers who prepare these templates and write high-quality content for you. Later on, you can personalize the content by editing the Tools For HR Business Analytics Workforce Performance Analysis KPI Dashboard Pictures PDF.


The following slide depicts the website analysis dashboard to get better visibility over search engines. It mainly includes key performance indicators such as sessions, users, page views, sources of traffic, phone call to actions etc. Want to ace your presentation in front of a live audience Our Search Engine Marketing Website Traffic Analysis With KPI Dashboard Brochure PDF can help you do that by engaging all the users towards you.. Slidegeeks experts have put their efforts and expertise into creating these impeccable powerpoint presentations so that you can communicate your ideas clearly. Moreover, all the templates are customizable, and easy-to-edit and downloadable. Use these for both personal and commercial use.


The following slide depicts the campaign keyword results to grab valuable insights and refine targeting. It includes key performance indicators such as cost per lead, total page likes, exit rate, organic click through rate, website traffic average ranking etc. Get a simple yet stunning designed Search Engine Marketing Keyword Performance Analysis With Kpi Dashboard Brochure PDF. It is the best one to establish the tone in your meetings. It is an excellent way to make your presentations highly effective. So, download this PPT today from Slidegeeks and see the positive impacts. Our easy-to-edit Search Engine Marketing Keyword Performance Analysis With Kpi Dashboard Brochure PDF can be your go-to option for all upcoming conferences and meetings. So, what are you waiting for Grab this template today.


This slide depicts the dashboard used to analyze the key performance indicators of the revenue planning process. The purpose of this template is to evaluate the revenue based on the actual and budget specified. It includes information related to the product, total, actual and budget revenue. Showcasing this set of slides titled KPI Analysis Of Revenue Planning Procedure Professional PDF. The topics addressed in these templates are Kpi Analysis, Revenue Planning Procedure. All the content presented in this PPT design is completely editable. Download it and make adjustments in color, background, font etc. as per your unique business setting.


Mentioned slide illustrates KPI dashboard that can be used by managers to assess financial health of supply chain business. KPIs covered are supply chain costs versus sales, cash to order cycle, warehouse operating cost distribution etc.Coming up with a presentation necessitates that the majority of the effort goes into the content and the message you intend to convey. The visuals of a PowerPoint presentation can only be effective if it supplements and supports the story that is being told. Keeping this in mind our experts created Supply Chain Kpi Dashboard For Effective Financial Analysis Stand Out Digital Supply Chain Tactics Enhancing Graphics PDF to reduce the time that goes into designing the presentation. This way, you can concentrate on the message while our designers take care of providing you with the right template for the situation.


This slide provides dashboard showcasing product development project overview with completion status. It provides information regarding cash flow statements, completion progress, project overview and product approval status. Pitch your topic with ease and precision using this KPI Dashboard Showcasing Product Management Revenue Analysis Portrait PDF. This layout presents information on Completion Progress, Product Approval Status, Cash Flow Statements. It is also available for immediate download and adjustment. So, changes can be made in the color, design, graphics or any other component to create a unique layout.


Showcasing this set of slides titled Revenue And Expense Budget Deficit Analysis With KPI Dashboard Rules PDF. The topics addressed in these templates are Revenue And Expense, Budget Deficit Analysis. All the content presented in this PPT design is completely editable. Download it and make adjustments in color, background, font etc. as per your unique business setting.


The following slide presents a hiring assessment dashboard to manage HR metrics. It includes KPIs such as average time taken, cost required in hiring process along with the major sources of recruitment etc. Pitch your topic with ease and precision using this Employee Recruitment Analysis KPI Dashboard Slides PDF. This layout presents information on Agile Hiring, Non Agile Hiring, Hiring Cost Assessment. It is also available for immediate download and adjustment. So, changes can be made in the color, design, graphics or any other component to create a unique layout.


Showcasing this set of slides titled E Mail Marketing Campaign Outcomes Kpis Result Analysis Mockup PDF. The topics addressed in these templates are Marketing Campaign, Outcomes Kpis, Result Analysis. All the content presented in this PPT design is completely editable. Download it and make adjustments in color, background, font etc. as per your unique business setting.


This slide includes profit and loss analysis dashboard with cost breakdown KPI. The kpis used herein are revenue, COGS, expenditure and net profit.Pitch your topic with ease and precision using this Monthly Profit And Loss Analysis Reports Dashboard With Cost Breakdown Kpi Structure PDF. This layout presents information on Revenue Expenditure, Net Profit, Total Exprnses. It is also available for immediate download and adjustment. So, changes can be made in the color, design, graphics or any other component to create a unique layout.


Showcasing this set of slides titled Financial KPI Dashboard With Profit And Loss Analysis Designs PDF. The topics addressed in these templates are Assets And Liabilities, Cash Flow Analysis, Income And Expenses. All the content presented in this PPT design is completely editable. Download it and make adjustments in color, background, font etc. as per your unique business setting.


BI Implementation To Enhance Hiring Process Workforce Performance Analysis Kpi Dashboard Formats PDF
This slide represents the dashboard representing key metrics to analyze the performance of overall workforce. It includes details related to absence rate, benefits satisfaction, engagement index etc.Are you in need of a template that can accommodate all of your creative concepts This one is crafted professionally and can be altered to fit any style. Use it with Google Slides or PowerPoint. Include striking photographs, symbols, depictions, and other visuals. Fill, move around, or remove text boxes as desired. Test out color palettes and font mixtures. Edit and save your work, or work with colleagues. Download BI Implementation To Enhance Hiring Process Workforce Performance Analysis Kpi Dashboard Formats PDF and observe how to make your presentation outstanding. Give an impeccable presentation to your group and make your presentation unforgettable.


The following slide depicts the KPIs of product to assess consumers behaviour in making decisions based on its characteristics. It includes elements such as price, security, usefulness etc.Showcasing this set of slides titled Product Attributes Analysis KPI Dashboard Graphics PDF. The topics addressed in these templates are Characteristics, Product Attributes, Analysis KPI Dashboard. All the content presented in this PPT design is completely editable. Download it and make adjustments in color, background, font etc. as per your unique business setting.


This showcases KPI dashboard the can help organization to evaluate the financial performance and analyze the liquidity ratios. Its key components are vendor payment error rate, budget variance and cash conversion cycle. Showcasing this set of slides titled. The topics addressed in these templates are Quick Status, Workning Capital, Budget Variance. All the content presented in this PPT design is completely editable. Download it and make adjustments in color, background, font etc. as per your unique business setting.


This slide shows dashboard which can be used by organizations to monitor ecommerce revenue analysis. It includes metrics such as orders, purchases, delivery status etc. Pitch your topic with ease and precision using this KPI Dashboard To Track E Commerce Business Revenue Analysis Rules PDF. This layout presents information on Total Purchases, Total Sales, Pending Delivery, Collection. It is also available for immediate download and adjustment. So, changes can be made in the color, design, graphics or any other component to create a unique layout.


This slide shows the key performance indicators dashboard which can be used to analyze current financial position of e-commerce business. It includes metrics such as revenue, expenses, profit, cash in hand, etc. Showcasing this set of slides titled KPI Dashboard To Monitor E Commerce Revenue Analysis Performance Mockup PDF. The topics addressed in these templates are Accounts Receivable, Accounts Payable, Revenue, Expenses. All the content presented in this PPT design is completely editable. Download it and make adjustments in color, background, font etc. as per your unique business setting.


This slide covers the multiple types of risks under the cyber security that could hinder the process and break the security. It also includes the critical risk events with the weighted index percent for three months and the value of risks involved or occurred during these months. Showcasing this set of slides titled Information Technology Security KPI Dashboard With Risk Analysis Topics PDF. The topics addressed in these templates are Critical Risk Events, Weighted Risk Index, Important Risk Events. All the content presented in this PPT design is completely editable. Download it and make adjustments in color, background, font etc. as per your unique business setting.
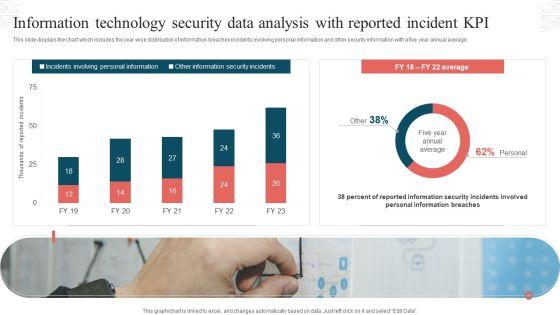

This slide displays the chart which includes the year wise distribution of information breaches incidents involving personal information and other security information with a five year annual average. Showcasing this set of slides titled Information Technology Security Data Analysis With Reported Incident KPI Download PDF. The topics addressed in these templates are Incidents Involving, Personal Information, Other Information, Security Incidents. All the content presented in this PPT design is completely editable. Download it and make adjustments in color, background, font etc. as per your unique business setting.


This slide represents the dashboard representing key metrics to analyze the performance of overall workforce. It includes details related to absence rate, benefits satisfaction, engagement index etc. Find a pre-designed and impeccable Human Resource Analytics Workforce Performance Analysis KPI Dashboard Structure PDF. The templates can ace your presentation without additional effort. You can download these easy-to-edit presentation templates to make your presentation stand out from others. So, what are you waiting for Download the template from Slidegeeks today and give a unique touch to your presentation.


This slide represents the dashboard representing key metrics to analyze the performance of overall workforce. It includes details related to absence rate, benefits satisfaction, engagement index etc. Take your projects to the next level with our ultimate collection of Business Analytics Application Workforce Performance Analysis KPI Dashboard Template PDF. Slidegeeks has designed a range of layouts that are perfect for representing task or activity duration, keeping track of all your deadlines at a glance. Tailor these designs to your exact needs and give them a truly corporate look with your own brand colors theyll make your projects stand out from the rest.
This slide represents the KPI dashboard to track the multiple cost associated with supply chain in food manufacturing industry. It includes information regarding cash to cash cycle in days, carry cost of inventory along with details of net sales.Find a pre-designed and impeccable KPI Dashboard For Tracking Supply Chain Costs Industry Analysis Of Food Formats PDF. The templates can ace your presentation without additional effort. You can download these easy-to-edit presentation templates to make your presentation stand out from others. So, what are you waiting for Download the template from Slidegeeks today and give a unique touch to your presentation.


The following slide highlights various key performance indicators to ensure successful information technology IT project completion. It also includes components such as risks, status, budget, deadlines, average task handle time, overdue activities etc. Pitch your topic with ease and precision using this Information Technology Project Analysis With Kpi Dashboard Portrait PDF. This layout presents information on Planning Completed, Design Completed, Development . It is also available for immediate download and adjustment. So, changes can be made in the color, design, graphics or any other component to create a unique layout.


The following slide highlights some kpas of cyber security incidents to evaluate and monitor threats. It includes elements such as open incidents, warnings by severity, average response time, warnings pending for inspection etc. Showcasing this set of slides titled Cyber Protection Incident And Privacy Analysis With KPI Dashboard Ideas PDF. The topics addressed in these templates are Cyber Protection Incident, Privacy Analysis, KPI Dashboard. All the content presented in this PPT design is completely editable. Download it and make adjustments in color, background, font etc. as per your unique business setting.


This slide showcases KPI dashboard for project planning and resource allocation. It also include metrics such as invested amount, return amount, NPV, return to investor, annualized IRR, ROI, payback period, etc. Pitch your topic with ease and precision using this Investment Project Performance Analysis KPI Dashboard Professional PDF. This layout presents information on Project Cash Flows, Project Performance, Innovation Lab. It is also available for immediate download and adjustment. So, changes can be made in the color, design, graphics or any other component to create a unique layout.


This slide displays KPI dashboard for project health analysis. It also include metrics such as total projects, cost, progress, status, projects by highest actual hours, highest actual labour cost, highest actual non-labour cost, etc. Pitch your topic with ease and precision using this Investment Project KPI Dashboard With Labor Hour And Cost Analysis Portrait PDF. This layout presents information on Project Health, Project Progress, Project Status. It is also available for immediate download and adjustment. So, changes can be made in the color, design, graphics or any other component to create a unique layout.


This slide covers capital project KPI tracking dashboard. It also include metrics such as production vs. target quantity, manufacturing, runtime vs. downtime, production cost, overall equipment effectiveness, etc. Showcasing this set of slides titled Investment Project KPI Dashboard For Production Analysis Ideas PDF. The topics addressed in these templates are Project, Performance, Quality, Overall Equipment Effectiveness. All the content presented in this PPT design is completely editable. Download it and make adjustments in color, background, font etc. as per your unique business setting.


This slide shows KPI dashboard of human resources in company. It includes male female ratio, employees in each department, age distribution, tenure, employment status etc. Showcasing this set of slides titled KPI Dashboard Of Organizational Employee Headcount Analysis Ppt PowerPoint Presentation Styles Show PDF. The topics addressed in these templates are Support Software, Engineer Success, Sales Executive. All the content presented in this PPT design is completely editable. Download it and make adjustments in color, background, font etc. as per your unique business setting.


This slide defines the analysis dashboard for recruitment key performance indicators KPIs and its status details. It includes information related to recruitment funnel, hiring details, application sources, etc. Showcasing this set of slides titled Hiring KPI Analysis And Status Update Ppt PowerPoint Presentation Gallery Show PDF. The topics addressed in these templates are Recruitment Funnel, Monthly Metrics, Active Pipeline. All the content presented in this PPT design is completely editable. Download it and make adjustments in color, background, font etc. as per your unique business setting.


The following slide depicts the KPAs of medical and healthcare administration to manage and remit services. It includes KPIs such as numbers of doctors, numbers of patients, monthly patient analysis, upcoming appointments etc. Showcasing this set of slides titled Medical Administration Analysis With KPI Dashboard Clipart PDF. The topics addressed in these templates are Patient Analysis, Higher Than, Upcoming Appointments. All the content presented in this PPT design is completely editable. Download it and make adjustments in color, background, font etc. as per your unique business setting.


Following slide shows detailed competitive landscape analysis based on different criteria such as founded year, number of employees, investor funding, operating profit and net profit margin. Deliver and pitch your topic in the best possible manner with this Competitive Landscape Analysis Company Specific Company Performance Evaluation Using KPI Elements PDF. Use them to share invaluable insights on Parameter, Our Company, Competitor and impress your audience. This template can be altered and modified as per your expectations. So, grab it now.
This slide represents the KPI dashboard to track the multiple cost associated with supply chain in food manufacturing industry. It includes information regarding cash to cash cycle in days, carry cost of inventory along with details of net sales.Deliver an awe inspiring pitch with this creative Precooked Food Industry Analysis KPI Dashboard For Tracking Supply Chain Costs Diagrams PDF bundle. Topics like Processing Industry, Food Processing, Manufacturing Industry can be discussed with this completely editable template. It is available for immediate download depending on the needs and requirements of the user.


This slide depicts website analytics dashboard. It depicts details such as number of sessions, views, users, average website bounces and new sessions etc. Showcasing this set of slides titled Web Analysis Summary KPI Dashboards With Globally Sessions Mockup PDF. The topics addressed in these templates are Website Analytics, Metrics, Website Performance. All the content presented in this PPT design is completely editable. Download it and make adjustments in color, background, font etc. as per your unique business setting.


This slide covers website analytics report KPI dashboard to track website performance. It involves details such as total number of visits, visit trends by medium, pagers per visit and new vs returning visitors. Pitch your topic with ease and precision using this Web Analysis Summary KPI Dashboard With Visit Trends Professional PDF. This layout presents information on Web Analysis Summary, KPI Dashboard, Visit Trends. It is also available for immediate download and adjustment. So, changes can be made in the color, design, graphics or any other component to create a unique layout.


This slide depicts website analytics report KPI dashboard to track progress. It involves sessions details, major sources, sessions and pageviews, traffic sources etc. Showcasing this set of slides titled Web Analysis Summary KPI Dashboard With Traffic Sources Portrait PDF. The topics addressed in these templates are Web Analysis Summary, KPI Dashboard, Traffic Sources. All the content presented in this PPT design is completely editable. Download it and make adjustments in color, background, font etc. as per your unique business setting.


This slide depicts website analytics report dashboard to determine performance. It involves details such as total conversions, number of total users, conversion and engagement rate. Pitch your topic with ease and precision using this Web Analysis Summary KPI Dashboard With Conversion Rate Themes PDF. This layout presents information on Web Analysis Summary, KPI Dashboard, Conversion Rate. It is also available for immediate download and adjustment. So, changes can be made in the color, design, graphics or any other component to create a unique layout.


This slide covers dashboard of website analytics report to track number of visitors on website by different country and city. It involves visitors, website performance, website metrics, visits by sources and devices. Showcasing this set of slides titled Web Analysis Summary KPI Dashboard Template PDF. The topics addressed in these templates are Website Metrics, Website Performance, Visitor Metrics. All the content presented in this PPT design is completely editable. Download it and make adjustments in color, background, font etc. as per your unique business setting.


Following slide shows detailed competitive landscape analysis based on different criteria such as founded year, number of employees, investor funding, operating profit and net profit margin. Presenting Kpis For Evaluating Business Sustainability Competitive Landscape Analysis Company Infographics PDF to provide visual cues and insights. Share and navigate important information on four stages that need your due attention. This template can be used to pitch topics like Number Employees, Investor Funding, Operating Profit, Net Profit Margin. In addtion, this PPT design contains high resolution images, graphics, etc, that are easily editable and available for immediate download.
SHOW
- 60
- 120
- 180
DISPLAYING: 60 of 170 Item(s)
Page