- Sign up
- Sign In
 AI PPT Maker
 Templates
 PPT Bundles
 Design Services
 Business PPTs
 Business Plan
 Management
 Strategy
 Introduction PPT
 Roadmap
 Self Introduction
 Timelines
 Process
 Marketing
 Agenda
 Technology
 Medical
 Startup Business Plan
 Cyber Security
 Dashboards
 SWOT
SWOT Proposals
 Education
 Pitch Deck
 Digital Marketing
 KPIs
KPIs Project Management
 Product Management
 Artificial Intelligence
 Target Market
 Communication
 Supply Chain
 Google Slides
 Research Services
 One Pagers
 All Categories
Key statistics highlighting PowerPoint Presentation Templates and Google Slides
35 Item(s)


The purpose of this slide is to graphically represent the average staff turnover rate in multiple industries. The industries covered in the slide are construction, manufacturing, transportation, information, financial, hospitality, and health services along with key observations. Want to ace your presentation in front of a live audience Our Staff Retention Techniques To Minimize Hiring Expenses Key Statistics Highlighting Average Employee Turnover Clipart PDF can help you do that by engaging all the users towards you. Slidegeeks experts have put their efforts and expertise into creating these impeccable powerpoint presentations so that you can communicate your ideas clearly. Moreover, all the templates are customizable, and easy to edit and downloadable. Use these for both personal and commercial use.


The purpose of this slide is to graphically represent the average staff turnover rate in multiple industries. The industries covered in the slide are construction, manufacturing, transportation, information, financial, hospitality, and health services along with key observations. Want to ace your presentation in front of a live audience Our Effective Strategies For Retaining Healthcare Staff Key Statistics Highlighting Average Employee Turnover Rate Brochure PDF can help you do that by engaging all the users towards you. Slidegeeks experts have put their efforts and expertise into creating these impeccable powerpoint presentations so that you can communicate your ideas clearly. Moreover, all the templates are customizable, and easy to edit and downloadable. Use these for both personal and commercial use.


The purpose of this slide is to graphically represent the average staff turnover rate in multiple industries. The industries covered in the slide are construction, manufacturing, transportation, information, financial, hospitality, and health services along with key observations. Here you can discover an assortment of the finest PowerPoint and Google Slides templates. With these templates, you can create presentations for a variety of purposes while simultaneously providing your audience with an eye catching visual experience. Download Key Statistics Highlighting Average Employee Turnover Rate In Different Industries Template PDF to deliver an impeccable presentation. These templates will make your job of preparing presentations much quicker, yet still, maintain a high level of quality. Slidegeeks has experienced researchers who prepare these templates and write high quality content for you. Later on, you can personalize the content by editing the Key Statistics Highlighting Average Employee Turnover Rate In Different Industries Template PDF.


The following slide exhibits major statistics illustrating the different risks faced by the real estate owners and managers in two years. Information covered in this slide is related to physical property damager, tenant risks, administrative risks, cyber risks and employment issues. Find highly impressive Successful Risk Administration Key Statistics Highlighting Various Risks Faced By Real Estate Summary PDF on Slidegeeks to deliver a meaningful presentation. You can save an ample amount of time using these presentation templates. No need to worry to prepare everything from scratch because Slidegeeks experts have already done a huge research and work for you. You need to download Successful Risk Administration Key Statistics Highlighting Various Risks Faced By Real Estate Summary PDF for your upcoming presentation. All the presentation templates are 100 percent editable and you can change the color and personalize the content accordingly. Download now.


The following slide outlines activity ratios which can be used by financial managers to analyze the organization efficiency in utilizing the assets. It contains detailed Information about inventory and total assets turnover ratio. Retrieve professionally designed Methods And Approaches To Assess Key Statistics Highlighting Major Types Of Activity Ratios Download PDF to effectively convey your message and captivate your listeners. Save time by selecting pre-made slideshows that are appropriate for various topics, from business to educational purposes. These themes come in many different styles, from creative to corporate, and all of them are easily adjustable and can be edited quickly. Access them as PowerPoint templates or as Google Slides themes. You do not have to go on a hunt for the perfect presentation because Slidegeeks got you covered from everywhere.


The purpose of this slide is to graphically represent the average staff turnover rate in multiple industries. The industries covered in the slide are construction, manufacturing, transportation, information, financial, hospitality, and health services along with key observations. Want to ace your presentation in front of a live audience Our Key Statistics Highlighting Average Employee Turnover Rate In Different Industries Formats PDF can help you do that by engaging all the users towards you. Slidegeeks experts have put their efforts and expertise into creating these impeccable powerpoint presentations so that you can communicate your ideas clearly. Moreover, all the templates are customizable, and easy-to-edit and downloadable. Use these for both personal and commercial use.


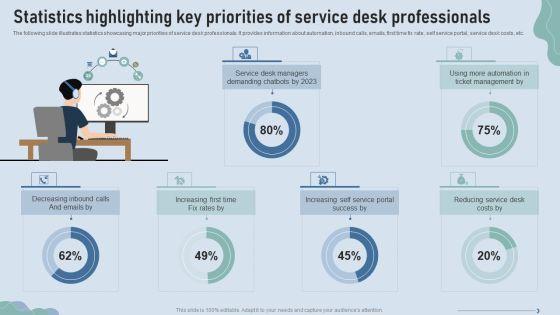
The following slide illustrates statistics showcasing major priorities of service desk professionals. It provides information about automation, inbound calls, emails, first time fix rate, self service portal, service desk costs, etc. From laying roadmaps to briefing everything in detail, our templates are perfect for you. You can set the stage with your presentation slides. All you have to do is download these easy-to-edit and customizable templates. Implementing Advanced Service Help Desk Administration Program Statistics Highlighting Key Priorities Of Service Desk Infographics PD will help you deliver an outstanding performance that everyone would remember and praise you for. Do download this presentation today.


The following slide illustrates statistics showcasing major priorities of service desk professionals. It provides information about automation, inbound calls, emails, first time fix rate, self service portal, service desk costs, etc. If your project calls for a presentation, then Slidegeeks is your go to partner because we have professionally designed, easy to edit templates that are perfect for any presentation. After downloading, you can easily edit Statistics Highlighting Key Priorities Of Service Desk Professionals Graphics PDF and make the changes accordingly. You can rearrange slides or fill them with different images. Check out all the handy templates.


The following slide illustrates statistics showcasing major priorities of service desk professionals. It provides information about automation, inbound calls, emails, first time fix rate, self service portal, service desk costs, etc. If your project calls for a presentation, then Slidegeeks is your go to partner because we have professionally designed, easy to edit templates that are perfect for any presentation. After downloading, you can easily edit Statistics Highlighting Key Priorities Of Service Desk Professionals Ppt PowerPoint Presentation Diagram PDF and make the changes accordingly. You can rearrange slides or fill them with different images. Check out all the handy templates.


The following slide exhibits major statistics illustrating the different risks faced by the real estate owners and managers in two years. Information covered in this slide is related to physical property damager, tenant risks, administrative risks, cyber risks and employment issues. This Key Statistics Highlighting Various Risks Faced By Real Estate Enhancing Process Improvement By Regularly Information PDF is perfect for any presentation, be it in front of clients or colleagues. It is a versatile and stylish solution for organizing your meetings. The Key Statistics Highlighting Various Risks Faced By Real Estate Enhancing Process Improvement By Regularly Information PDF features a modern design for your presentation meetings. The adjustable and customizable slides provide unlimited possibilities for acing up your presentation. Slidegeeks has done all the homework before launching the product for you. So, do not wait, grab the presentation templates today


The following slide illustrates statistics showcasing major priorities of service desk professionals. It provides information about automation, inbound calls, emails, first time fix rate, self service portal, service desk costs, etc. Take your projects to the next level with our ultimate collection of Digitalization Of Service Desk Statistics Highlighting Key Priorities Of Service Desk Professionals Ppt Gallery Grid PDF. Slidegeeks has designed a range of layouts that are perfect for representing task or activity duration, keeping track of all your deadlines at a glance. Tailor these designs to your exact needs and give them a truly corporate look with your own brand colors they will make your projects stand out from the rest.


The following slide showcases a graphical representation of major website issues faced by the healthcare organizations. No Hypertext Transfer Protocol HTTPS, broken links, outdated website design and slow load web page are the problems which are outlined in the slide. From laying roadmaps to briefing everything in detail, our templates are perfect for you. You can set the stage with your presentation slides. All you have to do is download these easy to edit and customizable templates. Healthcare Management Overview Trends Stats And Operational Areas Key Statistics Highlighting Most Common Website Issues Infographics PDF will help you deliver an outstanding performance that everyone would remember and praise you for. Do download this presentation today.


The following slide exhibits major statistics illustrating the different risks faced by the real estate owners and managers in two years. Information covered in this slide is related to physical property damager, tenant risks, administrative risks, cyber risks and employment issues. Whether you have daily or monthly meetings, a brilliant presentation is necessary. Executing Risk Mitigation Key Statistics Highlighting Various Risks Faced By Real Estate Elements PDF can be your best option for delivering a presentation. Represent everything in detail using Executing Risk Mitigation Key Statistics Highlighting Various Risks Faced By Real Estate Elements PDF and make yourself stand out in meetings. The template is versatile and follows a structure that will cater to your requirements. All the templates prepared by Slidegeeks are easy to download and edit. Our research experts have taken care of the corporate themes as well. So, give it a try and see the results.


The following slide illustrates statistics showcasing major priorities of service desk professionals. It provides information about automation, inbound calls, emails, first time fix rate, self service portal, service desk costs, etc. Present like a pro with Integrating ITSM To Enhance Service Statistics Highlighting Key Priorities Of Service Mockup PDF Create beautiful presentations together with your team, using our easy-to-use presentation slides. Share your ideas in real-time and make changes on the fly by downloading our templates. So whether youre in the office, on the go, or in a remote location, you can stay in sync with your team and present your ideas with confidence. With Slidegeeks presentation got a whole lot easier. Grab these presentations today.


The following slide exhibits major statistics illustrating the different risks faced by the real estate owners and managers in two years. Information covered in this slide is related to physical property damager, tenant risks, administrative risks, cyber risks and employment issues. Deliver and pitch your topic in the best possible manner with this Key Statistics Highlighting Various Risks Faced By Real Estate Managers Mockup PDF. Use them to share invaluable insights on Key Statistics Highlighting, Various Risks, Real Estate Managers and impress your audience. This template can be altered and modified as per your expectations. So, grab it now.
The following slide illustrates statistics showcasing major priorities of service desk professionals. It provides information about automation, inbound calls, emails, first time fix rate, self service portal, service desk costs, etc. Deliver and pitch your topic in the best possible manner with this Improve IT Service Desk Statistics Highlighting Key Priorities Of Service Topics PDF. Use them to share invaluable insights on Service Managers, Ticket Management, Increasing Time and impress your audience. This template can be altered and modified as per your expectations. So, grab it now.


The following slide exhibits major statistics illustrating the different risks faced by the real estate owners and managers in two years. Information covered in this slide is related to physical property damager, tenant risks, administrative risks, cyber risks and employment issues. Deliver an awe inspiring pitch with this creative Key Statistics Highlighting Various Risks Faced By Real Estate Managers Microsoft PDF bundle. Topics like Estate Managers, Constantly Exposed, Various Cybercrimes can be discussed with this completely editable template. It is available for immediate download depending on the needs and requirements of the user.


The following slide depicts major advantages of podcast advertisements to boost customer engagement and enhance brand reach. It includes trends associated with listener skipping ads, appreciating podcasts, recalled ads etc. Present like a pro with Niche Marketing Guide To Target Specific Customer Groups Statistics Highlighting Key Benefits Of Podcast Ads Introduction PDF Create beautiful presentations together with your team, using our easy to use presentation slides. Share your ideas in real time and make changes on the fly by downloading our templates. So whether you are in the office, on the go, or in a remote location, you can stay in sync with your team and present your ideas with confidence. With Slidegeeks presentation got a whole lot easier. Grab these presentations today.


This slide shows the overview of usage of Instagram by audience worldwide. It includes details related to total population reach of ads on Instagram, Instagram ad reach vs total population etc. Do you have to make sure that everyone on your team knows about any specific topic I yes, then you should give Comprehensive Influencer Promotional Guide To Improve Brand Reputation Key Statistics Highlighting Instagram Formats PDF a try. Our experts have put a lot of knowledge and effort into creating this impeccable Comprehensive Influencer Promotional Guide To Improve Brand Reputation Key Statistics Highlighting Instagram Formats PDF. You can use this template for your upcoming presentations, as the slides are perfect to represent even the tiniest detail. You can download these templates from the Slidegeeks website and these are easy to edit. So grab these today.


Mentioned slide illustrates statistics providing insights into business website growth. It includes key points such as number of websites present, business with website, small businesses plan to improve website performance, business online, most visited website and website traffic source, etc. Crafting an eye catching presentation has never been more straightforward. Let your presentation shine with this tasteful yet straightforward New Website Launch Strategy Key Statistics Highlighting Website Market Growth Guidelines PDF template. It offers a minimalistic and classy look that is great for making a statement. The colors have been employed intelligently to add a bit of playfulness while still remaining professional. Construct the ideal New Website Launch Strategy Key Statistics Highlighting Website Market Growth Guidelines PDF that effortlessly grabs the attention of your audience Begin now and be certain to wow your customers.


The following slide highlights statistics presenting business vital information to gain basic understanding of business. It showcases information such as business worth, employees, countries, active customers, market share, revenue, operating profit, profit, industry and target audience. Boost your pitch with our creative Steps To Conduct Competitor Analysis Statistics Highlighting Business Key Information Pictures PDF. Deliver an awe-inspiring pitch that will mesmerize everyone. Using these presentation templates you will surely catch everyones attention. You can browse the ppts collection on our website. We have researchers who are experts at creating the right content for the templates. So you do not have to invest time in any additional work. Just grab the template now and use them.


The following slide showcases key trends about content marketing to build trust and nurture audience. It includes elements susch as increased user engagement, enhanced customer satisfaction, boosted reach and followers, improved conversion rate etc. Do you have to make sure that everyone on your team knows about any specific topic I yes, then you should give Key Statistics Highlighting Need For Content Marketing Ppt Layouts Layout PDF a try. Our experts have put a lot of knowledge and effort into creating this impeccable Key Statistics Highlighting Need For Content Marketing Ppt Layouts Layout PDF. You can use this template for your upcoming presentations, as the slides are perfect to represent even the tiniest detail. You can download these templates from the Slidegeeks website and these are easy to edit. So grab these today

This slide presents statistics showing impact of appropriate customer segmentation and profiling on organization. It highlights information about customer churn rate, sales revenue, customer experience, targeting and positioning, recurring revenue, distribution channel, price optimization, brand awareness, etc. Coming up with a presentation necessitates that the majority of the effort goes into the content and the message you intend to convey. The visuals of a PowerPoint presentation can only be effective if it supplements and supports the story that is being told. Keeping this in mind our experts created Customer Segmentation Key Statistics Highlights Ppt PowerPoint Presentation File Example PDF to reduce the time that goes into designing the presentation. This way, you can concentrate on the message while our designers take care of providing you with the right template for the situation.


The following slide exhibits major statistics illustrating the different risks faced by the real estate owners and managers in two years. Information covered in this slide is related to physical property damager, tenant risks, administrative risks, cyber risks and employment issues. Deliver and pitch your topic in the best possible manner with this Key Statistics Highlighting Various Risks Faced By Real Managing Commercial Property Risks Elements PDF. Use them to share invaluable insights on Various Cybercrimes, Estate Managers, Natural Disasters and impress your audience. This template can be altered and modified as per your expectations. So, grab it now.


The slide covers the statistics highlighting department wise increase in current year expenses as compared to previous years. Various departments included are production, marketing, operations, administration, HR, accounting and finance Do you know about Slidesgeeks Key Techniques To Enhance Cost Efficiency Statistics Highlighting Increase In Departmental Costs Structure PDF. These are perfect for delivering any kind od presentation. Using it, create PowerPoint presentations that communicate your ideas and engage audiences. Save time and effort by using our pre designed presentation templates that are perfect for a wide range of topic. Our vast selection of designs covers a range of styles, from creative to business, and are all highly customizable and easy to edit. Download as a PowerPoint template or use them as Google Slides themes.


The following slide showcases key trends about content marketing to build trust and nurture audience. It includes elements susch as increased user engagement, enhanced customer satisfaction, boosted reach and followers, improved conversion rate etc. Are you in need of a template that can accommodate all of your creative concepts This one is crafted professionally and can be altered to fit any style. Use it with Google Slides or PowerPoint. Include striking photographs, symbols, depictions, and other visuals. Fill, move around, or remove text boxes as desired. Test out color palettes and font mixtures. Edit and save your work, or work with colleagues. Download Incorporating Real Time Marketing For Improved Consumer Key Statistics Highlighting Need For Content Guidelines PDF and observe how to make your presentation outstanding. Give an impeccable presentation to your group and make your presentation unforgettable.


This slide presents statistics showing impact of appropriate customer segmentation and profiling on organization. It highlights information about customer churn rate, sales revenue, customer experience, targeting and positioning, recurring revenue, distribution channel, price optimization, brand awareness, etc.Take your projects to the next level with our ultimate collection of Customer Segmentation Key Statistics Highlights Ppt Layouts Graphics PDF. Slidegeeks has designed a range of layouts that are perfect for representing task or activity duration, keeping track of all your deadlines at a glance. Tailor these designs to your exact needs and give them a truly corporate look with your own brand colors they will make your projects stand out from the rest.


Following slide provides information about key statistics associated with digital wallet market size. It includes key point such as CAGR, global market size growth, most preferred application, transaction percentage and major industry in mobile wallet. Slidegeeks has constructed Cashless Payment Strategies To Enhance Business Performance Key Statistics Highlighting Mobile Wallet Market Formats PDF after conducting extensive research and examination. These presentation templates are constantly being generated and modified based on user preferences and critiques from editors. Here, you will find the most attractive templates for a range of purposes while taking into account ratings and remarks from users regarding the content. This is an excellent jumping-off point to explore our content and will give new users an insight into our top-notch PowerPoint Templates.


Following slide displays key statistics highlighting cashless payment performance in market. It includes key statistics related to most preferred payment system, online payment growth, change to electronic transaction, etc. Retrieve professionally designed Cashless Payment Strategies To Enhance Business Performance Key Statistics Highlighting Cashless Payment Slides PDF to effectively convey your message and captivate your listeners. Save time by selecting pre-made slideshows that are appropriate for various topics, from business to educational purposes. These themes come in many different styles, from creative to corporate, and all of them are easily adjustable and can be edited quickly. Access them as PowerPoint templates or as Google Slides themes. You do not have to go on a hunt for the perfect presentation because Slidegeeks got you covered from everywhere.


This slide provides information regarding statistics highlighting customer loyalty towards brand in terms of brands purchases from loyal customers, loyal customer spend over brand, etc. Slidegeeks is here to make your presentations a breeze with Key Elements Of Strategic Brand Administration Statistics Highlighting Customer Loyalty Towards Brand Topics PDF With our easy-to-use and customizable templates, you can focus on delivering your ideas rather than worrying about formatting. With a variety of designs to choose from, you are sure to find one that suits your needs. And with animations and unique photos, illustrations, and fonts, you can make your presentation pop. So whether you are giving a sales pitch or presenting to the board, make sure to check out Slidegeeks first


This slide shows information regarding various tech acquisitions in business. It includes acquisitions cost such as dell Buys EMC, Avago technologies buys Broadcom, etc. Showcasing this set of slides titled Key Statistics Highlighting Biggest Technology Procurement Slides PDF. The topics addressed in these templates are Key Statistics, Biggest Technology, Procurement. All the content presented in this PPT design is completely editable. Download it and make adjustments in color, background, font etc. as per your unique business setting.


The purpose of this slide is to graphically represent the average staff turnover rate in multiple industries. The industries covered in the slide are construction, manufacturing, transportation, information, financial, hospitality, and health services along with key observations. Want to ace your presentation in front of a live audience Our Key Statistics Highlighting Average Employee Turnover Rate In Different Industries Infographics PDF can help you do that by engaging all the users towards you. Slidegeeks experts have put their efforts and expertise into creating these impeccable powerpoint presentations so that you can communicate your ideas clearly. Moreover, all the templates are customizable, and easy to edit and downloadable. Use these for both personal and commercial use.

The following slide showcases a graphical representation of major website issues faced by the healthcare organizations. No Hypertext Transfer Protocol HTTPS, broken links, outdated website design and slow load web page are the problems which are outlined in the slide. Slidegeeks has constructed Guide To Healthcare Services Administration Key Statistics Highlighting Most Common Website Issues Introduction PDF after conducting extensive research and examination. These presentation templates are constantly being generated and modified based on user preferences and critiques from editors. Here, you will find the most attractive templates for a range of purposes while taking into account ratings and remarks from users regarding the content. This is an excellent jumping off point to explore our content and will give new users an insight into our top notch PowerPoint Templates.
The following slide showcases a graphical representation of major website issues faced by the healthcare organizations. No Hypertext Transfer Protocol HTTPS, broken links, outdated website design and slow load web page are the problems which are outlined in the slide. The Key Statistics Highlighting Most Common Website Issues Diagrams PDF is a compilation of the most recent design trends as a series of slides. It is suitable for any subject or industry presentation, containing attractive visuals and photo spots for businesses to clearly express their messages. This template contains a variety of slides for the user to input data, such as structures to contrast two elements, bullet points, and slides for written information. Slidegeeks is prepared to create an impression.


This slide showcases various statistics about potential impact of generative AI on economy and across different business functions. It showcases stats related to global GDP, sales productivity, research and development costs etc. This modern and well-arranged Key Statistics Highlighting Potential Impact Of Generative AI Introduction PDF provides lots of creative possibilities. It is very simple to customize and edit with the Powerpoint Software. Just drag and drop your pictures into the shapes. All facets of this template can be edited with Powerpoint, no extra software is necessary. Add your own material, put your images in the places assigned for them, adjust the colors, and then you can show your slides to the world, with an animated slide included.
35 Item(s)