 AI PPT Maker
 Templates
 PPT Bundles
 Design Services
 Business PPTs
 Business Plan
 Management
 Strategy
 Introduction PPT
 Roadmap
 Self Introduction
 Timelines
 Process
 Marketing
 Agenda
 Technology
 Medical
 Startup Business Plan
 Cyber Security
 Dashboards
 SWOT
SWOT Proposals
 Education
 Pitch Deck
 Digital Marketing
 KPIs
KPIs Project Management
 Product Management
 Artificial Intelligence
 Target Market
 Communication
 Supply Chain
 Google Slides
 Research Services
 One Pagers
 All Categories
Key metrics dashboard PowerPoint Presentation Templates and Google Slides
SHOW
- 60
- 120
- 180
DISPLAYING: 60 of 87 Item(s)
Page


This slide represents the dashboard to track and manage customer relationship management marketing attribution campaign. It includes details related to KPIs such as acquisition funnel overview, MQL, SQL, opportunities and customers by channel. Are you in need of a template that can accommodate all of your creative concepts This one is crafted professionally and can be altered to fit any style. Use it with Google Slides or PowerPoint. Include striking photographs, symbols, depictions, and other visuals. Fill, move around, or remove text boxes as desired. Test out color palettes and font mixtures. Edit and save your work, or work with colleagues. Download Integrating CRM Solution To Acquire Potential Customers CRM Marketing Attribution Key Metrics Dashboard Template PDF and observe how to make your presentation outstanding. Give an impeccable presentation to your group and make your presentation unforgettable.

The following slide highlights dashboard for digital advertising for graphical representation of marketing performance. It includes components such as cost of advertisements, cost per click, advertisements, no. of page views etc. Showcasing this set of slides titled Automated Internet Marketing Dashboard With Key Metrics Information PDF. The topics addressed in these templates are Cost Advertisements, Clicks Advertisement, Cost Per Click. All the content presented in this PPT design is completely editable. Download it and make adjustments in color, background, font etc. as per your unique business setting.


This slide represents the KPI dashboard to track and monitor performance of data driven marketing campaigns launched by the marketing team. It includes details related to conversions by google ads, Facebook and Instagram etc. There are so many reasons you need a Data Driven Marketing Campaigns Key Metrics Dashboard Microsoft PDF. The first reason is you can not spend time making everything from scratch, Thus, Slidegeeks has made presentation templates for you too. You can easily download these templates from our website easily.
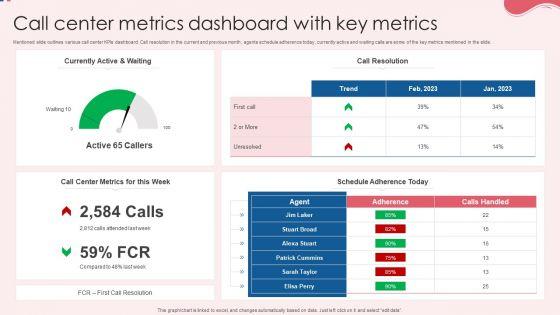
Mentioned slide outlines various call center KPIs dashboard. Call resolution in the current and previous month, agents schedule adherence today, currently active and waiting calls are some of the key metrics mentioned in the slide. Showcasing this set of slides titled Call Center Metrics Dashboard With Key Metrics Information PDF. The topics addressed in these templates are Currently Active, Call Resolution, Key Metrics. All the content presented in this PPT design is completely editable. Download it and make adjustments in color, background, font etc. as per your unique business setting.


This slide represents the dashboard to track and measure the performance and efficiency of digital marketing software. It includes details related to KPIs such as social media followers, Facebook demographics etc. Crafting an eye catching presentation has never been more straightforward. Let your presentation shine with this tasteful yet straightforward Software Implementation Strategy Digital Marketing Software Key Metrics Dashboard Template PDF template. It offers a minimalistic and classy look that is great for making a statement. The colors have been employed intelligently to add a bit of playfulness while still remaining professional. Construct the idealSoftware Implementation Strategy Digital Marketing Software Key Metrics Dashboard Template PDF that effortlessly grabs the attention of your audience Begin now and be certain to wow your customers.


Do you have to make sure that everyone on your team knows about any specific topic I yes, then you should give Implementing An Effective Ecommerce Management This slide represents the dashboard showing the key performance measures to analyze and monitor the customer acquisition and conversion rate. It includes details related to KPIs such as direct traffic, sessions by source, social networks, paid keywords etc. Framework Customer Acquisition And Conversion Key Metrics Dashboard Information PDF a try. Our experts have put a lot of knowledge and effort into creating this impeccable Implementing An Effective Ecommerce Management Framework Customer Acquisition And Conversion Key Metrics Dashboard Information PDF. You can use this template for your upcoming presentations, as the slides are perfect to represent even the tiniest detail. You can download these templates from the Slidegeeks website and these are easy to edit. So grab these today
This slide represents dashboard representing the key metrics of operational risk management. It includes KPIs such as operational risk by rating, by month, operational risk list etc. The Operational Risk Assessment And Management Plan Operational Risk Management Key Metrics Dashboard Icons PDF is a compilation of the most recent design trends as a series of slides. It is suitable for any subject or industry presentation, containing attractive visuals and photo spots for businesses to clearly express their messages. This template contains a variety of slides for the user to input data, such as structures to contrast two elements, bullet points, and slides for written information. Slidegeeks is prepared to create an impression.


This slide represents the dashboard showing the key performance measures to analyze and monitor the customer acquisition and conversion rate. It includes details related to KPIs such as direct traffic, sessions by source, social networks, paid keywords etc.From laying roadmaps to briefing everything in detail, our templates are perfect for you. You can set the stage with your presentation slides. All you have to do is download these easy-to-edit and customizable templates. Customer Acquisition And Conversion Key Metrics Dashboard Deploying Ecommerce Order Management Sample PDF will help you deliver an outstanding performance that everyone would remember and praise you for. Do download this presentation today.


This slide represents the dashboard to track and measure the performance and efficiency of digital marketing software. It includes details related to KPIs such as social media followers, facebook demographics etc. Do you have an important presentation coming up Are you looking for something that will make your presentation stand out from the rest Look no further than Strategic Plan For Enterprise Digital Marketing Software Key Metrics Dashboard Brochure PDF. With our professional designs, you can trust that your presentation will pop and make delivering it a smooth process. And with Slidegeeks, you can trust that your presentation will be unique and memorable. So why wait Grab Strategic Plan For Enterprise Digital Marketing Software Key Metrics Dashboard Brochure PDF today and make your presentation stand out from the rest.


This slide represents the dashboard showing the key performance measures to analyze and monitor the customer acquisition and conversion rate. It includes details related to KPIs such as direct traffic, sessions by source, social networks, paid keywords etc. Present like a pro with Optimizing Online Stores Customer Acquisition And Conversion Key Metrics Dashboard Formats PDF Create beautiful presentations together with your team, using our easy-to-use presentation slides. Share your ideas in real-time and make changes on the fly by downloading our templates. So whether youre in the office, on the go, or in a remote location, you can stay in sync with your team and present your ideas with confidence. With Slidegeeks presentation got a whole lot easier. Grab these presentations today.

Showcasing this set of slides titled Call Center Quality Key Performance Assurance Indicator Metrics Dashboard Portrait PDF. The topics addressed in these templates are Key Performance, Assurance Indicator, Metrics Dashboard. All the content presented in this PPT design is completely editable. Download it and make adjustments in color, background, font etc. as per your unique business setting.


The slide includes a dashboard of hotel property management system that provides information about check in guests , reservations, housekeeping and other KPIs at a glance. Pitch your topic with ease and precision using this Hotel Operations Management Software Key Metrics Dashboard Inspiration PDF. This layout presents information on Reservations, Housekeeping, Occupancy. It is also available for immediate download and adjustment. So, changes can be made in the color, design, graphics or any other component to create a unique layout.


This slide shows KPI dashboard for assessing performance of social media platforms. It provides information about followers, likes, clicks, shares, impressions, engaged users, new followers, etc. Retrieve professionally designed Optimizing Social Networks Social Media Platforms Dashboard With Key Metrics Structure PDF to effectively convey your message and captivate your listeners. Save time by selecting pre-made slideshows that are appropriate for various topics, from business to educational purposes. These themes come in many different styles, from creative to corporate, and all of them are easily adjustable and can be edited quickly. Access them as PowerPoint templates or as Google Slides themes. You dont have to go on a hunt for the perfect presentation because Slidegeeks got you covered from everywhere.


This slide showcases comparison of different types of brand architecture. It compares on the basis of - parent brand dominance, branding investment, customer segments, business make up and brand management. Are you searching for a Enhancing Organic Reach Social Media Platforms Dashboard With Key Metrics Guidelines PDF that is uncluttered, straightforward, and original Its easy to edit, and you can change the colors to suit your personal or business branding. For a presentation that expresses how much effort youve put in, this template is ideal With all of its features, including tables, diagrams, statistics, and lists, its perfect for a business plan presentation. Make your ideas more appealing with these professional slides. Download Enhancing Organic Reach Social Media Platforms Dashboard With Key Metrics Guidelines PDF from Slidegeeks today.


This slide shows dashboard of the human resource analytics software. It includes details related to open positions, conversion ratio, offer accepted, cost of hiring by grade etc. Do you have to make sure that everyone on your team knows about any specific topic I yes, then you should give Analyzing And Deploying Human Resource Analytics Key Performance Metrics Dashboard Themes PDF a try. Our experts have put a lot of knowledge and effort into creating this impeccable Analyzing And Deploying Human Resource Analytics Key Performance Metrics Dashboard Themes PDF. You can use this template for your upcoming presentations, as the slides are perfect to represent even the tiniest detail. You can download these templates from the Slidegeeks website and these are easy to edit. So grab these today.


This slide represents the dashboard to track and measure the performance and efficiency of digital marketing software. It includes details related to KPIs such as social media followers, Facebook demographics etc. If you are looking for a format to display your unique thoughts, then the professionally designed System Deployment Project Digital Marketing Software Key Metrics Dashboard Graphics PDF is the one for you. You can use it as a Google Slides template or a PowerPoint template. Incorporate impressive visuals, symbols, images, and other charts. Modify or reorganize the text boxes as you desire. Experiment with shade schemes and font pairings. Alter, share or cooperate with other people on your work. Download System Deployment Project Digital Marketing Software Key Metrics Dashboard Graphics PDF and find out how to give a successful presentation. Present a perfect display to your team and make your presentation unforgettable.


This slide represents the dashboard to track and measure the performance and efficiency of digital marketing software. It includes details related to KPIs such as social media followers, Facebook demographics etc. Slidegeeks is here to make your presentations a breeze with Digital Marketing Software Key Metrics Dashboard Application Deployment Project Plan Structure PDF With our easy to use and customizable templates, you can focus on delivering your ideas rather than worrying about formatting. With a variety of designs to choose from, you are sure to find one that suits your needs. And with animations and unique photos, illustrations, and fonts, you can make your presentation pop. So whether you are giving a sales pitch or presenting to the board, make sure to check out Slidegeeks first.
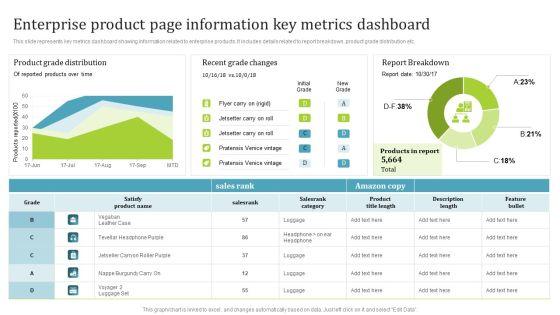

This slide represents key metrics dashboard showing information related to enterprise products. It includes details related to report breakdown, product grade distribution etc. This PIM Software Deployment To Enhance Conversion Rates Enterprise Product Page Information Key Metrics Dashboard Mockup PDF from Slidegeeks makes it easy to present information on your topic with precision. It provides customization options, so you can make changes to the colors, design, graphics, or any other component to create a unique layout. It is also available for immediate download, so you can begin using it right away. Slidegeeks has done good research to ensure that you have everything you need to make your presentation stand out. Make a name out there for a brilliant performance.


This slide represents the dashboard showing the key performance measures to analyze and monitor the customer acquisition and conversion rate. It includes details related to KPIs such as direct traffic, sessions by source, social networks, paid keywords etc. Presenting this PowerPoint presentation, titled Analyzing And Deploying Effective CMS Customer Acquisition And Conversion Key Metrics Dashboard Infographics PDF, with topics curated by our researchers after extensive research. This editable presentation is available for immediate download and provides attractive features when used. Download now and captivate your audience. Presenting this Analyzing And Deploying Effective CMS Customer Acquisition And Conversion Key Metrics Dashboard Infographics PDF. Our researchers have carefully researched and created these slides with all aspects taken into consideration. This is a completely customizable Analyzing And Deploying Effective CMS Customer Acquisition And Conversion Key Metrics Dashboard Infographics PDF that is available for immediate downloading. Download now and make an impact on your audience. Highlight the attractive features available with our PPTs.
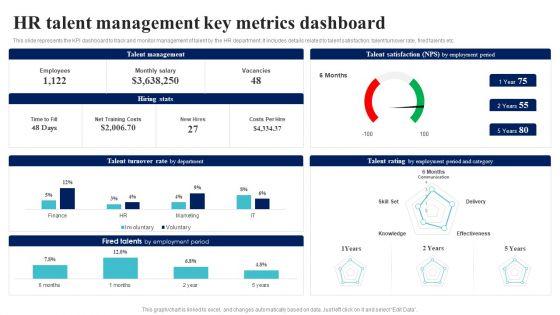
This slide represents the KPI dashboard to track and monitor management of talent by the HR department. It includes details related to talent satisfaction, talent turnover rate, fired talents etc.This BI Implementation To Enhance Hiring Process Hr Talent Management Key Metrics Dashboard Brochure PDF is perfect for any presentation, be it in front of clients or colleagues. It is a versatile and stylish solution for organizing your meetings. The BI Implementation To Enhance Hiring Process Hr Talent Management Key Metrics Dashboard Brochure PDF features a modern design for your presentation meetings. The adjustable and customizable slides provide unlimited possibilities for acing up your presentation. Slidegeeks has done all the homework before launching the product for you. So, do not wait, grab the presentation templates today.


This slide represents key metrics dashboard to analyze the engagement of employees in the organization. It includes details related to KPIs such as engagement score, response rate, net promoter score etc.Formulating a presentation can take up a lot of effort and time, so the content and message should always be the primary focus. The visuals of the PowerPoint can enhance the presenters message, so our BI Implementation To Enhance Hiring Process Employee Engagement Key Performance Metrics Dashboard Ideas PDF was created to help save time. Instead of worrying about the design, the presenter can concentrate on the message while our designers work on creating the ideal templates for whatever situation is needed. Slidegeeks has experts for everything from amazing designs to valuable content, we have put everything into BI Implementation To Enhance Hiring Process Employee Engagement Key Performance Metrics Dashboard Ideas PDF.
This slide represents the dashboard for tracking the key performance indicators of sales lead to revenue management. It includes key metrics such as leads by campaign, ratings, lead generation rate, top accounts by revenue and top owners by number of accounts. Showcasing this set of slides titled Sales L2RM System Tracking Key Metrics Dashboard Ppt Professional Format Ideas PDF. The topics addressed in these templates are Leads By Campaign, Leads By Rating, Leads Generation Rate. All the content presented in this PPT design is completely editable. Download it and make adjustments in color, background, font etc. as per your unique business setting.


This slide represents dashboard representing the key metrics of operational risk management. It includes KPIs such as operational risk by rating, by month, operational risk list etc.Create an editable Strategic Risk Management Plan Operational Risk Management Key Metrics Dashboard Structure PDF that communicates your idea and engages your audience. Whether you are presenting a business or an educational presentation, pre-designed presentation templates help save time. Strategic Risk Management Plan Operational Risk Management Key Metrics Dashboard Structure PDF is highly customizable and very easy to edit, covering many different styles from creative to business presentations. Slidegeeks has creative team members who have crafted amazing templates. So, go and get them without any delay.


This slide covers dashboard to manage and monitor financial risks faced by the enterprise. It includes details related to kpis such as risk heat map, risk rating breakdown, top 5 vulnerabilities etc. Crafting an eye catching presentation has never been more straightforward. Let your presentation shine with this tasteful yet straight forward Company Risk Assessment Plan Financial Risk Management Key Metrics Dashboard Brochure PDF template. It offers a minimalistic and classy look that is great for making a statement. The colors have been employed intelligently to add a bit of playfulness while still remaining professional. Construct the ideal Company Risk Assessment Plan Financial Risk Management Key Metrics Dashboard Brochure PDF that effortlessly grabs the attention of your audience. Begin now and be certain to wow your customers.


This slide represents the KPI dashboard to track and monitor management of talent by the HR department. It includes details related to talent satisfaction, talent turnover rate, fired talents etc. Coming up with a presentation necessitates that the majority of the effort goes into the content and the message you intend to convey. The visuals of a PowerPoint presentation can only be effective if it supplements and supports the story that is being told. Keeping this in mind our experts created Human Resource Analytics HR Talent Management Key Metrics Dashboard Brochure PDF to reduce the time that goes into designing the presentation. This way, you can concentrate on the message while our designers take care of providing you with the right template for the situation.


This slide represents the dashboard showing the key performance measures to analyze and monitor the customer acquisition and conversion rate. It includes details related to KPIs such as direct traffic, sessions by source, social networks, paid keywords etc. Presenting this PowerPoint presentation, titled Analyzing And Implementing Effective CMS Customer Acquisition And Conversion Key Metrics Dashboard Professional PDF, with topics curated by our researchers after extensive research. This editable presentation is available for immediate download and provides attractive features when used. Download now and captivate your audience. Presenting this Analyzing And Implementing Effective CMS Customer Acquisition And Conversion Key Metrics Dashboard Professional PDF. Our researchers have carefully researched and created these slides with all aspects taken into consideration. This is a completely customizable Analyzing And Implementing Effective CMS Customer Acquisition And Conversion Key Metrics Dashboard Professional PDF that is available for immediate downloading. Download now and make an impact on your audience. Highlight the attractive features available with our PPTs.


This slide represents dashboard representing the key metrics of operational risk management. It includes KPIs such as operational risk by rating, by month, operational risk list etc. Present like a pro with Strategic Risk Management And Mitigation Plan Operational Risk Management Key Metrics Dashboard Sample PDF Create beautiful presentations together with your team, using our easy to use presentation slides. Share your ideas in real time and make changes on the fly by downloading our templates. So whether you are in the office, on the go, or in a remote location, you can stay in sync with your team and present your ideas with confidence. With Slidegeeks presentation got a whole lot easier. Grab these presentations today.


This slide represents the KPI dashboard to track and monitor management of talent by the HR department. It includes details related to talent satisfaction, talent turnover rate, fired talents etc. This Business Analytics Application HR Talent Management Key Metrics Dashboard Rules PDF is perfect for any presentation, be it in front of clients or colleagues. It is a versatile and stylish solution for organizing your meetings. The Business Analytics Application HR Talent Management Key Metrics Dashboard Rules PDF features a modern design for your presentation meetings. The adjustable and customizable slides provide unlimited possibilities for acing up your presentation. Slidegeeks has done all the homework before launching the product for you. So, dont wait, grab the presentation templates today.


The following dashboard displays the key business metrics such as new customers, profit, revenue per customer, and weekly revenue. Slidegeeks is here to make your presentations a breeze with Key Business Metrics Dashboard Company Process Administration And Optimization Playbook Infographics PDF With our easy-to-use and customizable templates, you can focus on delivering your ideas rather than worrying about formatting. With a variety of designs to choose from, you are sure to find one that suits your needs. And with animations and unique photos, illustrations, and fonts, you can make your presentation pop. So whether you are giving a sales pitch or presenting to the board, make sure to check out Slidegeeks first.


This slide represents dashboard representing the key metrics of operational risk management. It includes KPIs such as operational risk by rating, by month, operational risk list etc. Get a simple yet stunning designed Operational Risk Management Key Metrics Dashboard Professional PDF. It is the best one to establish the tone in your meetings. It is an excellent way to make your presentations highly effective. So, download this PPT today from Slidegeeks and see the positive impacts. Our easy to edit Operational Risk Management Key Metrics Dashboard Professional PDF can be your go-to option for all upcoming conferences and meetings. So, what are you waiting for Grab this template today.
Showcasing this set of slides titled Annual Financial Performance Administration Dashboard With Key Metrics Ppt PowerPoint Presentation Icon Visual Aids PDF. The topics addressed in these templates are Accounts Receivable, Accounts Payable, Planned Profit Margin. All the content presented in this PPT design is completely editable. Download it and make adjustments in color, background, font etc. as per your unique business setting.


This slide shows KPI dashboard for assessing performance of social media platforms. It provides information about followers, likes, clicks, shares, impressions, engaged users, new followers, etc. Deliver and pitch your topic in the best possible manner with this Improving Digital Community Engagement Strategy Social Media Platforms Dashboard With Key Metrics Professional PDF. Use them to share invaluable insights on Social Media Platforms Engagement, Key Engagement Metrics and impress your audience. This template can be altered and modified as per your expectations. So, grab it now.


The following dashboard displays the key business metrics such as new customers, profit, revenue per customer, and weekly revenue. Deliver and pitch your topic in the best possible manner with this Strategic Playbook For Enterprise Administration Key Business Metrics Dashboard Pictures PDF. Use them to share invaluable insights on Average Revenue Per Unit, Customer Lifetime Value, Customer Acquisition Cost and impress your audience. This template can be altered and modified as per your expectations. So, grab it now.


The following dashboard displays the key business metrics such as new customers, profit, revenue per customer, and weekly revenue.Deliver an awe inspiring pitch with this creative Key Business Metrics Dashboard Guide To Enhance Organic Growth By Advancing Business Procedures Pictures PDF bundle. Topics like Average Revenue, Customer Lifetime, Customer Acquisition can be discussed with this completely editable template. It is available for immediate download depending on the needs and requirements of the user.
Dashboard For Risk Communication Strategies Planning And Key Metrics Tracking Brochure PDF Ideas PDF
This slide shows dashboard for planning risk communication and tracking key metrics which includes heat map of risk, classification, objectives, effectiveness, critical risks, etc. Showcasing this set of slides titled Dashboard For Risk Communication Strategies Planning And Key Metrics Tracking Brochure PDF Ideas PDF. The topics addressed in these templates are Risk Heat Map, Tactical Objectives, Controls Effectiveness. All the content presented in this PPT design is completely editable. Download it and make adjustments in color, background, font etc. as per your unique business setting.
Pitch your topic with ease and precision using this Transformation KPI Dashboard With Key Metrics And Status Icons PDF. This layout presents information on Measure, System Implemented, Innovation. It is also available for immediate download and adjustment. So, changes can be made in the color, design, graphics or any other component to create a unique layout.


This slide illustrates facts and figures related to important financial metrics It includes cash flow, DSO, ROCE, EPS diluted for Q4 FY21, Q3 FY22 and Q4 FY22 etc. Showcasing this set of slides titled Funding Pitch On Key Financial Metrics Dashboard Ppt Ideas Deck PDF. The topics addressed in these templates are Cash Flow, EPS Diluted, ROCE. All the content presented in this PPT design is completely editable. Download it and make adjustments in color, background, font etc. as per your unique business setting.


This slide covers cyber security health status dashboard . It also includes audit and compliance, controls health, project status, incident response process, vulnerability patching schedule, investigation process and training compliance. Pitch your topic with ease and precision using this Cyber Security Key Performance Indicators Metrics Dashboard Mockup PDF. This layout presents information on Cyber Security, Vulnerability Patching Schedule, Compliance Investigation Process. It is also available for immediate download and adjustment. So, changes can be made in the color, design, graphics or any other component to create a unique layout.


The following slide shows a dashboard of sales strategy review of firm that can be used by marketing, product, finance managers for reviewing the business. It further includes KPI that are revenue, new customer, gross profit purchaser satisfaction, income comparison, sales categories and profitability. Showcasing this set of slides titled Business Key Performance Metrics Review Dashboard Portrait PDF. The topics addressed in these templates are Sales, Revenue Comparison, Profitability. All the content presented in this PPT design is completely editable. Download it and make adjustments in color, background, font etc. as per your unique business setting.


This slide shows KPI dashboard for assessing performance of social media platforms. It provides information about followers, likes, clicks, shares, impressions, engaged users , new followers, etc. Deliver an awe inspiring pitch with this creative Social Media Platforms Dashboard With Key Metrics Customer Group Engagement Through Social Media Channels Infographics PDF bundle. Topics like Social Media Followers, Key Engagement Metrics can be discussed with this completely editable template. It is available for immediate download depending on the needs and requirements of the user.


The following slide showcases dashboard of supply chain with order status key metrics. Main KPIs covered are volume today, global financial performance and inventory. Pitch your topic with ease and precision using this Packaging And Delivering Dashboard With Monthly Key Performance Metrics Microsoft PDF. This layout presents information on Customer, Global Financial Performance, Inventory Distribution. It is also available for immediate download and adjustment. So, changes can be made in the color, design, graphics or any other component to create a unique layout.


The following slide highlights the cyber security key metrics monitoring dashboard illustrating critical applications, mission critical, other regulations, SOX, key metrics, controls, audits and cyber security training compliance. Showcasing this set of slides titled Digital Risk Assessment Key Metrics Monitoring Dashboard Ppt Ideas Diagrams PDF. The topics addressed in these templates are Critical Applications, Mission Critical, Other Regulation. All the content presented in this PPT design is completely editable. Download it and make adjustments in color, background, font etc. as per your unique business setting.


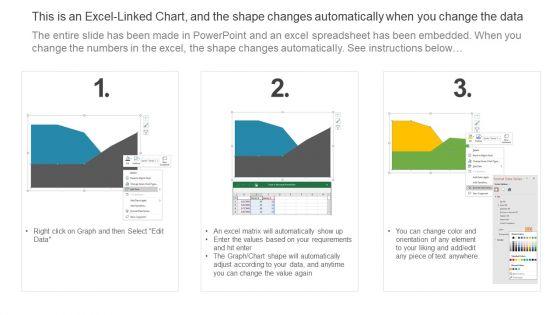
This graph or chart is linked to excel, and changes automatically based on data. Just left click on it and select Edit Data. Pitch your topic with ease and precision using this Client Helpline Dashboard Performance Key Metrics Ppt Outline Deck PDF. This layout presents information on Key Metrics, Trend, Compare. It is also available for immediate download and adjustment. So, changes can be made in the color, design, graphics or any other component to create a unique layout.


This slide displays the dashboard with the financial key performance indicators of an organisation. It includes current assets and liabilities, cash conversion cycle, vendor payments projections, etc. Pitch your topic with ease and precision using this Financial Key Metrics Dashboard And Vendor Payment Projections Professional PDF. This layout presents information on Financial KPI Dashboard, Current Working Capital, Vendor Payments. It is also available for immediate download and adjustment. So, changes can be made in the color, design, graphics or any other component to create a unique layout.

The slide highlights the dashboard of recruitment funnel and key metrics illustrating recruitment source, department, job level, key metrics, recruitment funnel, number of days per stage, gender ratio and age of applicants.Pitch your topic with ease and precision using this Dashboard Of Recruitment Funnel And Key Metrics Information PDF This layout presents information on Recruitment Funnel, Recruitment Dashboard, Recruitment Cost It is also available for immediate download and adjustment. So, changes can be made in the color, design, graphics or any other component to create a unique layout.


This slide shows the dashboard that depicts the metrics for measuring employee performance which includes talent satisfaction, talent turnover rate, rating, etc.Deliver and pitch your topic in the best possible manner with this Automating Key Activities Of HR Manager Dashboard Showing Employee Measurement Metrics Clipart PDF Use them to share invaluable insights on Talent Management, Talent Satisfaction, Talent Turnover and impress your audience. This template can be altered and modified as per your expectations. So, grab it now.


This slide represents the financial dashboard for startup company with key performance indicators. It includes details related to current working capital, cash conversion cycle in days and vendor payment error rate. Pitch your topic with ease and precision using this Startup Business Financial Dashboard With Key Metrics Sample PDF. This layout presents information on Cash Conversion Cycle, Current Working Capital, Current Liabilities Debt. It is also available for immediate download and adjustment. So, changes can be made in the color, design, graphics or any other component to create a unique layout.


The following slide depicts the key insights of the feedback survey to gauge employee engagement at different department levels. It includes metrics such as engagement score, response rate, no. of comments etc.Showcasing this set of slides titled Employee Feedback Dashboard With Key Metrics Elements PDF The topics addressed in these templates are Employee Feedback Dashboard With Key Metrics All the content presented in this PPT design is completely editable. Download it and make adjustments in color, background, font etc. as per your unique business setting.


The following dashboard displays the key business metrics such as new customers, profit, revenue per customer, and weekly revenue. Deliver an awe inspiring pitch with this creative corporate organization playbook key business metrics dashboard ppt show rules pdf bundle. Topics like new customer iytd, sales revenue i ytd, profit i ytd can be discussed with this completely editable template. It is available for immediate download depending on the needs and requirements of the user.


This slide shows the various performance assessment parameters of the consultancy company which includes availability, performance, maintenance, delivery adherence and trends. Deliver an awe inspiring pitch with this creative business model of new consultancy firm dashboards key metrics of performance assessment designs pdf bundle. Topics like availability, performance, maintenance, delivery adherence can be discussed with this completely editable template. It is available for immediate download depending on the needs and requirements of the user.


This slide shows the dashboard related to consultancy company performance which includes budget preparation, sales and goals. Company profits and goals etc.Presenting dashboards showing consultancy company performance with key metrics microsoft pdf to provide visual cues and insights. Share and navigate important information on four stages that need your due attention. This template can be used to pitch topics like dashboards showing consultancy company performance with key metrics. In addtion, this PPT design contains high resolution images, graphics, etc, that are easily editable and available for immediate download.


This slide shows the dashboard related to consultancy company performance which includes budget preparation, sales and goals. Company profits and goals etc. Deliver an awe-inspiring pitch with this creative dashboards showing consultancy company performance with key metrics ppt ideas smartart pdf bundle. Topics like budget, products, customers can be discussed with this completely editable template. It is available for immediate download depending on the needs and requirements of the user.


This slide shows the various performance assessment parameters of the consultancy company which includes availability, performance, maintenance, delivery adherence and trends. Deliver and pitch your topic in the best possible manner with this dashboards key metrics of performance assessment ppt model skills pdf. Use them to share invaluable insights on customers groups, performance, customer complaints and impress your audience. This template can be altered and modified as per your expectations. So, grab it now.


Deliver an awe-inspiring pitch with this creative dashboards showing consultancy company performance with key metrics graphics pdf. bundle. Topics like dashboards showing consultancy company performance with key metrics can be discussed with this completely editable template. It is available for immediate download depending on the needs and requirements of the user.


Deliver and pitch your topic in the best possible manner with this dashboards key metrics of performance assessment summary pdf. Use them to share invaluable insights on delivery adherence, customer complaints, returned volume and impress your audience. This template can be altered and modified as per your expectations. So, grab it now.


Showcasing this set of slides titled third party risk assessment dashboard with key metrics ppt powerpoint presentation file tips pdf. The topics addressed in these templates are service, geographic, marketing. All the content presented in this PPT design is completely editable. Download it and make adjustments in color, background, font etc. as per your unique business setting.
SHOW
- 60
- 120
- 180
DISPLAYING: 60 of 87 Item(s)
Page