 AI PPT Maker
 Templates
 PPT Bundles
 Design Services
 Business PPTs
 Business Plan
 Management
 Strategy
 Introduction PPT
 Roadmap
 Self Introduction
 Timelines
 Process
 Marketing
 Agenda
 Technology
 Medical
 Startup Business Plan
 Cyber Security
 Dashboards
 SWOT
SWOT Proposals
 Education
 Pitch Deck
 Digital Marketing
 KPIs
KPIs Project Management
 Product Management
 Artificial Intelligence
 Target Market
 Communication
 Supply Chain
 Google Slides
 Research Services
 One Pagers
 All Categories
It performance dashboard PowerPoint Presentation Templates and Google Slides
SHOW
- 60
- 120
- 180
DISPLAYING: 60 of 66 Item(s)
Page


This IT Performance Dashboard Ppt PowerPoint Presentation Complete Deck With Slides acts as backup support for your ideas, vision, thoughts, etc. Use it to present a thorough understanding of the topic. This PPT slideshow can be utilized for both in-house and outside presentations depending upon your needs and business demands. Entailing twelve slides with a consistent design and theme, this template will make a solid use case. As it is intuitively designed, it suits every business vertical and industry. All you have to do is make a few tweaks in the content or any other component to design unique presentations. The biggest advantage of this complete deck is that it can be personalized multiple times once downloaded. The color, design, shapes, and other elements are free to modify to add personal touches. You can also insert your logo design in this PPT layout. Therefore a well-thought and crafted presentation can be delivered with ease and precision by downloading this IT Performance Dashboard Ppt PowerPoint Presentation Complete Deck With Slides PPT slideshow.


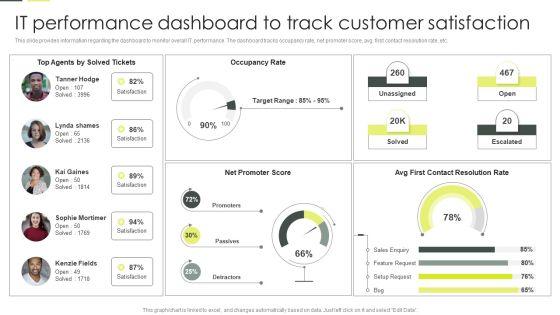
This slide provides information regarding the dashboard to monitor overall IT performance. The dashboard tracks occupancy rate, net promoter score, avg. first contact resolution rate, etc. The IT Performance Dashboard To Track Customer Satisfaction Ppt PowerPoint Presentation File Styles PDF is a compilation of the most recent design trends as a series of slides. It is suitable for any subject or industry presentation, containing attractive visuals and photo spots for businesses to clearly express their messages. This template contains a variety of slides for the user to input data, such as structures to contrast two elements, bullet points, and slides for written information. Slidegeeks is prepared to create an impression.


This slide provides information regarding the dashboard to monitor overall IT performance. The dashboard tracks occupancy rate, net promoter score, avg. first contact resolution rate, etc. Formulating a presentation can take up a lot of effort and time, so the content and message should always be the primary focus. The visuals of the PowerPoint can enhance the presenters message, so our IT Reducing Costs And Management Tips IT Performance Dashboard To Track Customer Satisfaction Graphics PDF was created to help save time. Instead of worrying about the design, the presenter can concentrate on the message while our designers work on creating the ideal templates for whatever situation is needed. Slidegeeks has experts for everything from amazing designs to valuable content, we have put everything into IT Reducing Costs And Management Tips IT Performance Dashboard To Track Customer Satisfaction Graphics PDF


This slide covers KPI dashboard to analyze improved performance after implementing health information technology system in organization. It involves details such as outpatient trends, average waiting time and overall patient satisfaction. Create an editable Incorporating HIS To Enhance Healthcare Services Dashboard To Assess Performance Of Integrating Health IT System Diagrams PDF that communicates your idea and engages your audience. Whether youre presenting a business or an educational presentation, pre designed presentation templates help save time. Incorporating HIS To Enhance Healthcare Services Dashboard To Assess Performance Of Integrating Health IT System Diagrams PDF is highly customizable and very easy to edit, covering many different styles from creative to business presentations. Slidegeeks has creative team members who have crafted amazing templates. So, go and get them without any delay.


This slide provides information regarding the dashboard to monitor overall IT performance. The dashboard tracks occupancy rate, net promoter score, avg. first contact resolution rate, etc. Boost your pitch with our creative Deploying Corporate Aligned IT Strategy IT Performance Dashboard To Track Customer Satisfaction Clipart PDF. Deliver an awe inspiring pitch that will mesmerize everyone. Using these presentation templates you will surely catch everyones attention. You can browse the ppts collection on our website. We have researchers who are experts at creating the right content for the templates. So you do not have to invest time in any additional work. Just grab the template now and use them.


This slide provides information regarding the dashboard to monitor overall IT performance. The dashboard tracks occupancy rate, net promoter score, avg. first contact resolution rate, etc. Boost your pitch with our creative IT Performance Dashboard To Track Customer Satisfaction Elements PDF. Deliver an awe inspiring pitch that will mesmerize everyone. Using these presentation templates you will surely catch everyones attention. You can browse the ppts collection on our website. We have researchers who are experts at creating the right content for the templates. So you do not have to invest time in any additional work. Just grab the template now and use them.


This slide provides information regarding the dashboard to monitor overall IT performance. The dashboard tracks occupancy rate, net promoter score, avg. first contact resolution rate, etc. Crafting an eye-catching presentation has never been more straightforward. Let your presentation shine with this tasteful yet straightforward IT Performance Dashboard To Track Customer Satisfaction Designs PDF template. It offers a minimalistic and classy look that is great for making a statement. The colors have been employed intelligently to add a bit of playfulness while still remaining professional. Construct the ideal IT Performance Dashboard To Track Customer Satisfaction Designs PDF that effortlessly grabs the attention of your audience Begin now and be certain to wow your customers
Forecast Analysis Technique IT Predictive Modeling Model Performance Tracking Dashboard Brochure PDF
This slide represents the predictive analytics model performance tracking dashboard, and it covers the details of total visitors, total buyers, total products added to the cart, filters by date and category, visitors to clients conversion rate, and so on. There are so many reasons you need a Forecast Analysis Technique IT Predictive Modeling Model Performance Tracking Dashboard Brochure PDF. The first reason is you can not spend time making everything from scratch, Thus, Slidegeeks has made presentation templates for you too. You can easily download these templates from our website easily.
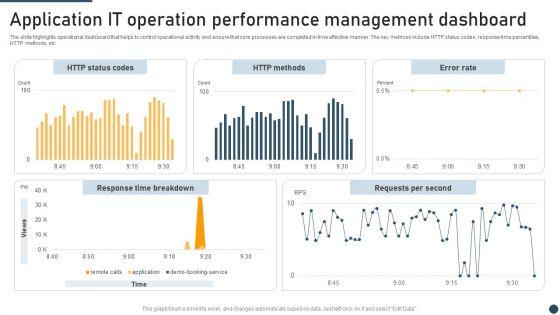

The slide highlights operational dashboard that helps to control operational activity and ensure that core processes are completed in time effective manner. The key metrices include HTTP status codes, response time percentiles, HTTP methods, etc. Showcasing this set of slides titled Application It Operation Performance Management Dashboard Themes PDF. The topics addressed in these templates are HTTP Status Codes, HTTP Methods, Error Rate. All the content presented in this PPT design is completely editable. Download it and make adjustments in color, background, font etc. as per your unique business setting.


This slide covers the dashboard that depicts metrics to track company sales performance that focuses on number of sales, cost breakdown, accumulated revenues, incremental sales, etc.If you are looking for a format to display your unique thoughts, then the professionally designed Dashboard Depicting Kpis To Track Sales Performance Integrating Technology To Transform Change Portrait PDF is the one for you. You can use it as a Google Slides template or a PowerPoint template. Incorporate impressive visuals, symbols, images, and other charts. Modify or reorganize the text boxes as you desire. Experiment with shade schemes and font pairings. Alter, share or cooperate with other people on your work. Download Dashboard Depicting Kpis To Track Sales Performance Integrating Technology To Transform Change Portrait PDF and find out how to give a successful presentation. Present a perfect display to your team and make your presentation unforgettable.

This slide provides information regarding the dashboard to monitor overall IT performance. The dashboard tracks occupancy rate, net promoter score, avg. first contact resolution rate, etc. Find a pre designed and impeccable Building An IT Strategy Plan For Business Expansion IT Performance Dashboard To Track Customer Satisfaction Download PDF. The templates can ace your presentation without additional effort. You can download these easy to edit presentation templates to make your presentation stand out from others. So, what are you waiting for Download the template from Slidegeeks today and give a unique touch to your presentation.
This slide represents the predictive analytics model performance tracking dashboard, and it covers the details of total visitors, total buyers, total products added to the cart, filters by date and category, visitors to clients conversion rate, and so on.The Predictive Analytics Model Performance Tracking Dashboard Forward Looking Analysis IT Introduction PDF is a compilation of the most recent design trends as a series of slides. It is suitable for any subject or industry presentation, containing attractive visuals and photo spots for businesses to clearly express their messages. This template contains a variety of slides for the user to input data, such as structures to contrast two elements, bullet points, and slides for written information. Slidegeeks is prepared to create an impression.
Slidegeeks is here to make your presentations a breeze with Data Structure IT Data Structure Performance Tracking Dashboard Diagrams PDF With our easy-to-use and customizable templates, you can focus on delivering your ideas rather than worrying about formatting. With a variety of designs to choose from, youre sure to find one that suits your needs. And with animations and unique photos, illustrations, and fonts, you can make your presentation pop. So whether youre giving a sales pitch or presenting to the board, make sure to check out Slidegeeks first.


This slide covers analytical summary of IT incidents recorded and managed. It includes elements such as average incident re-assignments, average age of open incidents based on priority, basic indicators, etc. Showcasing this set of slides titled IT Performance Management And Analysis Dashboard Ppt Styles Portrait PDF. The topics addressed in these templates are Average Age, Open Incidents Priority, Re Assigned, Incidents Count. All the content presented in this PPT design is completely editable. Download it and make adjustments in color, background, font etc. as per your unique business setting.


This slide shows the dashboard representing the costs incurred on the projects undertaken by the IT department and its monitoring and analytics by the accounting and finance department of the organization.Showcasing this set of slides titled IT Department Project Costs Performance Monitoring Dashboard Demonstration PDF. The topics addressed in these templates are Return Investment, Cost Break, Costs Revenue. All the content presented in this PPT design is completely editable. Download it and make adjustments in color, background, font etc. as per your unique business setting.
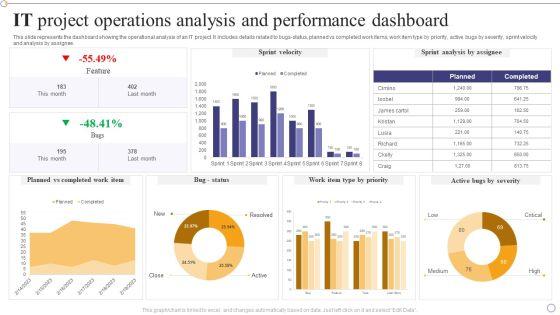
This slide represents the dashboard showing the operational analysis of an IT project. It includes details related to bugs-status, planned vs completed work items, work item type by priority, active bugs by severity, sprint velocity and analysis by assignee.Showcasing this set of slides titled IT Project Operations Analysis And Performance Dashboard Themes PDF. The topics addressed in these templates are Planned Completed, Sprint Analysis, Feature. All the content presented in this PPT design is completely editable. Download it and make adjustments in color, background, font etc. as per your unique business setting.


The following slide displays a dashboard to measure and track various IT key performance indicators. Various KPIs included are strategic process performance status, project budget, employee workload, tasks due, etc. Showcasing this set of slides titled Dashboard To Measure Information Technology Project Plan And Strategy Performance Designs PDF. The topics addressed in these templates are Strategy Designing, Implementation, Overall Progress. All the content presented in this PPT design is completely editable. Download it and make adjustments in color, background, font etc. as per your unique business setting.


This slide represents the cobots performance dashboard by covering details of battery level, performance, total hours, average time, time to return, energy consumption, and so on. If you are looking for a format to display your unique thoughts, then the professionally designed Collaborative Robots IT Dashboard To Track Cobot Performance Ppt Slides Guidelines PDF is the one for you. You can use it as a Google Slides template or a PowerPoint template. Incorporate impressive visuals, symbols, images, and other charts. Modify or reorganize the text boxes as you desire. Experiment with shade schemes and font pairings. Alter, share or cooperate with other people on your work. Download Collaborative Robots IT Dashboard To Track Cobot Performance Ppt Slides Guidelines PDF and find out how to give a successful presentation. Present a perfect display to your team and make your presentation unforgettable.
This slide describes the performance tracking dashboard for 5G technology by covering the details of subscribers, qoe, consumption, customer support, coverage, devices, and dimensions.Find a pre-designed and impeccable Performance Tracking Dashboard For 5G Technology Difference Between 4G And 5G Network Introduction PDF. The templates can ace your presentation without additional effort. You can download these easy-to-edit presentation templates to make your presentation stand out from others. So, what are you waiting for Download the template from Slidegeeks today and give a unique touch to your presentation.
This slide shows the dashboard of technology advancement project. It includes overview, status, budget, risks, working days etc. Showcasing this set of slides titled Technology Improvement Project Performance Tracking Dashboard Ppt Icon Backgrounds PDF. The topics addressed in these templates are Overall Progress, Planning, Design. All the content presented in this PPT design is completely editable. Download it and make adjustments in color, background, font etc. as per your unique business setting.


This slide shows the dashboard of cyber protection with incident and threat management. It includes overall progress, risk identified, number of critical incidents, initiatives, incident and threat management etc. Pitch your topic with ease and precision using this KPI Dashboard To Track IT Protection Performance Elements PDF. This layout presents information on Incident Management, Threat Management, Critital Risks Identified. It is also available for immediate download and adjustment. So, changes can be made in the color, design, graphics or any other component to create a unique layout.
This slide describes the performance tracking dashboard for 5G technology by covering the details of subscribers, QoE, consumption, customer support, coverage, devices, and dimensions.Deliver and pitch your topic in the best possible manner with this Performance Tracking Dashboard For 5G Technology Comparative Analysis Of 4G And 5G Technologies Ideas PDF. Use them to share invaluable insights on Quality Experience, Consumption, Customer Support and impress your audience. This template can be altered and modified as per your expectations. So, grab it now.


Mentioned slide outlines key performance indicator KPI dashboard which can be used by organization post introduction IT servives. The major metrics covered in the template are total work, events per month, response time, etc. Showcasing this set of slides titled KPI Dashboard To Measure Organization Performance Post Introduction Of IT Services Rules PDF. The topics addressed in these templates are Event Response, Total Work, Events Per. All the content presented in this PPT design is completely editable. Download it and make adjustments in color, background, font etc. as per your unique business setting.
5G And 4G Networks Comparative Analysis Performance Tracking Dashboard For 5G Technology Designs PDF
This slide describes the performance tracking dashboard for 5G technology by covering the details of subscribers, QoE, consumption, customer support, coverage, devices, and dimensions. Deliver an awe inspiring pitch with this creative 5G And 4G Networks Comparative Analysis Performance Tracking Dashboard For 5G Technology Designs PDF bundle. Topics like Consumption, Customer Support, Quality can be discussed with this completely editable template. It is available for immediate download depending on the needs and requirements of the user.


The following slide highlights the dashboard of DevOps with focuses on the items involved in project and also illustrates the bug involved in project. Showcasing this set of slides titled Software Development And IT Operation Dashboard Indicating Project Performance Demonstration PDF. The topics addressed in these templates are Software Development, IT Operation Dashboard, Indicating Project Performance. All the content presented in this PPT design is completely editable. Download it and make adjustments in color, background, font etc. as per your unique business setting.
This slide describes the performance tracking dashboard for 5G technology by covering the details of subscribers, QoE, consumption, customer support, coverage, devices, and dimensions. Deliver an awe inspiring pitch with this creative Analyzing 5G Impact Over 4G Performance Tracking Dashboard For 5G Technology Introduction PDF Introduction PDF bundle. Topics like Subscriber Quality, Consumption, Customer Support can be discussed with this completely editable template. It is available for immediate download depending on the needs and requirements of the user.
This slide represents the performance tracking dashboard for Naas, covering service availability, inventory details, software compliance status, service level agreement, alert notifications, number of changes and incidents. Deliver an awe inspiring pitch with this creative Naas Integrated Solution IT Network As A Service Performance Tracking Dashboard Formats PDF bundle. Topics like Network As A Service, Performance Tracking Dashboard can be discussed with this completely editable template. It is available for immediate download depending on the needs and requirements of the user.


Following slide portrays performance measurement dashboard for FinTech companies with KPIs namely available cash, cash flow, ROA, working capital ratio, days sales outstanding and days payable outstanding. Deliver an awe inspiring pitch with this creative Technology Investment To Enhance Business Growth Performance Measurement KPI Dashboard For Fintech Firm Slides PDF bundle. Topics like Available Cash, Cash Flow, Return On Assets, Working Capital Ratio can be discussed with this completely editable template. It is available for immediate download depending on the needs and requirements of the user.
This slide depicts the conformance testing performance tracking dashboard by covering details of test case analysis, tests linked to requirements, test case breakdown, tests per requirement, and so on. Deliver and pitch your topic in the best possible manner with this Compliance Testing IT Conformance Testing Performance Tracking Dashboard Introduction PDF. Use them to share invaluable insights on Requirements, Analysis, Resources and impress your audience. This template can be altered and modified as per your expectations. So, grab it now.
Mentioned slide portrays KPI dashboard that can be used by organizations to measure their business performance post AI introduction. KPIS covered here are progress, Before versus After AI Implementation, risks issues.Deliver an awe inspiring pitch with this creative Artificial Intelligence For IT Operations Playbook KPI Dashboard For Tracking Business Performance Slides PDF bundle. Topics like Kpi Dashboard, Tracking Business, Performance can be discussed with this completely editable template. It is available for immediate download depending on the needs and requirements of the user.


This slide shows KPI dashboard for measuring information technology business performance which can be referred by technical organizations to analyze their annual performance. It includes information about monthly recurring revenue, customer acquisition cost, signups and paying customers, visitors and signups, runway, etc. Showcasing this set of slides titled KPI Dashboard For Measuring Information Technology Business Performance Designs PDF. The topics addressed in these templates are Signups And Paying, Customers Monthly Growth, Visitors And Signups, Monthly Average Revenue. All the content presented in this PPT design is completely editable. Download it and make adjustments in color, background, font etc. as per your unique business setting.


This slide shows information technology dashboard to monitor performance of technical operations which can be referred by IT heads to control the backend working of resources. It contains information such as status of tickets, classification, customer, service level agreement, response, etc. Showcasing this set of slides titled IT Performance Dashboard To Monitor Performance Of Technical Operations Download PDF. The topics addressed in these templates are Overall Raised Tickets, Dangerous High Medium, Service Level Agreement, Customer Wise Tickets. All the content presented in this PPT design is completely editable. Download it and make adjustments in color, background, font etc. as per your unique business setting.


This slide shows information technology dashboard indicating website traffic analysis which can be beneficial for IT managers for making changes to drive more visitors into their websites. It includes information about locational sessions, bounce rate, medium classification, user vs new user, etc. Pitch your topic with ease and precision using this IT Performance Dashboard Indicating Website Traffic Analysis Background PDF. This layout presents information on Medium Classification Rate, Average Session Duration, Locational Sessions Bounce. It is also available for immediate download and adjustment. So, changes can be made in the color, design, graphics or any other component to create a unique layout.


This slide shows information technology dashboard for server performance monitoring which can be referred by technical heads to improve the working of servers. It includes information about server uptime and downtime, IT support, downtime issue, unsolved tickets, etc. Showcasing this set of slides titled IT Performance Dashboard For Server Performance Monitoring Portrait PDF. The topics addressed in these templates are IT Support Employee, Per Thousand Enduser, Uptime And Downtime, Count And Percentage. All the content presented in this PPT design is completely editable. Download it and make adjustments in color, background, font etc. as per your unique business setting.


This slide shows information technology dashboard depicting user activity which can be referred by IT managers to track leads and make decisions. It includes information about sessions, signups, position, size, industry, customers, quality leads, etc. Pitch your topic with ease and precision using this IT Performance Dashboard Depicting User Activity Inspiration PDF. This layout presents information on Monthly Recurring Revenue, Average Revenue Per, Account Quality Leads, Customers Position Sessions. It is also available for immediate download and adjustment. So, changes can be made in the color, design, graphics or any other component to create a unique layout.


Mentioned slide portrays a dashboard for measuring business performance. Performance metrics covered in the slide are average weekly sales revenue, average revenue per unit, customer lifetime value and customer acquisition cost. Deliver and pitch your topic in the best possible manner with this IT Consolidation Post Mergers And Acquisition Dashboard To Measure Business Performance Clipart PDF. Use them to share invaluable insights on Average Revenue, Customer Lifetime Value, Sales Revenue, Sales Target and impress your audience. This template can be altered and modified as per your expectations. So, grab it now.


Following slide portrays performance monitoring dashboard that can be used by organization to track its project team efficiency. It also covers details about billable and non-billable hours with task completion status. Deliver and pitch your topic in the best possible manner with this Why Is Agile Cost Effective IT Project Team Performance Monitoring Dashboard Sample PDF. Use them to share invaluable insights on Completion, Days Lapsed, Days Lapsed, Hours Spent By Employees and impress your audience. This template can be altered and modified as per your expectations. So, grab it now.


This slide represents the dashboard showing the performance of the service desk management team of the organization. It shows details related to benchmark achieved, customer satisfaction, contracts by type and manufacturer, incidents by category, computer by status, service level management etc. Showcasing this set of slides titled Organization IT Service Desk Administration Performance Dashboard Infographics PDF. The topics addressed in these templates are Service, Management, Manufacturer. All the content presented in this PPT design is completely editable. Download it and make adjustments in color, background, font etc. as per your unique business setting.
This slide represents the dashboard for reverse proxy performance tracking by covering details of CPU load, available memory, and connections. Deliver and pitch your topic in the best possible manner with this reverse proxy server it dashboard for reverse proxy performance tracking ppt infographics pictures pdf. Use them to share invaluable insights on dashboard reverse, proxy performance tracking and impress your audience. This template can be altered and modified as per your expectations. So, grab it now.

This slide depicts the dashboard for monitoring reverse proxy server performance by covering metrics, log analytics, traces, and infrastructure. Deliver and pitch your topic in the best possible manner with this it dashboard for monitoring reverse proxy server performance ppt ideas example pdf. Use them to share invaluable insights on metrics, log analytics, traces and impress your audience. This template can be altered and modified as per your expectations. So, grab it now.


This slide depicts the dashboard for the web development, and it covers the details of yearly turnover, clients information, and revenues, analytics, and statistics of the organization. Deliver an awe inspiring pitch with this creative website programming it dashboard for website programming project performance inspiration pdf bundle. Topics like open projects, successfully completed, earned month, analytics, statistics can be discussed with this completely editable template. It is available for immediate download depending on the needs and requirements of the user.


This slide shows the performance dashboard after the implementation based on network topology, node details, changes in default route, and so on. Deliver an awe inspiring pitch with this creative fddi network standard it performance dashboard post fddi implementation ppt slides background pdf bundle. Topics like performance dashboard post fddi implementation can be discussed with this completely editable template. It is available for immediate download depending on the needs and requirements of the user.


This slide portrays performance monitoring dashboard that can be used by organization to track its DevOps team efficiency. It also covers details about billable and non-billable hours with task completion status.Deliver and pitch your topic in the best possible manner with this devops principles for hybrid cloud it devops team performance monitoring dashboard infographics pdf Use them to share invaluable insights on devops team performance monitoring dashboard and impress your audience. This template can be altered and modified as per your expectations. So, grab it now.


This slide focuses on product management dashboard to measure performance that includes actions, active users, new document uploads with percent change, signatures, new promoter score, etc. Deliver an awe inspiring pitch with this creative product lifecycle management it product management dashboard to measure performance mockup pdf bundle. Topics like product management dashboard to measure performance can be discussed with this completely editable template. It is available for immediate download depending on the needs and requirements of the user.


This slide shows dashboard of metrics of product such as revenue, new customers, customer satisfaction, sales comparison, revenue by customer, source , etc. Deliver an awe inspiring pitch with this creative product lifecycle management it dashboard showing product performance kpis inspiration pdf bundle. Topics like dashboard showing product performance kpis can be discussed with this completely editable template. It is available for immediate download depending on the needs and requirements of the user.


Following slide portrays performance monitoring dashboard that can be used by organization to track its project team efficiency. It also covers details about billable and non billable hours with task completion status.Deliver an awe inspiring pitch with this creative cost saving with agile methodology it project team performance monitoring dashboard information pdf bundle. Topics like project team performance monitoring dashboard can be discussed with this completely editable template. It is available for immediate download depending on the needs and requirements of the user.


This slide depicts the dashboard for sales performance after the implementation of visualization research based on revenue, quantity, regional sales. Deliver and pitch your topic in the best possible manner with this graphical representation of research it sales performance dashboard sample pdf. Use them to share invaluable insights on sales performance dashboard after visualization research implementation and impress your audience. This template can be altered and modified as per your expectations. So, grab it now.


This slide describes the dashboard for web application firewall performance monitoring by covering details of application attack distribution, HTTP transaction per second, application security events source map, DDOs protected traffic, and application security events. Deliver and pitch your topic in the best possible manner with this web app firewall services it dashboard for web application firewall performance microsoft pdf. Use them to share invaluable insights on application, source, security and impress your audience. This template can be altered and modified as per your expectations. So, grab it now.
The following slide displays a brand awareness dashboard as it highlights the key metrics for measuring brand awareness such as brand search, social media searches, links, brand and mentions Deliver an awe inspiring pitch with this creative ping new product messaging canvas determining its usp product performance dashboard icons pdf bundle. Topics like product performance dashboard with total revenues can be discussed with this completely editable template. It is available for immediate download depending on the needs and requirements of the user.


This template covers DevOps global performance metrics such as deployment frequency trends, change failure trends and time to resolve trends etc. Deliver an awe inspiring pitch with this creative development and operations kpi dashboard it global devops performance metrics themes pdf bundle. Topics like global devops performance metrics can be discussed with this completely editable template. It is available for immediate download depending on the needs and requirements of the user.
This template covers DevOps assessment key performance indicators such as activity by application, storefront users, revenue by hours etc. Deliver an awe inspiring pitch with this creative development and operations kpi dashboard it devops performance kpi dashboard icons pdf bundle. Topics like revenue, service can be discussed with this completely editable template. It is available for immediate download depending on the needs and requirements of the user.


Mentioned slide portrays a dashboard for measuring business performance. Performance metrics covered in the slide are average weekly sales revenue, average revenue per unit, customer lifetime value and customer acquisition cost. Deliver and pitch your topic in the best possible manner with this it service incorporation and administration dashboard to measure business performance portrait pdf. Use them to share invaluable insights on sales, revenue, target, acquisition cost and impress your audience. This template can be altered and modified as per your expectations. So, grab it now.


This slide represents the critical performance indicators of RPA, such as time and money saved by different processes and the efficiency of the HR department in routine tasks. Deliver an awe inspiring pitch with this creative rpa it dashboard to measure performance of rpa implementation ppt professional pictures pdf bundle. Topics like processes, finance, supply chain, analysis, payroll can be discussed with this completely editable template. It is available for immediate download depending on the needs and requirements of the user.


This slide represents the key performance indicators of RPA such as intelligence, dependability, performance, quality services and staff morale. This is a rpa it what are the key performance indicators kpis of rpa ppt professional design templates pdf template with various stages. Focus and dispense information on five stages using this creative set, that comes with editable features. It contains large content boxes to add your information on topics like staff morale, quality services, performance, dependability, intelligence. You can also showcase facts, figures, and other relevant content using this PPT layout. Grab it now.


This Slide provides a detailed overview of health information system market analysis. It covers region wise annual growth insights. Showcasing this set of slides titled health it system business performance dashboard ppt summary file formats pdf. The topics addressed in these templates are market contributes, cloud segment, revenue contributing. All the content presented in this PPT design is completely editable. Download it and make adjustments in color, background, font etc. as per your unique business setting.
Deliver and pitch your topic in the best possible manner with this team forming for it project team performance dashboard ppt icon visuals pdf. Use them to share invaluable insights on team performance dashboard and impress your audience. This template can be altered and modified as per your expectations. So, grab it now.


Deliver an awe inspiring pitch with this creative marketing technology stack performance measurement kpis professional pdf bundle. Topics like performance metrics, digital advertisement, average response time, technology types can be discussed with this completely editable template. It is available for immediate download depending on the needs and requirements of the user.


The purpose of the following slide is to display various metrices and key performing indicators to measure the future performance of the marketing technology stack. Deliver and pitch your topic in the best possible manner with this marketing technology stack performance measurement dashboard demonstration pdf. Use them to share invaluable insights on average response time, user satisfaction score, error rate and impress your audience. This template can be altered and modified as per your expectations. So, grab it now.


Presenting this set of slides with name brand identity how build it brand performance dashboard ppt professional mockup pdf. This is a three stage process. The stages in this process are customer recognition, enhanced sales, competitive edge. This is a completely editable PowerPoint presentation and is available for immediate download. Download now and impress your audience.


This slide depicts the performance tracking dashboard for hyper-automation, covering the number of rules triggered, automated emails, average originator, recipient, average click-through rate for automated emails, and quick links.Formulating a presentation can take up a lot of effort and time, so the content and message should always be the primary focus. The visuals of the PowerPoint can enhance the presenters message, so our Hyperautomation Performance Tracking Dashboard Hyperautomation Software Solutions IT Summary PDF was created to help save time. Instead of worrying about the design, the presenter can concentrate on the message while our designers work on creating the ideal templates for whatever situation is needed. Slidegeeks has experts for everything from amazing designs to valuable content, we have put everything into Hyperautomation Performance Tracking Dashboard Hyperautomation Software Solutions IT Summary PDF.
SHOW
- 60
- 120
- 180
DISPLAYING: 60 of 66 Item(s)
Page