AI PPT Maker
Templates
PPT Bundles
Design Services
Business PPTs
Business Plan
Management
Strategy
Introduction PPT
Roadmap
Self Introduction
Timelines
Process
Marketing
Agenda
Technology
Medical
Startup Business Plan
Cyber Security
Dashboards
SWOT
Proposals
Education
Pitch Deck
Digital Marketing
KPIs
Project Management
Product Management
Artificial Intelligence
Target Market
Communication
Supply Chain
Google Slides
Research Services
 One Pagers
All Categories
Indexing PowerPoint Presentation Templates and Google Slides
SHOW
- 60
- 120
- 180
DISPLAYING: 60 of 196 Item(s)
Page









Slide 1 of 49
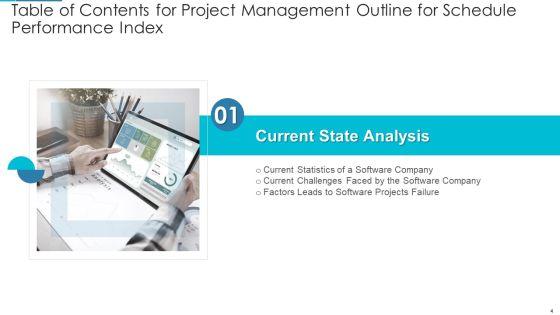
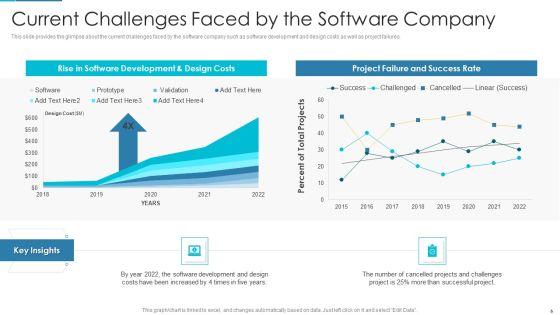
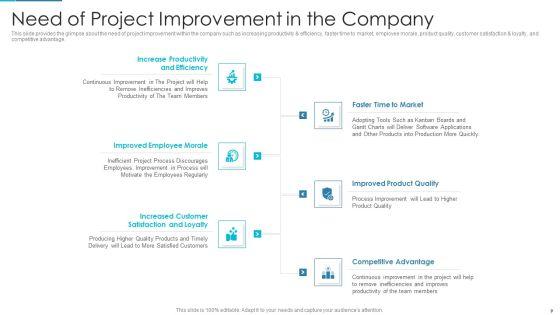
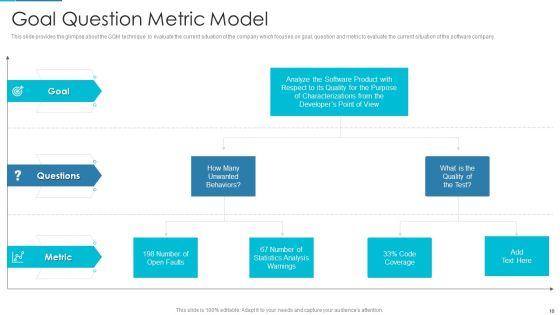
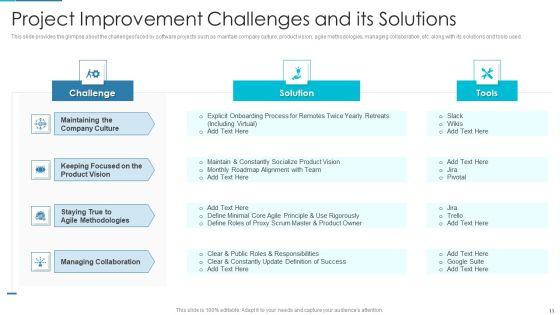
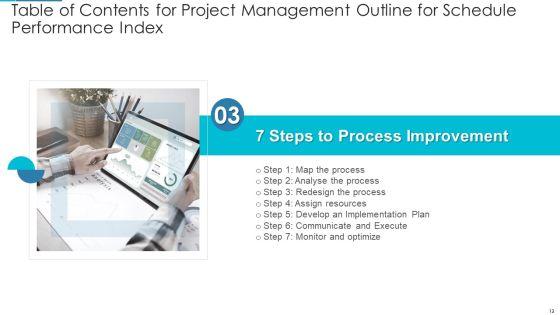
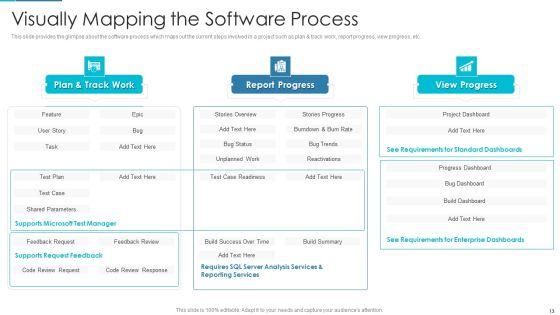
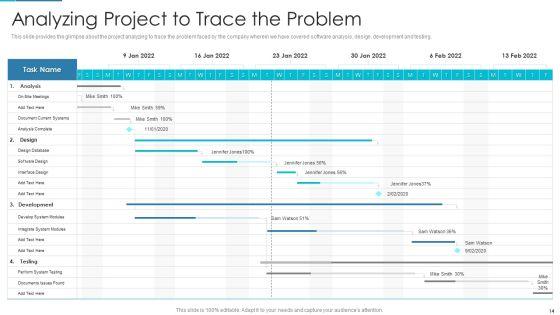
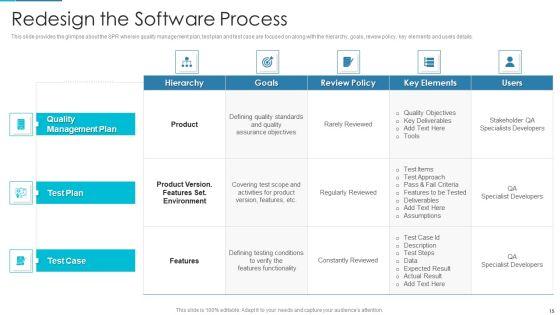
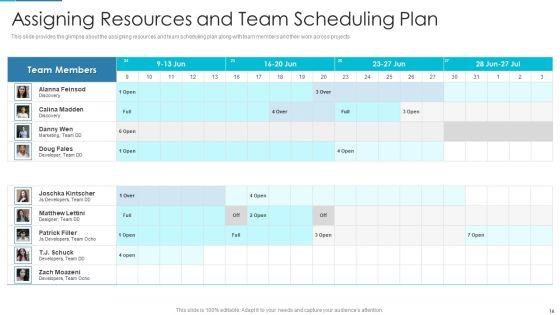
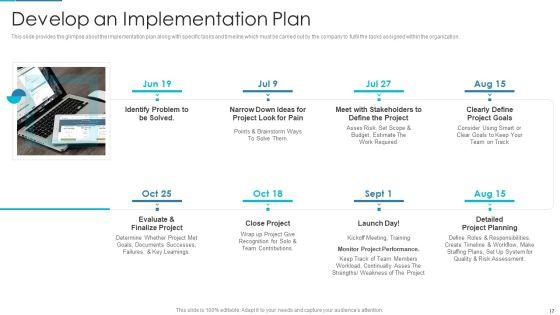
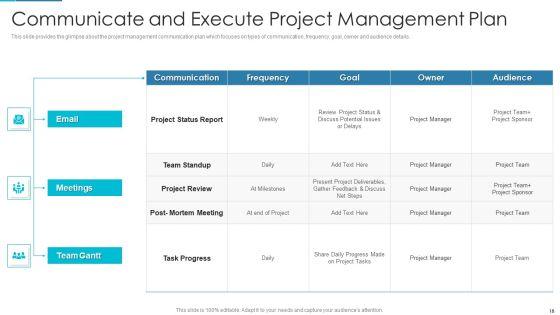
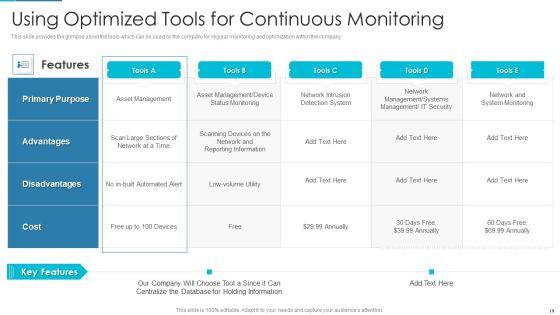
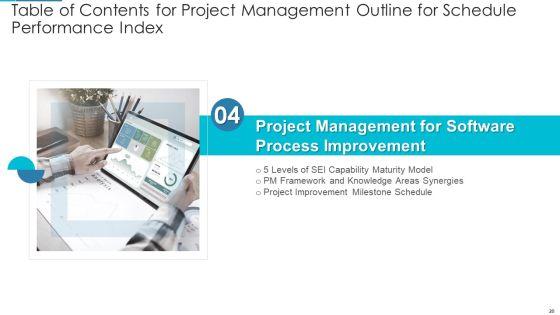
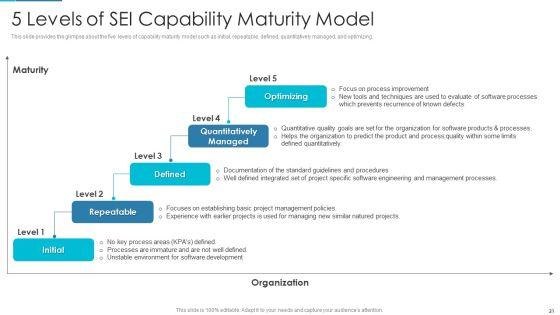
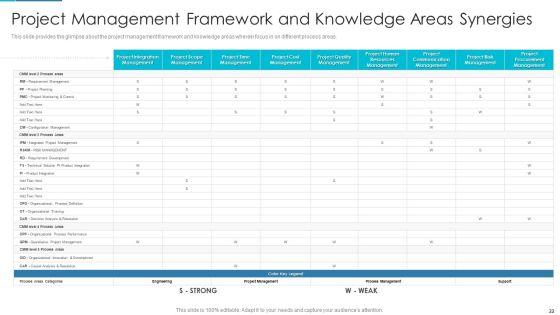
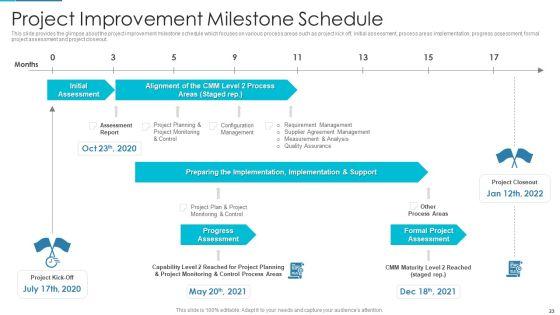
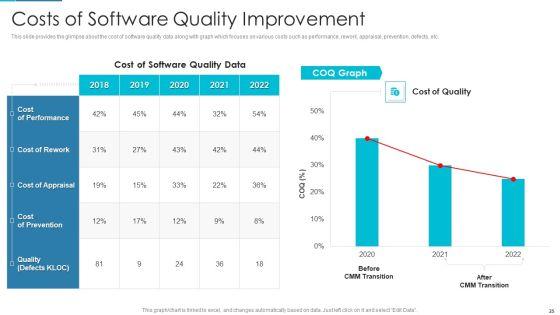
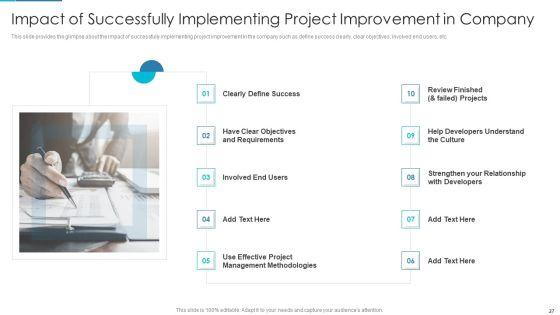
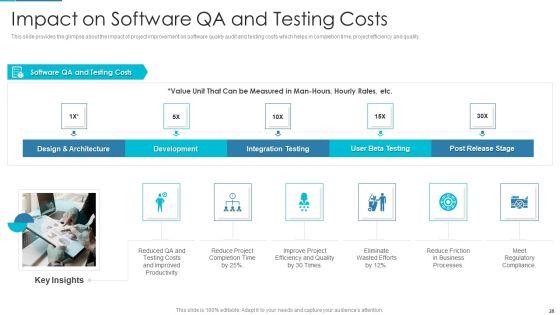
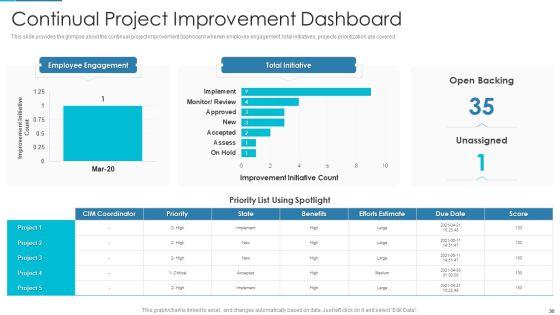
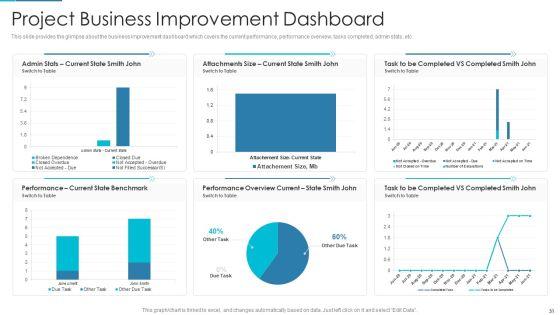
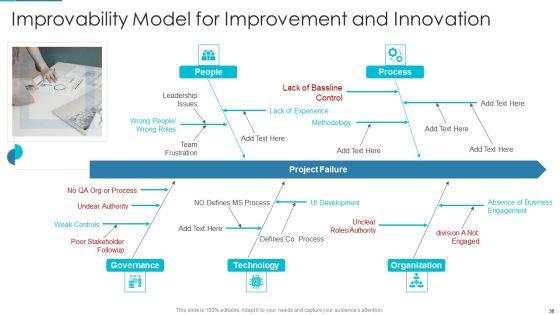
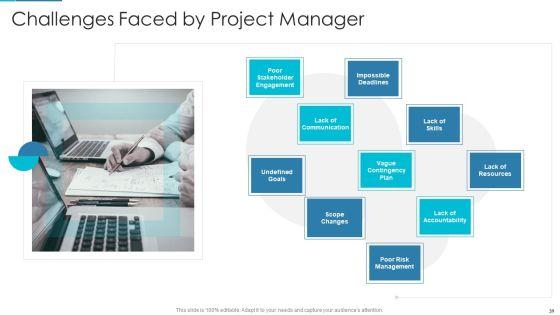
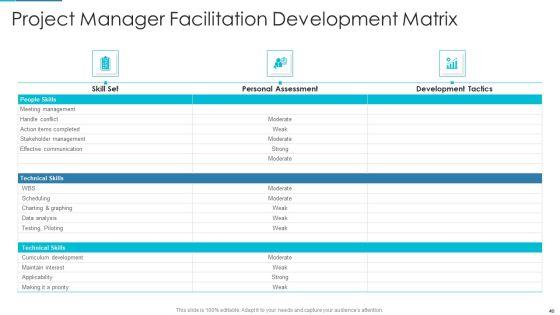
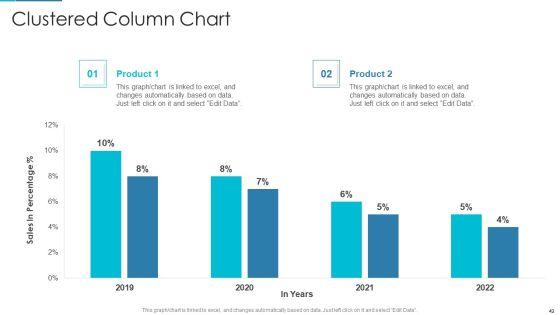
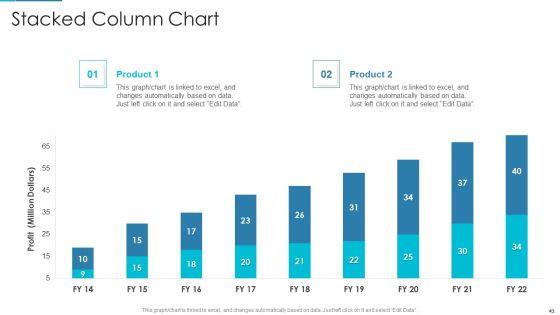
Pitch yourself both in house and outside by utilizing this complete deck. This project management outline for schedule performance index ppt powerpoint presentation complete deck with slides focuses on key fundamentals of the topic, displayed using different slides. With a total of forty nine slides, this template is the best tool you can use to persuade your audience. It will not only help you create great presentations but also induce strategic thinking because of its well researched content and graphics. You can easily personalize any of the elements to suit your unique business setting. Additionally, it can be saved in PNG, JPG, and PDF formats to save your time and resources.


Slide 1 of 14
Presenting Comprehending Site Crawling, Indexing, Sitemaps in Google Search Console. This slide is well crafted and designed by our PowerPoint specialists. This PPT presentation is thoroughly researched by the experts, and every slide consists of appropriate content. You can add or delete the content as per your need.


Slide 1 of 13
If designing a presentation takes a lot of your time and resources and you are looking for a better alternative, then this Annual Retirement Index Ppt PowerPoint Presentation Complete Deck With Slides is the right fit for you. This is a prefabricated set that can help you deliver a great presentation on the topic. All the thriteen slides included in this sample template can be used to present a birds-eye view of the topic. These slides are also fully editable, giving you enough freedom to add specific details to make this layout more suited to your business setting. Apart from the content, all other elements like color, design, theme are also replaceable and editable. This helps in designing a variety of presentations with a single layout. Not only this, you can use this PPT design in formats like PDF, PNG, and JPG once downloaded. Therefore, without any further ado, download and utilize this sample presentation as per your liking.


Slide 1 of 12
Boost your confidence and team morale with this well-structured Customer Satisfaction Index Strategy Ppt PowerPoint Presentation Complete Deck With Slides. This prefabricated set gives a voice to your presentation because of its well-researched content and graphics. Our experts have added all the components very carefully, thus helping you deliver great presentations with a single click. Not only that, it contains a set of Twelve slides that are designed using the right visuals, graphics, etc. Various topics can be discussed, and effective brainstorming sessions can be conducted using the wide variety of slides added in this complete deck. Apart from this, our PPT design contains clear instructions to help you restructure your presentations and create multiple variations. The color, format, design anything can be modified as deemed fit by the user. Not only this, it is available for immediate download. So, grab it now.


Slide 1 of 11
This slide provides information regarding the search engine working process. The three major steps discussed are crawling, indexing, and ranking.


Slide 1 of 11
This slide provides an overview of LSI keywords in SEO. It also includes details of tools to find appropriate latent semantic indexing keywords such as Google autocomplete and related searches, LSI graph, etc.


Slide 1 of 7
This is a what if index powerpoint slide graphics. This is a three stage process. The stages in this process are business, management, marketing, table, success.


Slide 1 of 7
This is a human capital index diagram powerpoint slides show. This is a six stage process. The stages in this process are engagement, execution, creativity, knowledge, human capital, change agility.


Slide 1 of 7
This is a process of video indexing and retrieval ppt powerpoint layout. This is a two stage process. The stages in this process are retrieved data, content based analysis, query data, input video, video segmentation, scene shot database, query processor, index database.


Slide 1 of 7
This is a tender price index presentation ideas. This is a seven stage process. The stages in this process are tender price index, change order rate, employee competency index, staff turnover rate, employee attitude index, payment and close out cycle, committed cost rate.


Slide 1 of 7
This is a basics of crawling and indexing websites ppt slides. This is a one stage process. The stages in this process are url server, crawlers, urls, indexer, links, page rank, sorter, buckets, searcher.


Slide 1 of 7
This is a combined index portfolio template powerpoint show. This is a five stage process. The stages in this process are revenue, cash flow, assets, profit, equity.


Slide 1 of 7
This is a sample of net promoter index diagram powerpoint slide backgrounds. This is a ten stage process. The stages in this process are not at all likely, neutral, extremely likely, detractors, passives, promoters, nps, percentage detractors, percentage of promoters.


Slide 1 of 7
This is a balance scorecard index dashboard ppt slides. This is a one stage process. The stages in this process are sales by month, gross revenue, customer retention, executive scorecard, measures, status, trend, financial, option, customer, internal processes, learning and growth.


Slide 1 of 6
This is a cost performance index ppt powerpoint presentation styles vector. The topics discussed in this diagram are finance, marketing, management, investment, analysis. This is a completely editable PowerPoint presentation, and is available for immediate download.


Slide 1 of 6
This is a cost performance index ppt powerpoint presentation model images. This is a two stage process. The stages in this process are finance, analysis, business, investment, marketing.


Slide 1 of 6
This is a cost performance index ppt powerpoint presentation infographics mockup. This is a three stage process. The stages in this process are finance, marketing, management, investment, product, percentage.


Slide 1 of 6
This is a cost performance index project ppt powerpoint presentation pictures design ideas. This is a two stage process. The stages in this process are business, finance, strategy, analysis, marketing.


Slide 1 of 6
This is a cost performance index ppt powerpoint presentation inspiration graphics example. This is a three stage process. The stages in this process are business, management, marketing, percentage, product.


Slide 1 of 5
Presenting this set of slides with name components of it complexity index ppt powerpoint presentation portfolio designs. The topics discussed in these slides are business, icons, marketing, strategy, process. This is a completely editable PowerPoint presentation and is available for immediate download. Download now and impress your audience.


Slide 1 of 5
Presenting this set of slides with name components of it complexity index ppt powerpoint presentation ideas gridlines. The topics discussed in these slides are business, management, planning, strategy, marketing. This is a completely editable PowerPoint presentation and is available for immediate download. Download now and impress your audience.


Slide 1 of 5
Presenting this set of slides with name component of it complexity index ppt powerpoint presentation visual aids. The topics discussed in these slides are marketing, management, table, planning, analysis. This is a completely editable PowerPoint presentation and is available for immediate download. Download now and impress your audience.


Slide 1 of 5
This is a consumer confidence index ppt powerpoint presentation ideas images cpb. This is a four stage process. The stages in this process are consumer confidence index.


Slide 1 of 5
This is a stock indexes comparison table ppt powerpoint presentation show inspiration. The topics discussed in this diagram are management, marketing, business, strategy, planning. This is a completely editable PowerPoint presentation, and is available for immediate download.

Slide 1 of 5
This is a stock index futures and options ppt powerpoint presentation styles sample. This is a five stage process. The stages in this process are management, marketing, business, strategy, planning.


Slide 1 of 5
This is a stock indexes comparison table ppt powerpoint presentation inspiration guide. The topics discussed in this diagram are business, management, marketing, compare. This is a completely editable PowerPoint presentation, and is available for immediate download.



Slide 1 of 5
This is a stock index futures and options ppt powerpoint presentation outline skills. This is a five stage process. The stages in this process are business, management, marketing, compare.


Slide 1 of 5
This is a stock indexes comparison table ppt powerpoint presentation deck. This is a two stage process. The stages in this process are business, management, marketing, compare.


Slide 1 of 5
This is a stock index futures and options ppt powerpoint presentation portfolio information. This is a five stage process. The stages in this process are business, management, marketing, compare.


Slide 1 of 5
This is a employee engagement index ppt powerpoint presentation file visuals cpb. This is a five stage process. The stages in this process are employee engagement index.


Slide 1 of 5
This is a stock indexes comparison table ppt powerpoint presentation portfolio graphics template. This is a four stage process. The stages in this process are business, management, marketing, compare.


Slide 1 of 5
This is a stock index futures and options ppt powerpoint presentation styles design templates. This is a five stage process. The stages in this process are business, management, marketing, compare.
Slide 1 of 5
This is a cost performance index ppt powerpoint presentation icon information. This is a three stage process. The stages in this process are finance, analysis, business, investment, marketing.


Slide 1 of 5
This is a customer engagement index ppt powerpoint presentation infographic template brochure cpb. This is a two stage process. The stages in this process are customer engagement index.


Slide 1 of 5
This is a add local business business confidence index performance management ppt powerpoint presentation infographic template styles. This is a five stage process. The stages in this process are add local business, business confidence index, performance management.


Slide 1 of 5
This is a social media benchmarking page index data points ppt powerpoint presentation infographics show. This is a six stage process. The stages in this process are competitive analysis, benchmark competition, competition landscape.


Slide 1 of 5
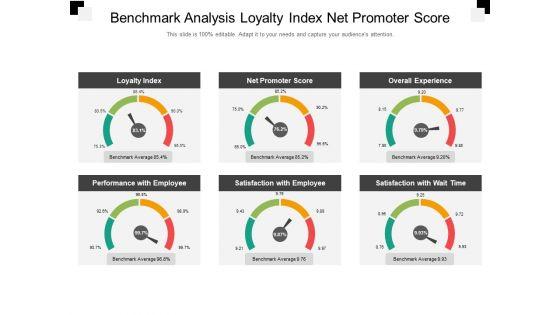
This is a benchmark analysis loyalty index net promoter score ppt powerpoint presentation inspiration gridlines. This is a six stage process. The stages in this process are competitive analysis, benchmark competition, competition landscape.


Slide 1 of 5
This is a cost performance index cpi ppt powerpoint presentation summary graphics. This is a two stage process. The stages in this process are cost performance index, finance, business, analysis, investment.
Slide 1 of 5
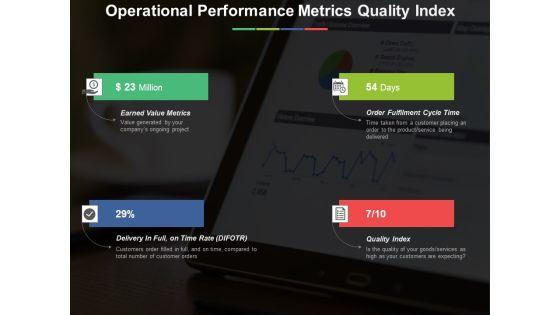
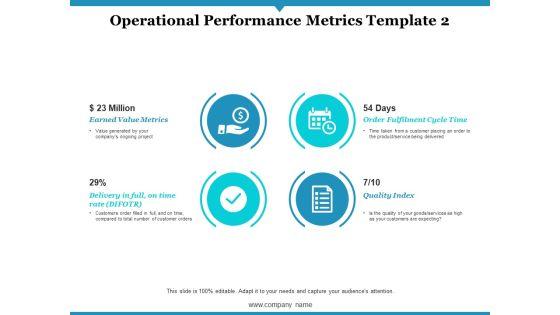
This is a operational performance metrics quality index ppt powerpoint presentation summary layout ideas. This is a four stage process. The stages in this process are earned value metrics, order fulfilment cycle time, quality index, delivery in full on time rate.


Slide 1 of 5
This is a cost performance index ppt powerpoint presentation infographics themes. This is a two stage process. The stages in this process are cost performance index, ev term, value, finance.
Slide 1 of 5
This is a operational performance metrics quality index ppt powerpoint presentation infographic template example 2015. This is a four stage process. The stages in this process are earned value metrics, order fulfilment cycle time, delivery in full on time rate, quality index.


Slide 1 of 5
This is a cost performance index ppt powerpoint presentation portfolio examples. This is a three stage process. The stages in this process are cost performance index, schedule performance index, cost performance index und schedule performance index, project name.


Slide 1 of 5
This is a real estate home price index ppt powerpoint presentation portfolio graphics. This is a one stage process. The stages in this process are business, finance, marketing, strategy, investment, analysis.


Slide 1 of 5
This is a real estate home price index ppt powerpoint presentation styles influencers. This is a one stage process. The stages in this process are graph, growth, jan, feb, mar apr.


Slide 1 of 5
This is a real estate home price index ppt powerpoint presentation samples. This is a one stage process. The stages in this process are in percentage, business, bar graph, marketing, success, management.


Slide 1 of 5
This is a real estate home price index ppt powerpoint presentation example. This is a one stage process. The stages in this process are bar graph, business, marketing, success, management.


Slide 1 of 5
This is a real estate home price index template 2 ppt powerpoint presentation pictures. This is a one stage process. The stages in this process are finance, planning, management, marketing, strategy.


Slide 1 of 5
This is a real estate home price index template 1 ppt powerpoint presentation graphics. This is a eight stage process. The stages in this process are honolulu, san jose, san francisco, anaheim, new york white plains, new york long island, san diego.


Slide 1 of 4
This is a process capability index ppt diagrams. This is a nine stage process. The stages in this process are lsl, target, usl, category.


Slide 1 of 4
This is a kpi index dashboard diagram example of ppt. This is a four stage process. The stages in this process are revenue, products, operations, manufacturing.


Slide 1 of 4
This is a customer satisfaction index calculation diagram ppt sample. This is a three stage process. The stages in this process are scale, efficiency, quality.


Slide 1 of 4
This is a finance benchmarking index dashboard example of ppt. This is a six stage process. The stages in this process are industry, company, government, litigation, economics, credit.


Slide 1 of 4
This business slide contains five steps circle chart. This diagram may be used to display consumer price index. Visual effect this slide helps in maintaining the flow of the discussion and provides more clarity to the subject.


Slide 1 of 4
Our above PPT slide displays diagram of circle infographic. You may download this slide to present consumer price index. Grab the center stage with this professionally designed slide.


Slide 1 of 3
Concept of stock index has been displayed in this power point template. This business diagram contains the graphic of falling dominoes and hand. Use this slide to highlight your thought process.


Slide 1 of 3
A linear growth chart with text boxes has been used to decorate this Power Point template slide. This diagram slide contains the concept of poverty index. Use this index in your financial presentations to show poverty based calculation.


Slide 1 of 3
Microsoft PowerPoint Template and Background with this is an image of a body mass index chart with an apple and tape measure Experience the aesthetics of our Body Mass Index Chart Health PowerPoint Templates And PowerPoint Backgrounds 0211. They are created with brilliant design sense.


Slide 1 of 2
The slide showcases statistics highlighting adoption of greens technology by companies in sustainability market to identify growth rate. It includes elements like on and off premises cloud, costs saving, getting things done faster, better allocation of resources, priorities of business with speed and employee satisfaction, etc. Explore a selection of the finest Global Green Technology Adoption Index Infographics PDF here. With a plethora of professionally designed and pre made slide templates, you can quickly and easily find the right one for your upcoming presentation. You can use our Global Green Technology Adoption Index Infographics PDF to effectively convey your message to a wider audience. Slidegeeks has done a lot of research before preparing these presentation templates. The content can be personalized and the slides are highly editable. Grab templates today from Slidegeeks.


Slide 1 of 2
This slide showcases dashboard of human resource that can help HR manager to track change in KPIs as compared to previous month. Its key components are training effectiveness, 90 days quit rate and acceptance ratio. Pitch your topic with ease and precision using this Human Resource Metrics Dashboard With Engagement Index Guidelines PDF. This layout presents information on Absence Rate, Absence Cost, Benefits Satisfaction. It is also available for immediate download and adjustment. So, changes can be made in the color, design, graphics or any other component to create a unique layout.


Slide 1 of 2
Mentioned slide displays the results of brand asset test. It shows that logo having black background is having the highest emotional index value score.Boost your pitch with our creative Comprehensive Guide To Strengthen Brand Equity Test Conclusion Emotional Index Value Themes PDF. Deliver an awe inspiring pitch that will mesmerize everyone. Using these presentation templates you will surely catch everyones attention. You can browse the ppts collection on our website. We have researchers who are experts at creating the right content for the templates. So you do not have to invest time in any additional work. Just grab the template now and use them.
SHOW
- 60
- 120
- 180
DISPLAYING: 60 of 196 Item(s)
Page
