AI PPT Maker
Templates
PPT Bundles
Design Services
Business PPTs
Business Plan
Management
Strategy
Introduction PPT
Roadmap
Self Introduction
Timelines
Process
Marketing
Agenda
Technology
Medical
Startup Business Plan
Cyber Security
Dashboards
SWOT
Proposals
Education
Pitch Deck
Digital Marketing
KPIs
Project Management
Product Management
Artificial Intelligence
Target Market
Communication
Supply Chain
Google Slides
Research Services
 One Pagers
All Categories
Graph shows PowerPoint Presentation Templates and Google Slides
SHOW
- 60
- 120
- 180
DISPLAYING: 60 of 233 Item(s)
Page


Slide 1 of 6
Presenting this set of slides with name column chart graph ppt powerpoint presentation show model. The topics discussed in these slides are marketing, business, management, planning, strategy. This is a completely editable PowerPoint presentation and is available for immediate download. Download now and impress your audience.


Slide 1 of 6
Presenting this set of slides with name line graph for year to year comparison ppt powerpoint presentation show graphics example. The topics discussed in these slides are revenue trend, bar chart, financial. This is a completely editable PowerPoint presentation and is available for immediate download. Download now and impress your audience.


Slide 1 of 6
Presenting this set of slides with name bar chart graph ppt powerpoint presentation ideas show. The topics discussed in these slides are marketing, business, management, planning, strategy. This is a completely editable PowerPoint presentation and is available for immediate download. Download now and impress your audience.


Slide 1 of 6
Presenting this set of slides with name clustered bar graph ppt powerpoint presentation show graphic images. The topics discussed in these slides are marketing, business, management, planning, strategy. This is a completely editable PowerPoint presentation and is available for immediate download. Download now and impress your audience.


Slide 1 of 6
Presenting this set of slides with name graph with arrow showing financial downfall ppt powerpoint presentation summary objects. This is a three stage process. The stages in this process are loss, decrease graph, stock market. This is a completely editable PowerPoint presentation and is available for immediate download. Download now and impress your audience.
Slide 1 of 6
Presenting this set of slides with name bar graph for four years business result analysis ppt powerpoint presentation icon show. The topics discussed in these slides are financial targets, financial goals, growth profitability. This is a completely editable PowerPoint presentation and is available for immediate download. Download now and impress your audience.
Slide 1 of 6
Presenting this set of slides with name clustered column line graph ppt powerpoint presentation icon show. The topics discussed in these slides are business, planning, strategy, marketing, management. This is a completely editable PowerPoint presentation and is available for immediate download. Download now and impress your audience.
Slide 1 of 6
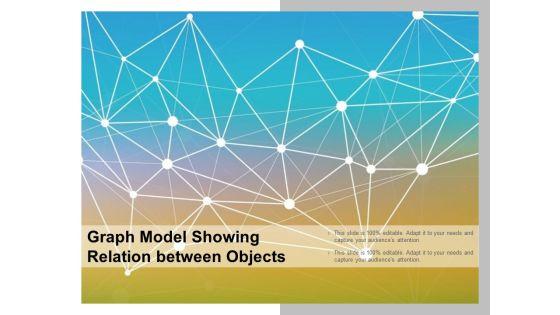
This is a graph model showing relation between objects ppt powerpoint presentation summary graphics tutorials. This is a two stage process. The stages in this process are graph theory, chart theory, business.


Slide 1 of 6
This is a waterfall graph with companys income and expenses ppt powerpoint presentation show example introduction. This is a three stage process. The stages in this process are profit and loss, balance sheet, income statement, benefit and loss.


Slide 1 of 6
This is a waterfall graph showing sales expenses revenue and taxes ppt powerpoint presentation pictures summary. This is a three stage process. The stages in this process are profit and loss, balance sheet, income statement, benefit and loss.


Slide 1 of 6
This is a waterfall graph showing net sales and gross profit ppt powerpoint presentation infographics format. This is a three stage process. The stages in this process are profit and loss, balance sheet, income statement, benefit and loss.


Slide 1 of 6
This is a waterfall graph showing monetary transactions ppt powerpoint presentation ideas visuals. This is a three stage process. The stages in this process are profit and loss, balance sheet, income statement, benefit and loss.




Slide 1 of 6
This is a waterfall graph showing cost of goods sold overhead and taxes ppt powerpoint presentation styles example topics. This is a three stage process. The stages in this process are profit and loss, balance sheet, income statement, benefit and loss.


Slide 1 of 6
This is a waterfall graph showing business progress ppt powerpoint presentation styles model. This is a three stage process. The stages in this process are profit and loss, balance sheet, income statement, benefit and loss.


Slide 1 of 6
This is a waterfall graph showing births deaths and population change ppt powerpoint presentation infographic template visual aids. This is a three stage process. The stages in this process are profit and loss, balance sheet, income statement, benefit and loss.


Slide 1 of 6
This is a waterfall profit and loss graph with cost of goods sold and taxes ppt powerpoint presentation show slideshow. This is a nine stage process. The stages in this process are sales waterfall, waterfall chart, business.


Slide 1 of 6
This is a sales graph showing payouts losses and wins ppt powerpoint presentation pictures designs download. This is a eight stage process. The stages in this process are sales waterfall, waterfall chart, business.



Slide 1 of 6
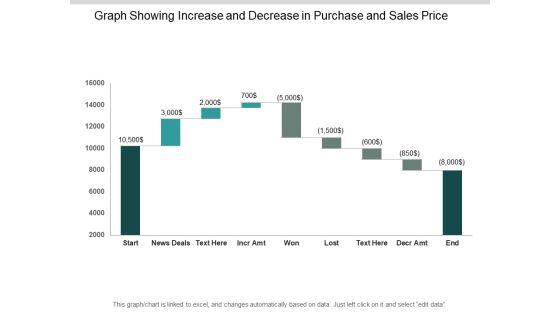
This is a graph showing increase and decrease in purchase and sales price ppt powerpoint presentation outline gallery. This is a nine stage process. The stages in this process are sales waterfall, waterfall chart, business.


Slide 1 of 6
This is a year by year sales revenue and unit profitability graph ppt powerpoint presentation show professional. This is a eight stage process. The stages in this process are business unit profitability, profitable organization, corporate unit profitability.


Slide 1 of 6
This is a area graph showing sales trends over time ppt powerpoint presentation model background designs. This is a three stage process. The stages in this process are financial analysis, quantitative, statistical modelling.


Slide 1 of 6
This is a financial charts and graphs for statistical analysis ppt powerpoint presentation show layout. This is a four stage process. The stages in this process are business metrics, business kpi, business dashboard.


Slide 1 of 6
This is a product comparison data bar graph ppt powerpoint presentation slides show. This is a four stage process. The stages in this process are data presentation, content presentation, information presentation.


Slide 1 of 6
This is a career promotion graph growth ppt powerpoint presentation infographics show. This is a three stage process. The stages in this process are career progression, career aspiration, career promotion powerpoint presentation slides.


Slide 1 of 5
Presenting this set of slides with name customer journey graph with reach acquisition and journey ppt powerpoint presentation show sample. This is a five stage process. The stages in this process are customer lifecycle, management, customer journey. This is a completely editable PowerPoint presentation and is available for immediate download. Download now and impress your audience.


Slide 1 of 5
Presenting this set of slides with name graph showing sales performance figures ppt powerpoint presentation infographics topics. This is a six stage process. The stages in this process are people graph, sales performance, population data demographics. This is a completely editable PowerPoint presentation and is available for immediate download. Download now and impress your audience.
Slide 1 of 5
Presenting this set of slides with name business outcomes vector icons showing pie and bar graph ppt powerpoint presentation file vector. This is a three stage process. The stages in this process are business outcomes, business results, business output. This is a completely editable PowerPoint presentation and is available for immediate download. Download now and impress your audience.
Slide 1 of 5
Presenting this set of slides with name business performance graph on screen icon ppt powerpoint presentation show layouts. This is a three stage process. The stages in this process are data visualization icon, research analysis, business focus. This is a completely editable PowerPoint presentation and is available for immediate download. Download now and impress your audience.
Slide 1 of 5
This is a financial gain growth graph vector icon ppt powerpoint presentation file show. The topics discussed in this diagram are increase icon, improved icon, growth icon. This is a completely editable PowerPoint presentation, and is available for immediate download.


Slide 1 of 5
This is a digital marketing and digital analysis graphs with magnifying glass ppt powerpoint presentation portfolio show. This is a seven stage process. The stages in this process are digital analytics, digital dashboard, marketing.


Slide 1 of 5
This is a bar graph to present financial information ppt powerpoint presentation show tips. This is a four stage process. The stages in this process are stock market, financial markets, bull market.
Slide 1 of 5
This is a business outcomes vector icons showing pie and bar graph ppt powerpoint presentation file graphic images. This is a three stage process. The stages in this process are business outcomes, business results, business output.


Slide 1 of 5
This is a scatter plot graph for quality standards ppt powerpoint presentation show infographics. This is a four stage process. The stages in this process are scatter plot, probability plots, plot diagram.


Slide 1 of 5
This is a plot graph showing climax resolution and action ppt powerpoint presentation outline themes. This is a five stage process. The stages in this process are scatter plot, probability plots, plot diagram.
Slide 1 of 5
This is a bar graph icon showing operating rhythm ppt powerpoint presentation ideas templates. This is a three stage process. The stages in this process are six sigma, operating rhythm, business rhythm.


Slide 1 of 5
This is a learning graph showing time and competence ppt powerpoint presentation slides format ideas. This is a four stage process. The stages in this process are experience curve, learning curve.


Slide 1 of 5
This is a stock trading graph with bull showing upward trend ppt powerpoint presentation pictures outfit. This is a four stage process. The stages in this process are stock market, financial market, bull market.


Slide 1 of 5
This is a stock market trend dollar sign on bar graph ppt powerpoint presentation show deck. This is a four stage process. The stages in this process are stock market, financial market, bull market.


Slide 1 of 5
This is a graph with growth arrow vector ppt powerpoint presentation gallery show. This is a three stage process. The stages in this process are accelerator, seed accelerators, startup accelerator.


Slide 1 of 5
This is a price quality relationship graph ppt powerpoint presentation show design templates. This is a two stage process. The stages in this process are cost benefit analysis, cost benefit investigation, cost benefit examination.


Slide 1 of 5
This is a bar graph ppt powerpoint presentation show slides. This is a two stage process. The stages in this process are finance, marketing, management, investment, analysis.


Slide 1 of 5
This is a bar graph shows financial values ppt powerpoint presentation infographic template gridlines. This is a two stage process. The stages in this process are bar, marketing, strategy, finance, planning.


Slide 1 of 5
This is a bar graph ppt powerpoint presentation styles show. This is a one stage process. The stages in this process are bar graph, finance, marketing, investment, business.


Slide 1 of 5
This is a bar graph ppt powerpoint presentation ideas show. This is a three stage process. The stages in this process are product, percentage, business, year, graph.


Slide 1 of 5
This is a bar graph ppt powerpoint presentation show guidelines. This is a four stage process. The stages in this process are product, growth, business, finance, bar graph.


Slide 1 of 5
This is a bar graph ppt powerpoint presentation show inspiration. This is a six stage process. The stages in this process are business, marketing, bar, graph, success.


Slide 1 of 5
This is a bar graph ppt powerpoint presentation professional show. This is a four stage process. The stages in this process are business, strategy, marketing, planning, finance.


Slide 1 of 5
This is a bar graph ppt powerpoint presentation file show. This is a four stage process. The stages in this process are business, marketing, graph, growth, finance.


Slide 1 of 5
This is a bar graph ppt powerpoint presentation show topics. This is a nine stage process. The stages in this process are business, finance, marketing, strategy, bar graph, growth.


Slide 1 of 5
This is a bar graph ppt powerpoint presentation show backgrounds. This is a four stage process. The stages in this process are graph, finance, marketing, management, business.


Slide 1 of 5
This is a financial projection graph template 2 ppt powerpoint presentation show picture. This is a three stage process. The stages in this process are annual sales, gross margin, net profit, years.


Slide 1 of 5
This is a bar graph ppt powerpoint presentation gallery show. This is a four stage process. The stages in this process are bar graph, business, marketing, management, planning.


Slide 1 of 5
This is a bar graph ppt powerpoint presentation show. This is a five stage process. The stages in this process are business, marketing, management, bar graph, growth.


Slide 1 of 5
This is a bar graph showing business success ppt powerpoint presentation inspiration. This is a five stage process. The stages in this process are business, success, marketing, management, strategy.


Slide 1 of 5
This is a bar graph to show company sales budget ppt powerpoint presentation sample. This is a four stage process. The stages in this process are business, finance, growth, success, marketing, arrow.


Slide 1 of 5
This is a bar graph chart for showing performance analysis ppt design. This is a six stage process. The stages in this process are business, marketing, process, success, presentation.


Slide 1 of 4
This is a net fixed asset turnover bar graph powerpoint show. This is a six stage process. The stages in this process are bar graph, presentation, strategy, business, management.


Slide 1 of 3
This slide has been designed with diagram of pencil graph. This diagram is suitable to present yearly profit growth. This professional slide helps in making an instant impact on viewers.


Slide 1 of 3
This business slide contains design of graph. This diagram is suitable to present downfall and economy crash. Visual effect of this diagram helps in maintaining the flow of the discussion and provides more clarity to the subject.


Slide 1 of 3
This bar graph can be very useful in presentations where you need to market trend. This can be used as a visualization tool because the audience can get a better view about what you want to show.


Slide 1 of 3
Acquire Forbearance From Our stock photo business process strategy arrow showing growth graph success images. Calmness Will Flow Through Your Being. Our Finance Will Conjure Up Ideas. They Will Come To You Before You Say Abracadabra.
SHOW
- 60
- 120
- 180
DISPLAYING: 60 of 233 Item(s)
Page
