AI PPT Maker
Templates
PPT Bundles
Design Services
Business PPTs
Business Plan
Management
Strategy
Introduction PPT
Roadmap
Self Introduction
Timelines
Process
Marketing
Agenda
Technology
Medical
Startup Business Plan
Cyber Security
Dashboards
SWOT
Proposals
Education
Pitch Deck
Digital Marketing
KPIs
Project Management
Product Management
Artificial Intelligence
Target Market
Communication
Supply Chain
Google Slides
Research Services
One Pagers
All Categories
Graph Analysis PowerPoint Presentation Templates and Google Slides
SHOW
- 60
- 120
- 180
DISPLAYING: 60 of 176 Item(s)
Page


Slide 1 of 12
Presenting this set of slides with name circular graph symbol business ideation employee analysis financial analysis ppt powerpoint presentation complete deck. The topics discussed in these slides are business ideation, employee analysis, financial analysis, data distribution, growth analysis. This is a completely editable PowerPoint presentation and is available for immediate download. Download now and impress your audience.


Slide 1 of 7
This is a money need assessment analysis graph ppt examples. This is a two stage process. The stages in this process are production, marketing, need, money, finance.


Slide 1 of 7
This is a financials forecasting analysis bar graph ppt example. This is a four stage process. The stages in this process are product version.


Slide 1 of 7
This is a bar graph with product development analysis powerpoint ideas. This is a five stage process. The stages in this process are graph, growth, business, marketing, arrows.


Slide 1 of 7
This is a product development analysis bar graph powerpoint themes. This is a five stage process. The stages in this process are business, growth, strategy, management, pretention.


Slide 1 of 7
This is a swot analysis graph powerpoint slide designs download. This is a four stage process. The stages in this process are threats, opportunity, weaknesses, strengths.


Slide 1 of 7
This is a graph of landing page conversion ratio analysis ppt powerpoint slides information. This is a four stage process. The stages in this process are attention, desire, respect privacy, action, build trust, balance your content and images, use emotional triggers, remove distractions, create a user friendly layout.


Slide 1 of 6
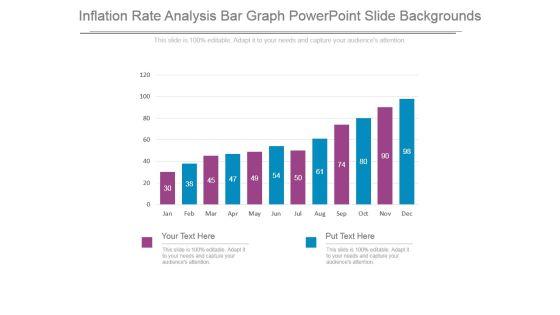
Presenting this set of slides with name bar graph chart analysis ppt powerpoint presentation gallery objects. The topics discussed in these slides are finance, marketing, management, investment, analysis. This is a completely editable PowerPoint presentation and is available for immediate download. Download now and impress your audience.


Slide 1 of 6
Presenting this set of slides with name bar graph chart analysis ppt powerpoint presentation outline good. The topics discussed in these slides are finance, marketing, management, investment, analysis. This is a completely editable PowerPoint presentation and is available for immediate download. Download now and impress your audience.


Slide 1 of 6
Presenting this set of slides with name bar graph for four years business result analysis ppt powerpoint presentation icon show. The topics discussed in these slides are financial targets, financial goals, growth profitability. This is a completely editable PowerPoint presentation and is available for immediate download. Download now and impress your audience.


Slide 1 of 6
Presenting this set of slides with name area graph analysis ppt powerpoint presentation summary graphics example. The topics discussed in these slides are finance, marketing, management, investment, analysis. This is a completely editable PowerPoint presentation and is available for immediate download. Download now and impress your audience.


Slide 1 of 6
Presenting this set of slides with name competition market share analysis line graph ppt powerpoint presentation portfolio layouts. The topics discussed in these slides are marketing, business, management, planning, strategy. This is a completely editable PowerPoint presentation and is available for immediate download. Download now and impress your audience.


Slide 1 of 6
Presenting this set of slides with name competition market share analysis graph ppt powerpoint presentation infographics inspiration. The topics discussed in these slides are marketing, business, management, planning, strategy. This is a completely editable PowerPoint presentation and is available for immediate download. Download now and impress your audience.


Slide 1 of 6
Presenting this set of slides with name competition market share analysis graph ppt powerpoint presentation ideas portfolio. The topics discussed in these slides are marketing, business, management, planning, strategy. This is a completely editable PowerPoint presentation and is available for immediate download. Download now and impress your audience.


Slide 1 of 6
Presenting this set of slides with name competition market share analysis graph ppt powerpoint presentation portfolio inspiration. The topics discussed in these slides are business, planning, strategy, marketing, management. This is a completely editable PowerPoint presentation and is available for immediate download. Download now and impress your audience.


Slide 1 of 6
This is a global growth data analysis bar graph ppt powerpoint presentation infographic template outfit. The topics discussed in this diagram are market growth, market opportunity, market profitability. This is a completely editable PowerPoint presentation, and is available for immediate download.


Slide 1 of 6
This is a competitors analysis charts graphs to display data company profiles ppt powerpoint presentation outline visual aids. This is a five stage process. The stages in this process are finance, analysis, business, investment, marketing.


Slide 1 of 6
This is a graph pattern for network analysis ppt powerpoint presentation infographics graphics template. This is a two stage process. The stages in this process are graph theory, chart theory, business.


Slide 1 of 6
This is a waterfall graph for budget variance and analysis ppt powerpoint presentation slides mockup. This is a three stage process. The stages in this process are profit and loss, balance sheet, income statement, benefit and loss.


Slide 1 of 6
This is a waterfall graph for income and expense analysis ppt powerpoint presentation file deck. This is a eight stage process. The stages in this process are sales waterfall, waterfall chart, business.


Slide 1 of 6
This is a financial charts and graphs for statistical analysis ppt powerpoint presentation show layout. This is a four stage process. The stages in this process are business metrics, business kpi, business dashboard.


Slide 1 of 5
Presenting this set of slides with name bar graph icon for research analysis ppt powerpoint presentation summary portfolio. This is a three stage process. The stages in this process are data visualization icon, research analysis, business focus. This is a completely editable PowerPoint presentation and is available for immediate download. Download now and impress your audience.


Slide 1 of 5
This is a project conclusion report performance analysis ppt powerpoint presentation diagram graph charts. The topics discussed in this diagram are marketing, business, management, planning, strategy This is a completely editable PowerPoint presentation, and is available for immediate download.


Slide 1 of 5
This is a digital marketing and digital analysis graphs with magnifying glass ppt powerpoint presentation portfolio show. This is a seven stage process. The stages in this process are digital analytics, digital dashboard, marketing.


Slide 1 of 5
This is a financial analysis vector bar graph with magnifying glass ppt powerpoint presentation gallery design ideas. This is a four stage process. The stages in this process are marketing analytics, marketing performance, marketing discovery.


Slide 1 of 5
This is a bar graph icon for data analysis ppt powerpoint presentation pictures ideas. This is a four stage process. The stages in this process are financial analysis, quantitative, statistical modelling.


Slide 1 of 5
This is a stock market analysis magnifying glass over bar graph and dollar sign ppt powerpoint presentation icon visual aids. This is a four stage process. The stages in this process are stock market, financial markets, bull market.


Slide 1 of 5
This is a cost volume profit analysis break even point graph ppt powerpoint presentation professional shapes. This is a four stage process. The stages in this process are break even point,break even analysis,break even level.


Slide 1 of 5
This is a mobile data analysis graph with upward arrow ppt powerpoint presentation summary styles. This is a four stage process. The stages in this process are mobile analytics, mobile tracking, mobile web analytics.


Slide 1 of 5
This is a competitor analysis graph ppt powerpoint presentation slides elements. This is a five stage process. The stages in this process are bar graph, finance, marketing, strategy, business.


Slide 1 of 5
This is a competitor analysis competitor revenue and profit graph ppt powerpoint presentation gallery vector. This is a five stage process. The stages in this process are bar graph, marketing, management, business, presentation.


Slide 1 of 5
This is a gap analysis graph ppt powerpoint presentation slides graphics pictures. This is a five stage process. The stages in this process are revenue, time, high, low, risk.


Slide 1 of 5
This is a gap analysis graph ppt powerpoint presentation gallery sample. This is a six stage process. The stages in this process are potential performance, diversification, market growth, market penetration.


Slide 1 of 5
This is a gap analysis graph ppt powerpoint presentation inspiration picture. This is a one stage process. The stages in this process are high, risk, low, time, gap analysis, revenue.


Slide 1 of 5
This is a gap analysis graph ppt powerpoint presentation portfolio topics. This is a four stage process. The stages in this process are potential performance, diversification, product development, market growth, market penetration, actual performance.


Slide 1 of 5
This is a competitor analysis graph ppt powerpoint presentation ideas format ideas. This is a two stage process. The stages in this process are business, marketing, strategy, competitor, analysis, graph.


Slide 1 of 5
This is a competitor analysis graph ppt powerpoint presentation outline. This is a five stage process. The stages in this process are bar graph, marketing, strategy, analysis, business.


Slide 1 of 5
This is a competitor analysis graph ppt powerpoint presentation design ideas. This is a five stage process. The stages in this process are competitor, graph, management, business.


Slide 1 of 5
This is a competitor analysis graph ppt powerpoint presentation graphics. This is a five stage process. The stages in this process are competitor, business, marketing.


Slide 1 of 5
This is a competitor analysis competitor revenue and profit graph ppt powerpoint presentation inspiration. This is a five stage process. The stages in this process are business, marketing, management, profit, revenue.


Slide 1 of 5
This is a competitor analysis graph ppt powerpoint presentation styles. This is a five stage process. The stages in this process are graph, business, marketing, competitor.


Slide 1 of 5
This is a gap analysis graph ppt powerpoint presentation example 2015. This is a four stage process. The stages in this process are potential performance, diversification, product development, market growth, market penetration, actual performance.


Slide 1 of 5
This is a bar graph to showcase financial analysis ppt powerpoint presentation professional. This is a four stage process. The stages in this process are business, marketing, growth, success, arrows.


Slide 1 of 5
This is a bar graph for descriptive analysis ppt powerpoint presentation shapes. This is a five stage process. The stages in this process are icons, business, marketing, management, process.


Slide 1 of 5
This is a 5 level bar graph for analysis with icons ppt powerpoint presentation shapes. This is a five stage process. The stages in this process are business, strategy, marketing, icons, growth, management.


Slide 1 of 5
This is a performance analysis bar graph powerpoint shapes. This is a four stage process. The stages in this process are growth, finance, strategy, management, marketing.


Slide 1 of 5
This is a bar graph for market analysis ppt samples download. This is a four stage process. The stages in this process are category.


Slide 1 of 5
This is a bar graph chart for showing performance analysis ppt design. This is a six stage process. The stages in this process are business, marketing, process, success, presentation.


Slide 1 of 5
This PowerPoint template has been designed with bar graph. This PowerPoint diagram is useful for data distribution and analysis This diagram slide can be used to make impressive presentations.


Slide 1 of 4
This is a market cap analysis graph powerpoint slide deck. This is a three stage process. The stages in this process are business, finance, marketing, graph, management.


Slide 1 of 4
This is a inflation rate analysis bar graph powerpoint slide backgrounds. This is a twelve stage process. The stages in this process are jan, feb, mar, apr, may, jun, jul, aug, sep, oct, nov, dec.


Slide 1 of 4
This is a financials bar graph for expectation analysis powerpoint slide deck samples. This is a four stage process. The stages in this process are product version.


Slide 1 of 4
This is a xyz security analysis graph powerpoint slide download. This is a two stage process. The stages in this process are business, marketing, growth, graph.


Slide 1 of 4
This is a stakeholders fund and market analysis bar graph powerpoint slide information. This is a five stage process. The stages in this process are shareholders funds, market capitalization, market capitalization as a percentage of cse market capitalization.


Slide 1 of 4
This is a team target and procurement analysis graph powerpoint slide deck samples. This is a six stage process. The stages in this process are graph chart, business, success, strategy, management.


Slide 1 of 4
This is a financial revenue analysis growth bar graph powerpoint slide download. This is a twelve stage process. The stages in this process are bar graph, business, marketing, growth, success.


Slide 1 of 4
This is a competitive environment analysis bar graph ppt slide templates. This is a one stage process. The stages in this process are engagement, brand, monthly, weekly.


Slide 1 of 4
This is a bar graph with total profit analysis ppt images. This is a nine stage process. The stages in this process are bar graph, business, marketing, growth, success.


Slide 1 of 4
This is a band engagement analysis bar graph powerpoint ideas. This is a four stage process. The stages in this process are engagement, brand, monthly, weekly.


Slide 1 of 4
This is a pareto analysis bar graph powerpoint slide deck. This is a ten stage process. The stages in this process are restaurant complaints, total complaints, complaints pricing and service, pricing and service, analysis bring down complaints, category.
SHOW
- 60
- 120
- 180
DISPLAYING: 60 of 176 Item(s)
Page