 AI PPT Maker
 Templates
 PPT Bundles
 Design Services
 Business PPTs
 Business Plan
 Management
 Strategy
 Introduction PPT
 Roadmap
 Self Introduction
 Timelines
 Process
 Marketing
 Agenda
 Technology
 Medical
 Startup Business Plan
 Cyber Security
 Dashboards
 SWOT
SWOT Proposals
 Education
 Pitch Deck
 Digital Marketing
 KPIs
KPIs Project Management
 Product Management
 Artificial Intelligence
 Target Market
 Communication
 Supply Chain
 Google Slides
 Research Services
 One Pagers
 All Categories
Financials Revenue PowerPoint Presentation Templates and Google Slides
SHOW
- 60
- 120
- 180
DISPLAYING: 60 of 252 Item(s)
Page
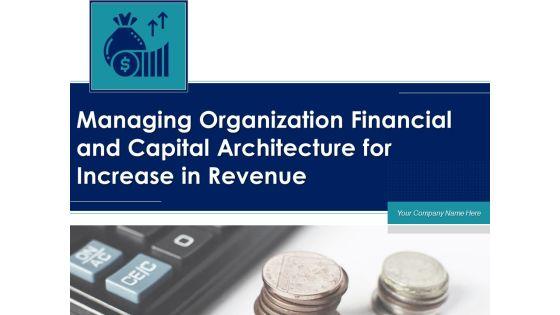


Presenting this set of slides with name managing organization financial and capital architecture for increase in revenue ppt powerpoint presentation complete deck with slides. The topics discussed in these slides are optimization, capital structure, analysis, financial, equity. This is a completely editable PowerPoint presentation and is available for immediate download. Download now and impress your audience.


This is a financials base plan for revenue analysis powerpoint slide graphics. This is a three stage process. The stages in this process are kp, revenue, cost of sales, gross profit, customer acquisition cost, other operating cost expense, operating profit, change in cash, ending cash, employees ftes.


Presenting this set of slides with name financial deposits revenue ppt powerpoint presentation model layout. This is a three stage process. The stages in this process are finance, marketing, management, investment, analysis. This is a completely editable PowerPoint presentation and is available for immediate download. Download now and impress your audience.


Presenting this set of slides with name financial revenue deposits ppt powerpoint presentation infographics clipart. This is a three stage process. The stages in this process are financial, revenue, deposits, net income, marketing. This is a completely editable PowerPoint presentation and is available for immediate download. Download now and impress your audience.


This slide outlines existing scenario of spa and wellness business yearly financial performance to assess profit or loss in company. It assess performance based on elements such as revenue, net income and gross profit. Do you have to make sure that everyone on your team knows about any specific topic I yes, then you should give Spa Marketing Strategy Boost Reservations Enhance Revenue Current Financial Performance Analysis Mockup PDF a try. Our experts have put a lot of knowledge and effort into creating this impeccable Spa Marketing Strategy Boost Reservations Enhance Revenue Current Financial Performance Analysis Mockup PDF. You can use this template for your upcoming presentations, as the slides are perfect to represent even the tiniest detail. You can download these templates from the Slidegeeks website and these are easy to edit. So grab these today.


Financial Revenue Growth PowerPoint Templates-These high quality powerpoint pre-designed slides and powerpoint templates have been carefully created by our professional team to help you impress your audience. All slides have been created and are 100% editable in powerpoint. Each and every property of any graphic - color, size, orientation, shading, outline etc. can be modified to help you build an effective powerpoint presentation. Any text can be entered at any point in the powerpoint template or slide. Simply DOWNLOAD, TYPE and PRESENT! Your audience will feast upon our Financial Revenue Growth PowerPoint Templates. They provide ample eye candy.


This slide represents financial challenges faced by investors during property flipping. It includes loss of profit on investment and increase in holding cost. Formulating a presentation can take up a lot of effort and time, so the content and message should always be the primary focus. The visuals of the PowerPoint can enhance the presenters message, so our Strategies For Flipping Houses For Maximum Revenue Financial Challenges Faced During Real Estate Flipping Designs PDF was created to help save time. Instead of worrying about the design, the presenter can concentrate on the message while our designers work on creating the ideal templates for whatever situation is needed. Slidegeeks has experts for everything from amazing designs to valuable content, we have put everything into Strategies For Flipping Houses For Maximum Revenue Financial Challenges Faced During Real Estate Flipping Designs PDF


This slide showcase donut chart of revenue an expenses occurred towards running an organization. It includes elements such as foundations, contracts payroll, benefits, fundraising, worker wages etc. Showcasing this set of slides titled Organization Revenue And Expenditure Financial Performance Report Inspiration PDF. The topics addressed in these templates are Expenses, Revenue Worker Wages. All the content presented in this PPT design is completely editable. Download it and make adjustments in color, background, font etc. as per your unique business setting.


This slide showcase revenue trends of four different product and suggestions to boost revenue. It includes elements such as product A, product B , product C, product D along with key highlights and revenue projection. Showcasing this set of slides titled Financial Revenue Trends Analysis Performance Report Designs PDF. The topics addressed in these templates are Revenue, Innovative Design, Latest Trend. All the content presented in this PPT design is completely editable. Download it and make adjustments in color, background, font etc. as per your unique business setting.


This slide provides information regarding the financial analysis of Amazon in terms of growth in revenues. The firm focused on launching offerings across various markets in order to increase sales and better conversions. Do you have to make sure that everyone on your team knows about any specific topic I yes, then you should give Financial Assessment Growth In Revenues Across Amazon Demonstration PDF a try. Our experts have put a lot of knowledge and effort into creating this impeccable Financial Assessment Growth In Revenues Across Amazon Demonstration PDF. You can use this template for your upcoming presentations, as the slides are perfect to represent even the tiniest detail. You can download these templates from the Slidegeeks website and these are easy to edit. So grab these today


This slide displays P and L variance analysis to closely monitor key financial parameters of the company. It includes details about sales, discounts allowed, freight income, customer finance charges, etc. Showcasing this set of slides titled Monthly Financials Metrics With Revenue And Gross Profit Professional PDF. The topics addressed in these templates are Amount, Current Month, Profit. All the content presented in this PPT design is completely editable. Download it and make adjustments in color, background, font etc. as per your unique business setting.


This slide showcases KPI dashboard for monitoring financial health of business to ensure smooth flow of business operations. It includes details such as COGS, net profit, cost breakdown, etc. Showcasing this set of slides titled Monthly Financial Metrics Dashboard With Revenue And Expenditure Rules PDF. The topics addressed in these templates are Net Profit, Costs, Expenditure. All the content presented in this PPT design is completely editable. Download it and make adjustments in color, background, font etc. as per your unique business setting.


This slide showcases a KPI dashboard to review current financial performance of the company. It includes information such as revenue breakdown, expenses and costs, operating income, net profit, etc. Pitch your topic with ease and precision using this Monthly Financial Metrics Dashboard With Revenue And Cost Breakdown Information PDF. This layout presents information on Operating Income, Operating Margin, Net Profit. It is also available for immediate download and adjustment. So, changes can be made in the color, design, graphics or any other component to create a unique layout.


The purpose of the following slide is to analyze the financial performance of the organization. The provided graph highlight the revenues, Gross profit and net profit margin of the organization for the year 2016,17,18 and 19. Create an editable Periodic Revenue Model Our Financial Performance Over The Year Themes PDF that communicates your idea and engages your audience. Whether youre presenting a business or an educational presentation, pre designed presentation templates help save time. Periodic Revenue Model Our Financial Performance Over The Year Themes PDF is highly customizable and very easy to edit, covering many different styles from creative to business presentations. Slidegeeks has creative team members who have crafted amazing templates. So, go and get them without any delay.


This slide provides information regarding the financial analysis of amazon in terms of growth in revenues. The firm focused on launching offerings across various markets in order to increase sales and better conversions. Slidegeeks is one of the best resources for PowerPoint templates. You can download easily and regulate Financial Assessment Growth In Revenues Across Amazon Ppt PowerPoint Presentation File Layouts PDF for your personal presentations from our wonderful collection. A few clicks is all it takes to discover and get the most relevant and appropriate templates. Use our Templates to add a unique zing and appeal to your presentation and meetings. All the slides are easy to edit and you can use them even for advertisement purposes.


The slide highlights the historical financial revenue illustrating revenue, year on year growth and CAGR. It also depicts the reasons for the growth decline in last three years. Present like a pro with Logistics Transport Company Financial Report Historical Financial Revenue Ppt Outline Slides PDF Create beautiful presentations together with your team, using our easy-to-use presentation slides. Share your ideas in real-time and make changes on the fly by downloading our templates. So whether you are in the office, on the go, or in a remote location, you can stay in sync with your team and present your ideas with confidence. With Slidegeeks presentation got a whole lot easier. Grab these presentations today.


The slide highlights the historical revenue for food products, beverage and dairy products revenue with CAGR. It showcases key insights for revenue describing growth trend for each category. Boost your pitch with our creative Food Company Financial Performance Summary Revenue By Category Introduction PDF. Deliver an awe-inspiring pitch that will mesmerize everyone. Using these presentation templates you will surely catch everyones attention. You can browse the ppts collection on our website. We have researchers who are experts at creating the right content for the templates. So you do not have to invest time in any additional work. Just grab the template now and use them.


The slide shows annual revenue growth of the company with the CAGR for last five financial years from 2019 to 2023 along with key insights. Take your projects to the next level with our ultimate collection of Food Company Financial Performance Summary Historical Revenue 2019 2023 Background PDF. Slidegeeks has designed a range of layouts that are perfect for representing task or activity duration, keeping track of all your deadlines at a glance. Tailor these designs to your exact needs and give them a truly corporate look with your own brand colors they will make your projects stand out from the rest


The slide highlights the revenue generated from the USA and rest of the world in US dollar from 2019 to 2023. It showcases key insights describing revenue trend. Retrieve professionally designed Food Company Financial Performance Summary Business Revenue Generation By Geographical Area Elements PDF to effectively convey your message and captivate your listeners. Save time by selecting pre-made slideshows that are appropriate for various topics, from business to educational purposes. These themes come in many different styles, from creative to corporate, and all of them are easily adjustable and can be edited quickly. Access them as PowerPoint templates or as Google Slides themes. You do not have to go on a hunt for the perfect presentation because Slidegeeks got you covered from everywhere.


This slide provides information regarding the financial analysis of Amazon in terms of growth in revenues. The firm focused on launching offerings across various markets in order to increase sales and better conversions. Slidegeeks is here to make your presentations a breeze with Amazon Tactical Plan Financial Assessment Growth In Revenues Across Amazon Information PDF With our easy-to-use and customizable templates, you can focus on delivering your ideas rather than worrying about formatting. With a variety of designs to choose from, you are sure to find one that suits your needs. And with animations and unique photos, illustrations, and fonts, you can make your presentation pop. So whether you are giving a sales pitch or presenting to the board, make sure to check out Slidegeeks first.


Following slide illustrates statistics of revenue generation. It depicts that company achieved its highest revenue generation mark in H2 2020. Are you searching for a Financial Evaluation Report Year Over Year Revenue Generation Highlights Designs PDF that is uncluttered, straightforward, and original Its easy to edit, and you can change the colors to suit your personal or business branding. For a presentation that expresses how much effort youve put in, this template is ideal With all of its features, including tables, diagrams, statistics, and lists, its perfect for a business plan presentation. Make your ideas more appealing with these professional slides. Download Financial Evaluation Report Year Over Year Revenue Generation Highlights Designs PDF from Slidegeeks today.


This slide shows the consolidated statement covering the operating revenue and expenses in a fiscal year. Presenting you an exemplary Consolidated Financial Revenue And Expenses One Pager Documents. Our one-pager comprises all the must-have essentials of an inclusive document. You can edit it with ease, as its layout is completely editable. With such freedom, you can tweak its design and other elements to your requirements. Download this Consolidated Financial Revenue And Expenses One Pager Documents brilliant piece now.


This one page covers about region wise product sales from various franchise and direct stores. Presenting you a fantastic Region Wise Revenue Generation In Financial Year One Pager Documents. This piece is crafted on hours of research and professional design efforts to ensure you have the best resource. It is completely editable and its design allow you to rehash its elements to suit your needs. Get this Region Wise Revenue Generation In Financial Year One Pager Documents A4 One-pager now.


This slide shows pie chart of organizational revenue and expenses. It can be used by a firm to categorize revenue and expenses sources. Showcasing this set of slides titled Financial Position Evaluation Of Organization Revenue And Expenses Slides PDF. The topics addressed in these templates are Expenses, Revenue, Commissions, Services, Products. All the content presented in this PPT design is completely editable. Download it and make adjustments in color, background, font etc. as per your unique business setting.


This one pager covers the major sources of Revenue and Financial focus of the company in the fiscal year 2022. Presenting you an exemplary Company Revenue Sources And Financial Focus In 2022 Template 187 One Pager Documents. Our one-pager comprises all the must-have essentials of an inclusive document. You can edit it with ease, as its layout is completely editable. With such freedom, you can tweak its design and other elements to your requirements. Download this Company Revenue Sources And Financial Focus In 2022 Template 187 One Pager Documents brilliant piece now.


This one pager covers the major sources of Revenue and Financial focus of the company in the fiscal year 2022. Presenting you a fantastic Company Revenue Sources And Financial Focus In 2022 One Pager Documents. This piece is crafted on hours of research and professional design efforts to ensure you have the best resource. It is completely editable and its design allow you to rehash its elements to suit your needs. Get this Company Revenue Sources And Financial Focus In 2022 One Pager Documents A4 One-pager now.


Amazon Strategic Growth Initiative On Global Scale Financial Assessment Growth In Revenues Rules PDF
This slide provides information regarding the financial analysis of Amazon in terms of growth in revenues. The firm focused on launching offerings across various markets in order to increase sales and better conversions. Slidegeeks is one of the best resources for PowerPoint templates. You can download easily and regulate Amazon Strategic Growth Initiative On Global Scale Financial Assessment Growth In Revenues Rules PDF for your personal presentations from our wonderful collection. A few clicks is all it takes to discover and get the most relevant and appropriate templates. Use our Templates to add a unique zing and appeal to your presentation and meetings. All the slides are easy to edit and you can use them even for advertisement purposes.


The following slide showcases financial waterfall for revenue growth in electronics industry. It presents information related to percentage increase in sales, net sales, etc. Showcasing this set of slides titled Financial Waterfall Model Revenue Growth Analysis Professional PDF. The topics addressed in these templates are Financial, Revenue Growth, Analysis. All the content presented in this PPT design is completely editable. Download it and make adjustments in color, background, font etc. as per your unique business setting.


The purpose of the following slide is to analyze the financial performance of the organization. The provided graph highlight the revenues, Gross profit and net profit margin of the organization for the year 2020,21,22 and 23. Are you in need of a template that can accommodate all of your creative concepts This one is crafted professionally and can be altered to fit any style. Use it with Google Slides or PowerPoint. Include striking photographs, symbols, depictions, and other visuals. Fill, move around, or remove text boxes as desired. Test out color palettes and font mixtures. Edit and save your work, or work with colleagues. Download Membership Based Revenue Plan Our Financial Performance Over The Year Mockup PDF and observe how to make your presentation outstanding. Give an impeccable presentation to your group and make your presentation unforgettable.


Pitch your topic with ease and precision using this KPI Dashboard To Measure Financial Institution Industry Revenue Summary PDF. This layout presents information on Measure Financial, Institution Industry . It is also available for immediate download and adjustment. So, changes can be made in the color, design, graphics or any other component to create a unique layout.


The slide showcases the revenue earned by healthcare companies from different geographical regions. It shows south America, north America, Asia, Africa, Oceania, and Europe. Get a simple yet stunning designed Pharmaceutical Company Financial Summary Hospital Business Revenue Generation Download PDF. It is the best one to establish the tone in your meetings. It is an excellent way to make your presentations highly effective. So, download this PPT today from Slidegeeks and see the positive impacts. Our easy-to-edit Pharmaceutical Company Financial Summary Hospital Business Revenue Generation Download PDF can be your go-to option for all upcoming conferences and meetings. So, what are you waiting for Grab this template today.


The slide showcases company revenue for last five years, along with the revenue split by pharmacy, hospital and research business verticals for current year. It also depicts CAGR and key insights for revenue analysis. Take your projects to the next level with our ultimate collection of Pharmaceutical Company Financial Summary Historical Revenue Guidelines PDF. Slidegeeks has designed a range of layouts that are perfect for representing task or activity duration, keeping track of all your deadlines at a glance. Tailor these designs to your exact needs and give them a truly corporate look with your own brand colors theyll make your projects stand out from the rest.


The slide showcases the comparative analysis of revenue and profit distribution from six global regions. The regions included are south America, north America, Asia, Africa, Oceania, and Europe. The Pharmaceutical Company Financial Summary Comparative Analysis Of Revenue Elements PDF is a compilation of the most recent design trends as a series of slides. It is suitable for any subject or industry presentation, containing attractive visuals and photo spots for businesses to clearly express their messages. This template contains a variety of slides for the user to input data, such as structures to contrast two elements, bullet points, and slides for written information. Slidegeeks is prepared to create an impression.


The slide showcases the quarterly revenue highlights for the insurance company to illustrate the quarterly performance of the firm along with the key highlights. Want to ace your presentation in front of a live audience Our Insurance Business Financial Analysis Insurance Company Quarterly Revenue Highlights Designs PDF can help you do that by engaging all the users towards you.. Slidegeeks experts have put their efforts and expertise into creating these impeccable powerpoint presentations so that you can communicate your ideas clearly. Moreover, all the templates are customizable, and easy-to-edit and downloadable. Use these for both personal and commercial use.


The slide showcases the revenue earned by the insurance company from different income sources. It depicts revenue earned from net earned premium, investment, commission and other income sources for last five financial years. This modern and well-arranged Insurance Business Financial Analysis Sources Of Revenue Ppt Model Ideas PDF provides lots of creative possibilities. It is very simple to customize and edit with the Powerpoint Software. Just drag and drop your pictures into the shapes. All facets of this template can be edited with Powerpoint, no extra software is necessary. Add your own material, put your images in the places assigned for them, adjust the colors, and then you can show your slides to the world, with an animated slide included.


The slide showcases the revenue share from different income sources for insurance company in last five financial years. It depicts revenue share from net earned premium, investment, commission and other income sources. Coming up with a presentation necessitates that the majority of the effort goes into the content and the message you intend to convey. The visuals of a PowerPoint presentation can only be effective if it supplements and supports the story that is being told. Keeping this in mind our experts created Insurance Business Financial Analysis Revenue Split By Activities Ppt Infographic Template Design Inspiration PDF to reduce the time that goes into designing the presentation. This way, you can concentrate on the message while our designers take care of providing you with the right template for the situation.


The slide showcases company revenue for last five years along with yearly on year growth. It also depicts CAGR and key insights for revenue analysis. Crafting an eye-catching presentation has never been more straightforward. Let your presentation shine with this tasteful yet straightforward Insurance Business Financial Analysis Historical Revenue Ppt Styles Graphics PDF template. It offers a minimalistic and classy look that is great for making a statement. The colors have been employed intelligently to add a bit of playfulness while still remaining professional. Construct the ideal Insurance Business Financial Analysis Historical Revenue Ppt Styles Graphics PDF that effortlessly grabs the attention of your audience Begin now and be certain to wow your customers.


This slide shows the Total Revenues and Net Income of ABC Corporation for five years in Million dollar Coming up with a presentation necessitates that the majority of the effort goes into the content and the message you intend to convey. The visuals of a PowerPoint presentation can only be effective if it supplements and supports the story that is being told. Keeping this in mind our experts created Financial Reporting To Analyze Total Revenues And Net Income For Five Years Guidelines PDF to reduce the time that goes into designing the presentation. This way, you can concentrate on the message while our designers take care of providing you with the right template for the situation.
SHOW
- 60
- 120
- 180
DISPLAYING: 60 of 252 Item(s)
Page