 AI PPT Maker
 Templates
 PPT Bundles
 Design Services
 Business PPTs
 Business Plan
 Management
 Strategy
 Introduction PPT
 Roadmap
 Self Introduction
 Timelines
 Process
 Marketing
 Agenda
 Technology
 Medical
 Startup Business Plan
 Cyber Security
 Dashboards
 SWOT
SWOT Proposals
 Education
 Pitch Deck
 Digital Marketing
 KPIs
KPIs Project Management
 Product Management
 Artificial Intelligence
 Target Market
 Communication
 Supply Chain
 Google Slides
 Research Services
 One Pagers
 All Categories
Financial metrics PowerPoint Presentation Templates and Google Slides
SHOW
- 60
- 120
- 180
DISPLAYING: 60 of 114 Item(s)
Page


Improve your presentation delivery using this business financial metrics data analysis ppt powerpoint presentation complete deck with slides. Support your business vision and objectives using this well-structured PPT deck. This template offers a great starting point for delivering beautifully designed presentations on the topic of your choice. Comprising twenty nine this professionally designed template is all you need to host discussion and meetings with collaborators. Each slide is self-explanatory and equipped with high-quality graphics that can be adjusted to your needs. Therefore, you will face no difficulty in portraying your desired content using this PPT slideshow. This PowerPoint slideshow contains every important element that you need for a great pitch. It is not only editable but also available for immediate download and utilization. The color, font size, background, shapes everything can be modified to create your unique presentation layout. Therefore, download it now.


Share a great deal of information on the topic by deploying this Monthly Financials Metrics Ppt PowerPoint Presentation Complete Deck With Slides. Support your ideas and thought process with this prefabricated set. It includes a set of twelve slides, all fully modifiable and editable. Each slide can be restructured and induced with the information and content of your choice. You can add or remove large content boxes as well, to make this PPT slideshow more personalized. Its high-quality graphics and visuals help in presenting a well-coordinated pitch. This PPT template is also a resourceful tool to take visual cues from and implement the best ideas to help your business grow and expand. The main attraction of this well-formulated deck is that everything is editable, giving you the freedom to adjust it to your liking and choice. Changes can be made in the background and theme as well to deliver an outstanding pitch. Therefore, click on the download button now to gain full access to this multifunctional set.


Boost your confidence and team morale with this well-structured Financial Forecast And Essential Metrics Ppt PowerPoint Presentation Complete Deck With Slides. This prefabricated set gives a voice to your presentation because of its well-researched content and graphics. Our experts have added all the components very carefully, thus helping you deliver great presentations with a single click. Not only that, it contains a set of twelve slides that are designed using the right visuals, graphics, etc. Various topics can be discussed, and effective brainstorming sessions can be conducted using the wide variety of slides added in this complete deck. Apart from this, our PPT design contains clear instructions to help you restructure your presentations and create multiple variations. The color, format, design anything can be modified as deemed fit by the user. Not only this, it is available for immediate download. So, grab it now.


Boost your confidence and team morale with this well-structured financial deprivation decline metrics ppt powerpoint presentation complete deck with slides. This prefabricated set gives a voice to your presentation because of its well-researched content and graphics. Our experts have added all the components very carefully, thus helping you deliver great presentations with a single click. Not only that, it contains a set of twelve slides that are designed using the right visuals, graphics, etc. Various topics can be discussed, and effective brainstorming sessions can be conducted using the wide variety of slides added in this complete deck. Apart from this, our PPT design contains clear instructions to help you restructure your presentations and create multiple variations. The color, format, design anything can be modified as deemed fit by the user. Not only this, it is available for immediate download. So, grab it now.


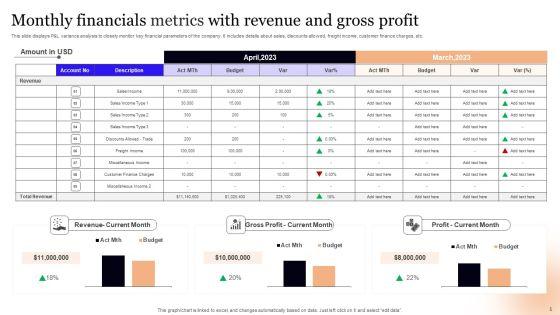
This slide displays P and L variance analysis to closely monitor key financial parameters of the company. It includes details about sales, discounts allowed, freight income, customer finance charges, etc. Showcasing this set of slides titled Monthly Financials Metrics With Revenue And Gross Profit Professional PDF. The topics addressed in these templates are Amount, Current Month, Profit. All the content presented in this PPT design is completely editable. Download it and make adjustments in color, background, font etc. as per your unique business setting.


This slide showcases monthly analytics for to keep company finances organized and identify problem areas. It further includes details about marketing, professional fees, COGS and other operations. Pitch your topic with ease and precision using this Monthly Financial Metrics Graph With Operating Profit And Cost Of Goods Sold Pictures PDF. This layout presents information on Key Insights, Operating Profit, Total Revenue. It is also available for immediate download and adjustment. So, changes can be made in the color, design, graphics or any other component to create a unique layout.


This slide showcases KPI dashboard for monitoring financial health of business to ensure smooth flow of business operations. It includes details such as COGS, net profit, cost breakdown, etc. Showcasing this set of slides titled Monthly Financial Metrics Dashboard With Revenue And Expenditure Rules PDF. The topics addressed in these templates are Net Profit, Costs, Expenditure. All the content presented in this PPT design is completely editable. Download it and make adjustments in color, background, font etc. as per your unique business setting.


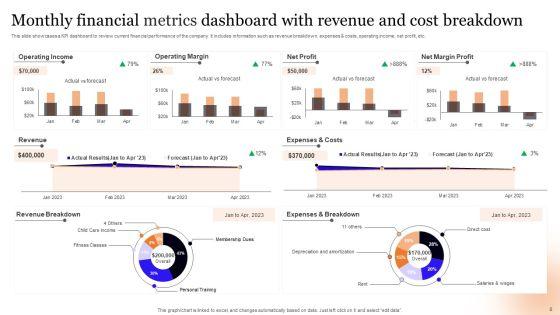
This slide showcases a KPI dashboard to review current financial performance of the company. It includes information such as revenue breakdown, expenses and costs, operating income, net profit, etc. Pitch your topic with ease and precision using this Monthly Financial Metrics Dashboard With Revenue And Cost Breakdown Information PDF. This layout presents information on Operating Income, Operating Margin, Net Profit. It is also available for immediate download and adjustment. So, changes can be made in the color, design, graphics or any other component to create a unique layout.


This following slide displays kpis to communicate key financial information to both internal and external stakeholders. It further includes details such as OPEX ratio, revenue and COGS, income, expenses, etc. Showcasing this set of slides titled Monthly Financial Metrics Dashboard With Income Statement Infographics PDF. The topics addressed in these templates are Gross Profit Margin, Taxes, Revenue. All the content presented in this PPT design is completely editable. Download it and make adjustments in color, background, font etc. as per your unique business setting.


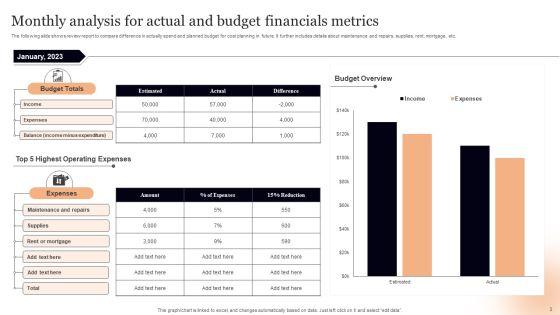
The following slide shows review report to compare difference in actually spend and planned budget for cost planning in future. It further includes details about maintenance and repairs, supplies, rent, mortgage, etc. Pitch your topic with ease and precision using this Monthly Analysis For Actual And Budget Financials Metrics Professional PDF. This layout presents information on Budget Totals, Expenses, Budget Overview. It is also available for immediate download and adjustment. So, changes can be made in the color, design, graphics or any other component to create a unique layout.


This slide showcases income statement of company to analyze overall growth of business to plan expenses for upcoming years. It further includes details such as COGS, labor, marketing, hardware and IT cost, earning before taxes, etc. Showcasing this set of slides titled Key Monthly Financials Metrics With Gross And Net Profit Guidelines PDF. The topics addressed in these templates are Key Takeaways, Total Revenue, Profit. All the content presented in this PPT design is completely editable. Download it and make adjustments in color, background, font etc. as per your unique business setting.


This slide covers dashboard to manage and monitor financial risks faced by the enterprise. It includes details related to kpis such as risk heat map, risk rating breakdown, top 5 vulnerabilities etc. Crafting an eye catching presentation has never been more straightforward. Let your presentation shine with this tasteful yet straight forward Company Risk Assessment Plan Financial Risk Management Key Metrics Dashboard Brochure PDF template. It offers a minimalistic and classy look that is great for making a statement. The colors have been employed intelligently to add a bit of playfulness while still remaining professional. Construct the ideal Company Risk Assessment Plan Financial Risk Management Key Metrics Dashboard Brochure PDF that effortlessly grabs the attention of your audience. Begin now and be certain to wow your customers.
Showcasing this set of slides titled Annual Financial Performance Administration Dashboard With Key Metrics Ppt PowerPoint Presentation Icon Visual Aids PDF. The topics addressed in these templates are Accounts Receivable, Accounts Payable, Planned Profit Margin. All the content presented in this PPT design is completely editable. Download it and make adjustments in color, background, font etc. as per your unique business setting.


This slide showcases key performance indicators for every business. Key metrics covered are return on assets and equity, working capital ratio, debt and equity ratio. Showcasing this set of slides titled Key Company Financial Operation Performance Metrics Ppt Infographic Template Example Introduction PDF. The topics addressed in these templates are Return on Assets, Working Capital Ratio, Return on Equity. All the content presented in this PPT design is completely editable. Download it and make adjustments in color, background, font etc. as per your unique business setting.


This slide shows finance process dashboard depicting cash flow metrics which can be referred by managers to overlook current performance and make necessary decisions. It includes information about quick ratio, current ratio, cash balance, month end cash, unresolved sales, pending payables, etc. Pitch your topic with ease and precision using this Financial Procedure Dashboard Depicting Cash Flow Metrics Structure PDF. This layout presents information on Quick Ratio, Unresolved Sales, Pending Payables. It is also available for immediate download and adjustment. So, changes can be made in the color, design, graphics or any other component to create a unique layout.


This slide illustrates facts and figures related to important financial metrics It includes cash flow, DSO, ROCE, EPS diluted for Q4 FY21, Q3 FY22 and Q4 FY22 etc. Showcasing this set of slides titled Funding Pitch On Key Financial Metrics Dashboard Ppt Ideas Deck PDF. The topics addressed in these templates are Cash Flow, EPS Diluted, ROCE. All the content presented in this PPT design is completely editable. Download it and make adjustments in color, background, font etc. as per your unique business setting.


This slide focuses on project management dashboard which includes planned, remaining and actual cost, financial summary of portfolio, project workflows, statistics, portfolio variance summary with department, finish date, schedule, cost and work variance, etc. Showcasing this set of slides titled Project Portfolio Metrics Dashboard With Financial Summary Demonstration PDF. The topics addressed in these templates are Planned Cost, Portfolio Statistics, Portfolio Variances Summary. All the content presented in this PPT design is completely editable. Download it and make adjustments in color, background, font etc. as per your unique business setting.


This slide shows the project management dashboard which includes the types of expenditure, follow up items, summary overview, with status updated, issues, risks, contingencies, financials, schedule and scope with starting and ending date, actual budget, etc. Showcasing this set of slides titled Project Metrics Dashboard With Financial Forecast Professional PDF. The topics addressed in these templates are Expenditure, Financial Forecast, Risks. All the content presented in this PPT design is completely editable. Download it and make adjustments in color, background, font etc. as per your unique business setting.


This slide shows the project management dashboard which covers the monthly sales graph and project financials such as reviewing, setup, coding, testing, getting feedback from users, training, implementation and launching. Pitch your topic with ease and precision using this Project Metrics Dashboard Depicting Financials Pictures PDF. This layout presents information on Execution, Project Financial. It is also available for immediate download and adjustment. So, changes can be made in the color, design, graphics or any other component to create a unique layout.


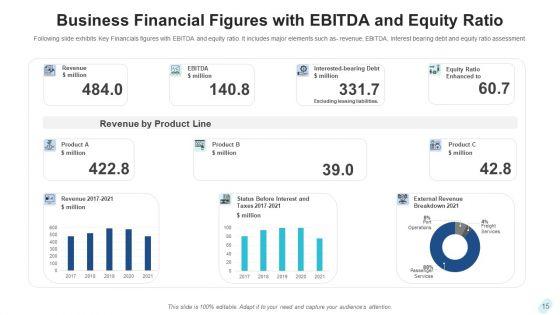
Following slide provides financial details of company including revenue and operating profit. Revenue recorded in FY22 was dollar518,932 while operating profit recorded was dollar481,932.Deliver an awe inspiring pitch with this creative Enterprise Sustainability Performance Metrics Key Financials Of The Company Rules PDF bundle. Topics like Operating, Profit, Revenue can be discussed with this completely editable template. It is available for immediate download depending on the needs and requirements of the user.


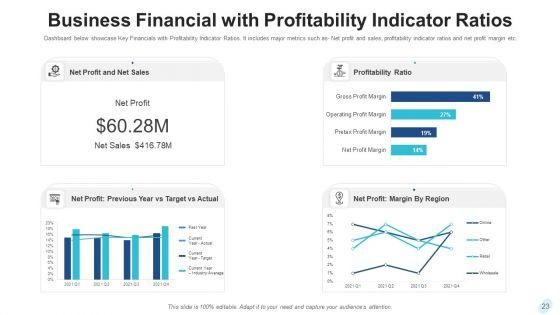
This slide shows financial performance indicator dashboard covering net profit and net sales, profitability indicator ratios, cogs and net profit by region or channel.Deliver an awe inspiring pitch with this creative Enterprise Sustainability Performance Metrics Financial Performance Indicator Dashboard Themes PDF bundle. Topics like Profitability Indicator, Sold Breakdown, Target Actual can be discussed with this completely editable template. It is available for immediate download depending on the needs and requirements of the user.


Following slide provides financial details of company including revenue and operating profit. Revenue recorded in FY22 was dollar 518,932 while operating profit recorded was dollar 481,932. Deliver an awe inspiring pitch with this creative Metrics To Measure Business Performance Key Financials Of The Company Elements PDF bundle. Topics like Revenue, Operating Profit can be discussed with this completely editable template. It is available for immediate download depending on the needs and requirements of the user.


This slide shows financial performance indicator dashboard covering net profit and net sales, profitability indicator ratios, cogs and net profit by region or channel. Deliver an awe inspiring pitch with this creative Metrics To Measure Business Performance Financial Performance Indicator Dashboard Pictures PDF bundle. Topics like Net Profit, Net Sales, Cost Goods, Sold Breakdown can be discussed with this completely editable template. It is available for immediate download depending on the needs and requirements of the user.


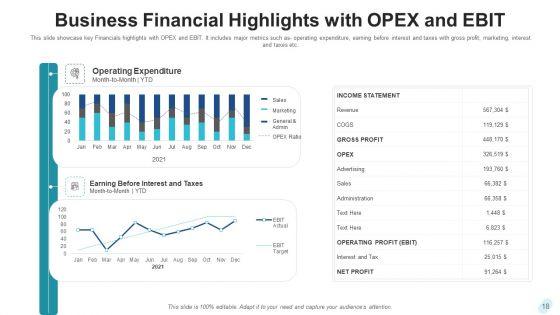
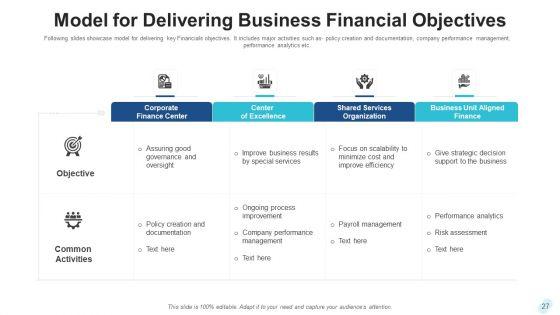
The purpose of this slide is to showcase major objectives and KPIs of the financial department. Net revenue, gross margin, OPEX and EBITDA are some of the key KPIs which will assist corporation to track and improve the financial performance. Showcasing this set of slides titled Financial Objectives And Metrics With Key Approaches Portrait PDF. The topics addressed in these templates are Net Revenue, Gross Margin, Streamline Business. All the content presented in this PPT design is completely editable. Download it and make adjustments in color, background, font etc. as per your unique business setting.


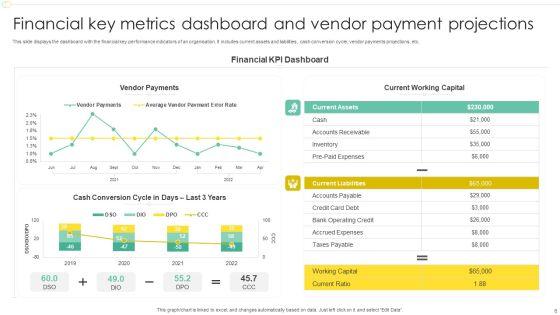
This slide displays the dashboard with the financial key performance indicators of an organisation. It includes current assets and liabilities, cash conversion cycle, vendor payments projections, etc. Pitch your topic with ease and precision using this Financial Key Metrics Dashboard And Vendor Payment Projections Professional PDF. This layout presents information on Financial KPI Dashboard, Current Working Capital, Vendor Payments. It is also available for immediate download and adjustment. So, changes can be made in the color, design, graphics or any other component to create a unique layout.


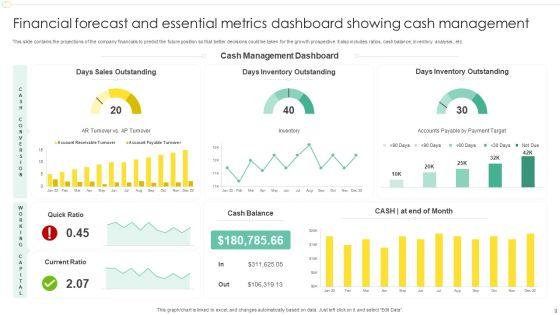
This slide contains the projections of the company financials to predict the future position so that better decisions could be taken for the growth prospective. It also includes ratios, cash balance, inventory analysis , etc. Showcasing this set of slides titled Financial Forecast And Essential Metrics Dashboard Showing Cash Management Designs PDF. The topics addressed in these templates are Days Sales Outstanding, Cash Management Dashboard, Days Inventory Outstanding. All the content presented in this PPT design is completely editable. Download it and make adjustments in color, background, font etc. as per your unique business setting.


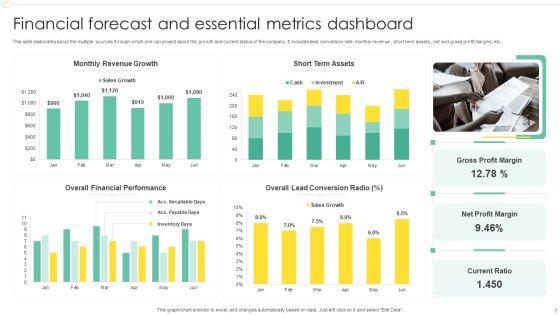
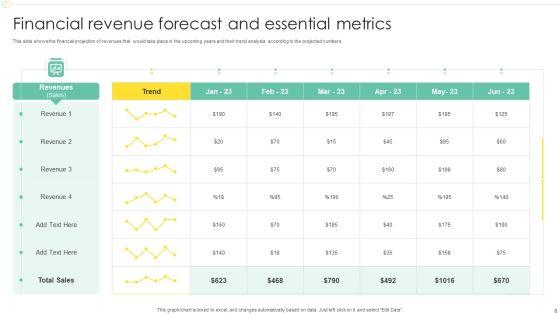
This slide elaborates about the multiple sources through which one can project about the growth and current status of the company. It includes lead conversion rate, monthly revenue , short term assets , net and gross profit margins, etc. Pitch your topic with ease and precision using this Financial Forecast And Essential Metrics Dashboard Ppt File Show PDF. This layout presents information on Monthly Revenue Growth, Short Term Assets, Overall Financial Performance, Net Profit Margin. It is also available for immediate download and adjustment. So, changes can be made in the color, design, graphics or any other component to create a unique layout.


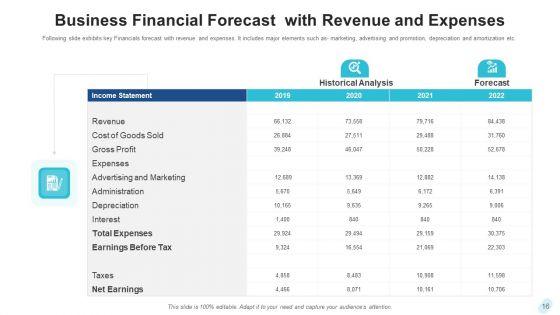
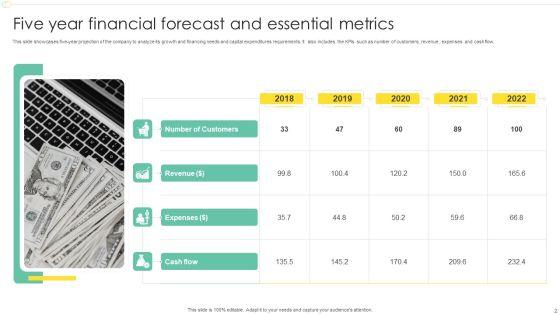
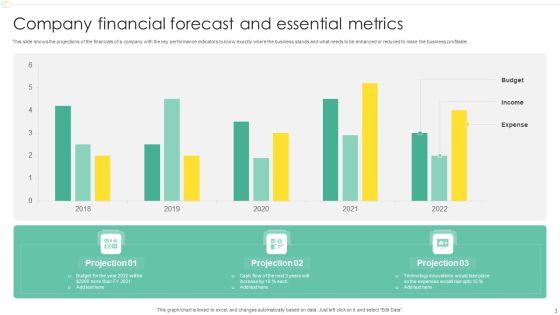
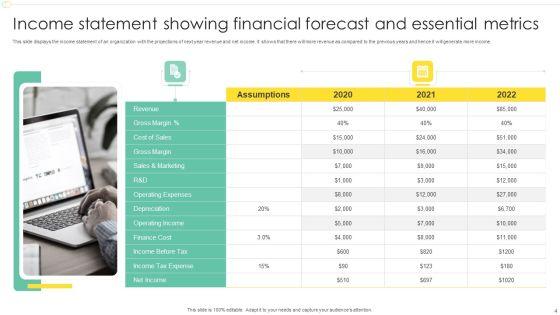
This slide shows the projections of the financials of a company with the key performance indicators to know exactly where the business stands and what needs to be enhanced or reduced to make the business profitable. Showcasing this set of slides titled Company Financial Forecast And Essential Metrics Ppt Model Design Templates PDF. The topics addressed in these templates are Budget, Income, Expense, 2018 To 2022. All the content presented in this PPT design is completely editable. Download it and make adjustments in color, background, font etc. as per your unique business setting.


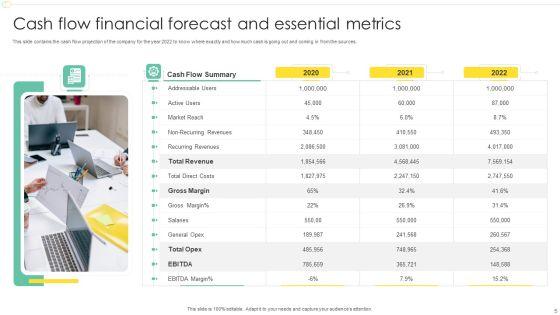
This slide shows the summary of financial results which includes users and financial metrics such as monthly active users, premium subscribers, total revenues, gross profit and margin, operating income and cash flows from operating activities.Showcasing this set of slides titled Outcomes Summary Depicting Financial Metrics Designs PDF The topics addressed in these templates are Operating Margin, Gross Profit, Operating Activities All the content presented in this PPT design is completely editable. Download it and make adjustments in color, background, font etc. as per your unique business setting.


This slide represents the financial dashboard for startup company with key performance indicators. It includes details related to current working capital, cash conversion cycle in days and vendor payment error rate. Pitch your topic with ease and precision using this Startup Business Financial Dashboard With Key Metrics Sample PDF. This layout presents information on Cash Conversion Cycle, Current Working Capital, Current Liabilities Debt. It is also available for immediate download and adjustment. So, changes can be made in the color, design, graphics or any other component to create a unique layout.


This slide represents financial dashboard to develop coffee business plan. It covers revenue breakdown, revenue, cash flow, and cumulative cash flow for five years. Showcasing this set of slides titled dashboard showcasing financial metrics to coffee shop business plan background pdf. The topics addressed in these templates are dashboard showcasing financial metrics to coffee shop business plan. All the content presented in this PPT design is completely editable. Download it and make adjustments in color, background, font etc. as per your unique business setting.


This slide represents dashboard showcasing e-commerce financial process metrics illustrating eccentric purchase conversation rate, shipping revenue, average quantity etc.Showcasing this set of slides titled dashboard depicting e-commerce business financial operations metrics topics pdf The topics addressed in these templates are eccentric purchase, average product revenue, impression rate All the content presented in this PPT design is completely editable. Download it and make adjustments in color, background, font etc. as per your unique business setting.


Following slide displays informational statistics of business traction covering details about users, jobs creation and monthly revenue generation. Deliver and pitch your topic in the best possible manner with this capital fundraising and financial forecast pitch deck key metrics highlighting business traction pictures pdf. Use them to share invaluable insights on key metrics highlighting business traction and impress your audience. This template can be altered and modified as per your expectations. So, grab it now.


This slide focuses on metrics to monitor product financial performance that covers business metrics, measures, current analysis, impact on business and other comments. Presenting plm execution in company metrics to monitor product financial performance demonstration pdf to provide visual cues and insights. Share and navigate important information on four stages that need your due attention. This template can be used to pitch topics like metrics to monitor product financial performance . In addtion, this PPT design contains high resolution images, graphics, etc, that are easily editable and available for immediate download.


This slide focuses on metrics to monitor product financial performance that covers business metrics, measures, current analysis, impact on business and other comments. Deliver and pitch your topic in the best possible manner with this product lifecycle management it metrics to monitor product financial performance topics pdf. Use them to share invaluable insights on metrics to monitor product financial performance and impress your audience. This template can be altered and modified as per your expectations. So, grab it now.
SHOW
- 60
- 120
- 180
DISPLAYING: 60 of 114 Item(s)
Page