 AI PPT Maker
 Templates
 PPT Bundles
 Design Services
 Business PPTs
 Business Plan
 Management
 Strategy
 Introduction PPT
 Roadmap
 Self Introduction
 Timelines
 Process
 Marketing
 Agenda
 Technology
 Medical
 Startup Business Plan
 Cyber Security
 Dashboards
 SWOT
SWOT Proposals
 Education
 Pitch Deck
 Digital Marketing
 KPIs
KPIs Project Management
 Product Management
 Artificial Intelligence
 Target Market
 Communication
 Supply Chain
 Google Slides
 Research Services
 One Pagers
 All Categories
Financial data PowerPoint Presentation Templates and Google Slides
SHOW
- 60
- 120
- 180
DISPLAYING: 60 of 196 Item(s)
Page


Showcase your abilities, skills, and capabilities in business with the use of this Financial Data Revelation To Varied Stakeholders Ppt PowerPoint Presentation Complete Deck With Slides. Use this complete deck with forty one slides to highlight your achievements, experience, expertise, additional responsibilities, etc. With this template, you can ascertain that your efforts are positively recognized. So why wait Download it right now The 100 percent customizable nature of the product and each element of each slide allows you to tailor your knowledge and content according to the scenario and the audience.


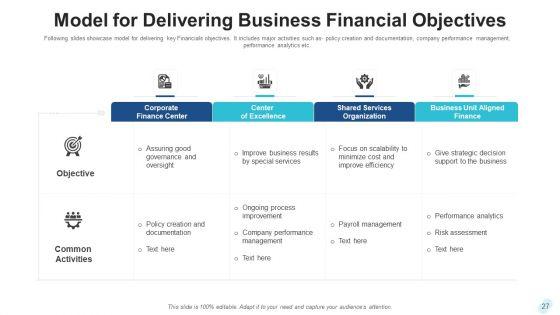
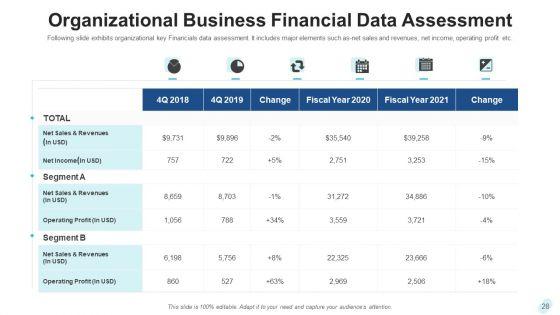

Improve your presentation delivery using this business financial metrics data analysis ppt powerpoint presentation complete deck with slides. Support your business vision and objectives using this well-structured PPT deck. This template offers a great starting point for delivering beautifully designed presentations on the topic of your choice. Comprising twenty nine this professionally designed template is all you need to host discussion and meetings with collaborators. Each slide is self-explanatory and equipped with high-quality graphics that can be adjusted to your needs. Therefore, you will face no difficulty in portraying your desired content using this PPT slideshow. This PowerPoint slideshow contains every important element that you need for a great pitch. It is not only editable but also available for immediate download and utilization. The color, font size, background, shapes everything can be modified to create your unique presentation layout. Therefore, download it now.
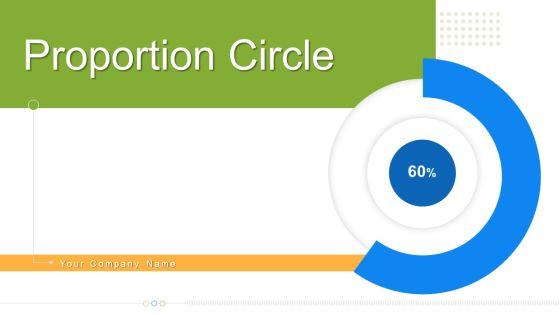


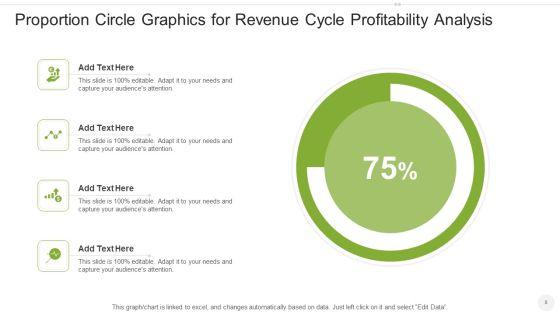


If designing a presentation takes a lot of your time and resources and you are looking for a better alternative, then this proportion circle financial data ppt powerpoint presentation complete deck with slides is the right fit for you. This is a prefabricated set that can help you deliver a great presentation on the topic. All the thirteen slides included in this sample template can be used to present a birds-eye view of the topic. These slides are also fully editable, giving you enough freedom to add specific details to make this layout more suited to your business setting. Apart from the content, all other elements like color, design, theme are also replaceable and editable. This helps in designing a variety of presentations with a single layout. Not only this, you can use this PPT design in formats like PDF, PNG, and JPG once downloaded. Therefore, without any further ado, download and utilize this sample presentation as per your liking.


This is a data gathering draft financial plan ppt sample. This is a seven stage process. The stages in this process are data gathering, draft financial plan, investment proposal, estate insurance and education planning, ongoing portfolio management, statement and performance reviews, updating financial plan.


Presenting this set of slides with name risks types of outsourcing fraud financial and data security ppt powerpoint presentation file example. This is a four stage process. The stages in this process are business process outsourcing, circular infographics, threats. This is a completely editable PowerPoint presentation and is available for immediate download. Download now and impress your audience.


Presenting this set of slides with name project context for financial services data analysis ppt powerpoint presentation professional guidelines. This is a two stage process. The stages in this process are agenda, target audiences, preferred by many, values client, strategy. This is a completely editable PowerPoint presentation and is available for immediate download. Download now and impress your audience.


Presenting this set of slides with name analyze data financial impacts ppt powerpoint presentation gallery slide download. This is a two stage process. The stages in this process are business, management, planning, strategy, marketing. This is a completely editable PowerPoint presentation and is available for immediate download. Download now and impress your audience.


Presenting this set of slides with name financial data analysis ppt powerpoint presentation infographics tips cpb. This is a five stage process. The stages in this process are financial data analysis. This is a completely editable PowerPoint presentation and is available for immediate download. Download now and impress your audience.


Financial Data Analysis Driven Demonstrate Statistics With Scatter Chart PowerPoint Slides Templates
Establish The Dominance Of Your Ideas. Our financial data analysis driven demonstrate statistics with scatter chart powerpoint slides Templates Will Put Them On Top.


We present our 9 correlated blocks of structured data business financial planning PowerPoint templates.Download our Marketing PowerPoint Templates because Our PowerPoint Templates and Slides will fulfill your every need. Use them and effectively satisfy the desires of your audience. Present our Business PowerPoint Templates because Our PowerPoint Templates and Slides team portray an attitude of elegance. Personify this quality by using them regularly. Use our Finance PowerPoint Templates because you can Break through with our PowerPoint Templates and Slides. Bring down the mental barriers of your audience. Use our Process and Flows PowerPoint Templates because Our PowerPoint Templates and Slides will effectively help you save your valuable time. They are readymade to fit into any presentation structure. Present our Arrows PowerPoint Templates because You should Kick up a storm with our PowerPoint Templates and Slides. The heads of your listeners will swirl with your ideas.Use these PowerPoint slides for presentations relating to Diagram, Chart, Business, Background, Vector, Pie, Brown, Abstract, Wheel, Options, Board, Website, Cross, Statistics, Model, Item, Document, Media, Beehives, Red, Hive, Concept, Presentation, Template, Matt, Brochure, Orange, Guide, Description, Multicolor, Marketing, Gray, Development, Title, Management, Honeycomb, Illustration, Six, Catalog, Direction, Plans, Blue, Text, Reports, Financial, Workplace, Navigation, Parts. The prominent colors used in the PowerPoint template are Yellow, Gray, Black. Illustrate the essential elements of the project. Delve into the basic nature with our 9 Correlated Blocks Of Structured Data Business Financial Planning PowerPoint Templates.


We present our Financial Data Business PowerPoint Templates PPT Backgrounds For Slides 0313.Download and present our Technology PowerPoint Templates because It will Give impetus to the hopes of your colleagues. Our PowerPoint Templates and Slides will aid you in winning their trust. Present our Finance PowerPoint Templates because It will let you Set new benchmarks with our PowerPoint Templates and Slides. They will keep your prospects well above par. Use our Communication PowerPoint Templates because you can Break through with our PowerPoint Templates and Slides. Bring down the mental barriers of your audience. Present our Business PowerPoint Templates because Our PowerPoint Templates and Slides ensures Effective communication. They help you put across your views with precision and clarity. Download our Signs PowerPoint Templates because You can Connect the dots. Fan expectations as the whole picture emerges.Use these PowerPoint slides for presentations relating to At Symbol: Data, technology, business, finance, signs, communication. The prominent colors used in the PowerPoint template are Green, Red, Purple. Get a grand finale feel with our Financial Data Business PowerPoint Templates Ppt Backgrounds For Slides 0313. The applause will rise to a crescendo.


We present our 6 stages stack blocks of data business plan financials PowerPoint Slides.Download and present our Ladders PowerPoint Templates because You have the co-ordinates for your destination of success. Let our PowerPoint Templates and Slides map out your journey. Download and present our Shapes PowerPoint Templates because It can Conjure up grand ideas with our magical PowerPoint Templates and Slides. Leave everyone awestruck by the end of your presentation. Download and present our Business PowerPoint Templates because Our PowerPoint Templates and Slides are truly out of this world. Even the MIB duo has been keeping tabs on our team. Download our Circle Charts PowerPoint Templates because Our PowerPoint Templates and Slides will let you Hit the target. Go the full distance with ease and elan. Present our Success PowerPoint Templates because Our PowerPoint Templates and Slides will let you Hit the right notes. Watch your audience start singing to your tune.Use these PowerPoint slides for presentations relating to podium, stand, stair, step, roundly, base, winner, platform, white, stage, success, first, award, championship, silver, third, foot-stall, achievement, rung, foot stall, prize, ladder rung, win, second, champion, foundation, best, illustration, number, jaggies, position, place, round ladder, circular ladder, competition, station, circular podium, pedestal, victory, game, sport. The prominent colors used in the PowerPoint template are Blue, Gray, Black. Keep them attentive with our 6 Stages Stack Blocks Of Data Business Plan Financials PowerPoint Slides. Ensure your ideas are easilyabsorbed.


Following slide demonstrates dashboard for tracking financial data which can be used by organisation for effective cashflow management. It includes key elements such as total expenses and incomes, monthly expenses and income, actual and estimated expense and income list. Showcasing this set of slides titled KPI Dashboard For Business Big Financial Data Analytics Diagrams PDF. The topics addressed in these templates are KPI Dashboard, Business Big Financial, Data Analytics. All the content presented in this PPT design is completely editable. Download it and make adjustments in color, background, font etc. as per your unique business setting.


This slide shows financial data analytics growth trends till 2029 that highlights geographical distribution of growth among different countries. It include key market players and geographical growth etc. Showcasing this set of slides titled Forecasted Financial Data Analytics Expansion Trends Slides PDF. The topics addressed in these templates are Machine Learning, Projected Growth, Industry. All the content presented in this PPT design is completely editable. Download it and make adjustments in color, background, font etc. as per your unique business setting.


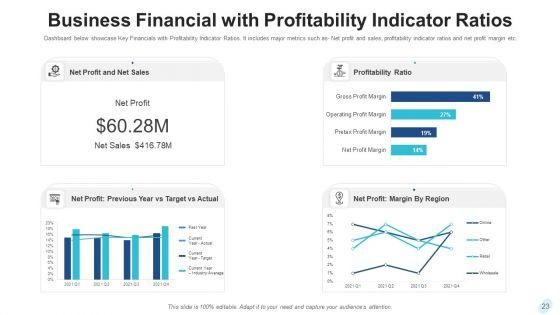
The following slides highlights the financial kpas in summarized form to evaluate companys annual operating performance. It includes metrics such as gross, operating and net profit margin, income statement, target versus actual EBIT etc. Pitch your topic with ease and precision using this Annual Financial Data With KPI Insights Dashboard Structure PDF. This layout presents information on Gross Profit Margin, Operating Profit Margin, Net Profit Margin. It is also available for immediate download and adjustment. So, changes can be made in the color, design, graphics or any other component to create a unique layout.


This slide shows the consolidated statement of cash flow which includes cash flow from investing activities, cash flow from financing activities, etc. Are you in need of a template that can accommodate all of your creative concepts This one is crafted professionally and can be altered to fit any style. Use it with Google Slides or PowerPoint. Include striking photographs, symbols, depictions, and other visuals. Fill, move around, or remove text boxes as desired. Test out color palettes and font mixtures. Edit and save your work, or work with colleagues. Download Financial Data Revelation To Varied Stakeholders Consolidated Statement Of Cash Flow Diagrams PDF and observe how to make your presentation outstanding. Give an impeccable presentation to your group and make your presentation unforgettable.


This slide shows the Total Revenues and Net Income of ABC Corporation for five years In Million dollar Do you have an important presentation coming up Are you looking for something that will make your presentation stand out from the rest Look no further than Financial Data Revelation To Varied Stakeholders Total Revenues And Net Income For Five Years Brochure PDF. With our professional designs, you can trust that your presentation will pop and make delivering it a smooth process. And with Slidegeeks, you can trust that your presentation will be unique and memorable. So why wait Grab Financial Data Revelation To Varied Stakeholders Total Revenues And Net Income For Five Years Brochure PDF today and make your presentation stand out from the rest.


The slide provides the ownership structure of the company includes Founders, Private Investors, Seed Investors etc. with their share percentage. Slidegeeks is here to make your presentations a breeze with Financial Data Revelation To Varied Stakeholders Shareholder Structure Of The Company Microsoft PDF With our easy to use and customizable templates, you can focus on delivering your ideas rather than worrying about formatting. With a variety of designs to choose from, you are sure to find one that suits your needs. And with animations and unique photos, illustrations, and fonts, you can make your presentation pop. So whether you are giving a sales pitch or presenting to the board, make sure to check out Slidegeeks first.


This slide shows the consolidated balance sheet statement of ABC Corporation which includes total assets, current assets, fixed assets, etc. Slidegeeks is one of the best resources for PowerPoint templates. You can download easily and regulate Financial Data Revelation To Varied Stakeholders Consolidated Balance Sheet Statement Formats PDF for your personal presentations from our wonderful collection. A few clicks is all it takes to discover and get the most relevant and appropriate templates. Use our Templates to add a unique zing and appeal to your presentation and meetings. All the slides are easy to edit and you can use them even for advertisement purposes.


This slide shows the composition of revenue and sales by regions such as America, China, Europe, etc. Create an editable Financial Data Revelation To Varied Stakeholders Composition Of Gross Revenue By Services And Region Slides PDF that communicates your idea and engages your audience. Whether you are presenting a business or an educational presentation, pre designed presentation templates help save time. Financial Data Revelation To Varied Stakeholders Composition Of Gross Revenue By Services And Region Slides PDF is highly customizable and very easy to edit, covering many different styles from creative to business presentations. Slidegeeks has creative team members who have crafted amazing templates. So, go and get them without any delay.

This slide illustrates the SAP Analytics Cloud dashboard for financial reporting in terms of net revenue, operating profit, cost of goods sold, profitability trend and net revenue by country. It also provides details of net worth of incoming order and order distribution by country. Coming up with a presentation necessitates that the majority of the effort goes into the content and the message you intend to convey. The visuals of a PowerPoint presentation can only be effective if it supplements and supports the story that is being told. Keeping this in mind our experts created BI Technique For Data Informed Decisions Sap Analytics Cloud Dashboard For Financial Reporting Portrait PDF to reduce the time that goes into designing the presentation. This way, you can concentrate on the message while our designers take care of providing you with the right template for the situation.


This slide visually present the financial performance of organization in terms of revenue, gross and net profit and earnings per share with key insights. If you are looking for a format to display your unique thoughts, then the professionally designed BI Technique For Data Informed Decisions Financial Performance Of Organization Guidelines PDF is the one for you. You can use it as a Google Slides template or a PowerPoint template. Incorporate impressive visuals, symbols, images, and other charts. Modify or reorganize the text boxes as you desire. Experiment with shade schemes and font pairings. Alter, share or cooperate with other people on your work. Download BI Technique For Data Informed Decisions Financial Performance Of Organization Guidelines PDF and find out how to give a successful presentation. Present a perfect display to your team and make your presentation unforgettable.


Here we present the One Page Big Data Financial Balance Sheet With Assets And Liabilities PDF Document PPT Template. This One-pager template includes everything you require. You can edit this document and make changes according to your needs it offers complete freedom of customization. Grab this One Page Big Data Financial Balance Sheet With Assets And Liabilities PDF Document PPT Template Download now.


Heres a predesigned One Page NDA Document To Protect Financial Data PDF Document PPT Template for you. Built on extensive research and analysis, this one-pager template has all the centerpieces of your specific requirements. This temple exudes brilliance and professionalism. Being completely editable, you can make changes to suit your purpose. Get this One Page NDA Document To Protect Financial Data PDF Document PPT Template Download now.


Looking for a predesigned One Pager Monthly Management Report With Key Financial Data PDF Document PPT Template Heres the perfect piece for you It has everything that a well-structured one-pager template should have. Besides, it is 100 percent editable, which offers you the cushion to make adjustments according to your preferences. Grab this One Pager Monthly Management Report With Key Financial Data PDF Document PPT Template Download now.


Here we present the One Page Financial Balance Sheet For Big Data Assets PDF Document PPT Template. This One-pager template includes everything you require. You can edit this document and make changes according to your needs it offers complete freedom of customization. Grab this One Page Financial Balance Sheet For Big Data Assets PDF Document PPT Template Download now.
SHOW
- 60
- 120
- 180
DISPLAYING: 60 of 196 Item(s)
Page