 AI PPT Maker
 Templates
 PPT Bundles
 Design Services
 Business PPTs
 Business Plan
 Management
 Strategy
 Introduction PPT
 Roadmap
 Self Introduction
 Timelines
 Process
 Marketing
 Agenda
 Technology
 Medical
 Startup Business Plan
 Cyber Security
 Dashboards
 SWOT
SWOT Proposals
 Education
 Pitch Deck
 Digital Marketing
 KPIs
KPIs Project Management
 Product Management
 Artificial Intelligence
 Target Market
 Communication
 Supply Chain
 Google Slides
 Research Services
 One Pagers
 All Categories
Executive dashboards PowerPoint Presentation Templates and Google Slides
SHOW
- 60
- 120
- 180
DISPLAYING: 60 of 116 Item(s)
Page


Improve your presentation delivery using this Executive Dashboards Ppt PowerPoint Presentation Complete Deck With Slides. Support your business vision and objectives using this well-structured PPT deck. This template offers a great starting point for delivering beautifully designed presentations on the topic of your choice. Comprising Twelve this professionally designed template is all you need to host discussion and meetings with collaborators. Each slide is self-explanatory and equipped with high-quality graphics that can be adjusted to your needs. Therefore, you will face no difficulty in portraying your desired content using this PPT slideshow. This PowerPoint slideshow contains every important element that you need for a great pitch. It is not only editable but also available for immediate download and utilization. The color, font size, background, shapes everything can be modified to create your unique presentation layout. Therefore, download it now.


This slide covers dashboard for analysing workforce data using the new HRMS. It includes talent management KPIs such as employees, monthly salary, vacancies, hiring stats, talent turnover rate, talent satisfaction, etc. Here you can discover an assortment of the finest PowerPoint and Google Slides templates. With these templates, you can create presentations for a variety of purposes while simultaneously providing your audience with an eye catching visual experience. Download HRMS Execution Plan Dashboard For Tracking Employee Information Through HRMS Portrait PDF to deliver an impeccable presentation. These templates will make your job of preparing presentations much quicker, yet still, maintain a high level of quality. Slidegeeks has experienced researchers who prepare these templates and write high quality content for you. Later on, you can personalize the content by editing the HRMS Execution Plan Dashboard For Tracking Employee Information Through HRMS Portrait PDF.


This slide provides information regarding dashboard for HR helpdesk executive with resolution time, knowledgebase effectiveness, etc. Make sure to capture your audiences attention in your business displays with our gratis customizable Transforming Human Resource Service Delivery Procedure Determine HR Helpdesk Executive Dashboard Background PDF. These are great for business strategies, office conferences, capital raising or task suggestions. If you desire to acquire more customers for your tech business and ensure they stay satisfied, create your own sales presentation with these plain slides.


This slide represents ICT Information and Communication Technology business security dashboard to track threats and incidents. It covers details regarding issues by control type, risk categories, etc. Boost your pitch with our creative Execution Of ICT Strategic Plan ICT Business Security KPI Dashboard Designs PDF. Deliver an awe inspiring pitch that will mesmerize everyone. Using these presentation templates you will surely catch everyones attention. You can browse the ppts collection on our website. We have researchers who are experts at creating the right content for the templates. So you do not have to invest time in any additional work. Just grab the template now and use them.


Following slide demonstrates KPI dashboard to monitor performance of sales executives to determine best performing employee. It includes key components such as monthly performance, targets achieved, sales by executives, lead funnel, total daily and monthly profits. Pitch your topic with ease and precision using this KPI Dashboard To Monitor Operational Sales Executive Performance Portrait PDF. This layout presents information on Revenue, Profit, Sales, Customers. It is also available for immediate download and adjustment. So, changes can be made in the color, design, graphics or any other component to create a unique layout.


The following slide showcases a dashboard to evaluate organizational performance in market and analyze competition. It outlines components such as number of mention, sentiment meter, number of mentions, geographical distribution. Find a pre designed and impeccable Guidebook For Executing Business Market Intelligence Dashboard To Analyze Business Brochure PDF. The templates can ace your presentation without additional effort. You can download these easy to edit presentation templates to make your presentation stand out from others. So, what are you waiting for Download the template from Slidegeeks today and give a unique touch to your presentation.


This slide provides information regarding post project completion assessment to assess project effectiveness through comparing planned costs and benefits with actual costs and benefits to determine overall projects value. Do you know about Slidesgeeks Project Excellence Playbook For Executives Post Project Completion Analysis Dashboard Microsoft PDF. These are perfect for delivering any kind od presentation. Using it, create PowerPoint presentations that communicate your ideas and engage audiences. Save time and effort by using our pre designed presentation templates that are perfect for a wide range of topic. Our vast selection of designs covers a range of styles, from creative to business, and are all highly customizable and easy to edit. Download as a PowerPoint template or use them as Google Slides themes.


This modern and well-arranged Project Excellence Playbook For Executives Dashboard To Track Project Essential Activities Clipart PDF provides lots of creative possibilities. It is very simple to customize and edit with the Powerpoint Software. Just drag and drop your pictures into the shapes. All facets of this template can be edited with Powerpoint no extra software is necessary. Add your own material, put your images in the places assigned for them, adjust the colors, and then you can show your slides to the world, with an animated slide included.


This slide showcases dashboard that can help organization to track on job training program. Its key components are training number, training status, budget, duration, training type and number of trainees. Slidegeeks is one of the best resources for PowerPoint templates. You can download easily and regulate Developing And Executing On Job Coaching Program In Company Dashboard To Track Employee Training Microsoft PDF for your personal presentations from our wonderful collection. A few clicks is all it takes to discover and get the most relevant and appropriate templates. Use our Templates to add a unique zing and appeal to your presentation and meetings. All the slides are easy to edit and you can use them even for advertisement purposes.
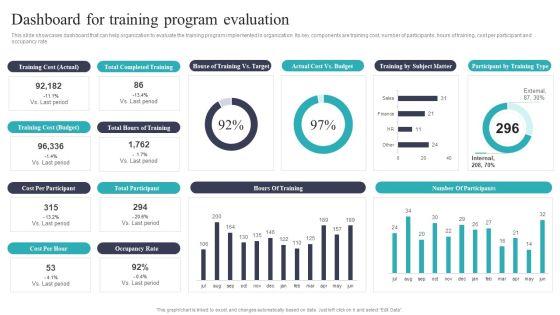

This slide showcases dashboard that can help organization to evaluate the training program implemented in organization. Its key components are training cost, number of participants, hours of training, cost per participant and occupancy rate. Create an editable Developing And Executing On Job Coaching Program In Company Dashboard For Training Program Elements PDF that communicates your idea and engages your audience. Whether youre presenting a business or an educational presentation, pre-designed presentation templates help save time. Developing And Executing On Job Coaching Program In Company Dashboard For Training Program Elements PDF is highly customizable and very easy to edit, covering many different styles from creative to business presentations. Slidegeeks has creative team members who have crafted amazing templates. So, go and get them without any delay.


This slide shows the KPI dashboard of data migration assessment. It includes details related to development status to plan, target design percentage complete, field mapping percentage complete and field mapping and rule backlog. Pitch your topic with ease and precision using this Database Migration Assessment Executive Summary Dashboard Mockup PDF. This layout presents information on Wave, Process Area, Rule Build Status Plan. It is also available for immediate download and adjustment. So, changes can be made in the color, design, graphics or any other component to create a unique layout


The following slide highlights the overall business performance for the financial year 2021 to assess variations and trace accuracy. It includes KPIs such as total income, expenditures, revenue and expense breakdown, fund structure etc. Pitch your topic with ease and precision using this Business Executive Summary KPI Dashboard For Year 2023 Graphics PDF. This layout presents information on Revenue Breakdown, Revenue Category, Expense Breakdown. It is also available for immediate download and adjustment. So, changes can be made in the color, design, graphics or any other component to create a unique layout.


Pitch your topic with ease and precision using this Retail Executive Dashboards With Key Analytics Guidelines PDF. This layout presents information on Retail Executive Dashboards, Key Analytics. It is also available for immediate download and adjustment. So, changes can be made in the color, design, graphics or any other component to create a unique layout.


Showcasing this set of slides titled Executive Key Dashboards Of Digital Marketing Company Guidelines PDF. The topics addressed in these templates are Conversions, Cost Per Conversion, Adwords Overview. All the content presented in this PPT design is completely editable. Download it and make adjustments in color, background, font etc. as per your unique business setting.


This slide represents the CEO dashboard for tracking the sales performance of the organization. It includes key performance indicators such as gross, operating and net profit, sales amount by category, income statement etc. Pitch your topic with ease and precision using this Executive Dashboards To Track Sales Performance Guidelines PDF. This layout presents information on Income Statement, Monthly Sales Growth, Days Receivable Outstanding. It is also available for immediate download and adjustment. So, changes can be made in the color, design, graphics or any other component to create a unique layout.
This slide represents the dashboard for the CEO to track the companys performance. It includes key performance indicators such as no. of deals, open deals, revenue, expected revenue and win percentage. Showcasing this set of slides titled Executive Dashboards For Tracking Key Performance Icons PDF. The topics addressed in these templates are Pen Deals, Revenue, Expected Revenue. All the content presented in this PPT design is completely editable. Download it and make adjustments in color, background, font etc. as per your unique business setting.
This slide represents the CEO dashboard to track the financial health of an organization. It includes key performance indicators such as revenue, expenses, activity ratio, gross profit margin, EBIT etc. Pitch your topic with ease and precision using this Executive Dashboards For Tracking Financial Health Of Enterprise Diagrams PDF. This layout presents information on Revenue, Expense, Activity Ratio. It is also available for immediate download and adjustment. So, changes can be made in the color, design, graphics or any other component to create a unique layout.


This slide represents the executive dashboard for management of employees in the organization. It includes details related to employee cost over sales revenue, satisfaction survey results, employee engagement by departments, employee turnover and absenteeism rate etc. Showcasing this set of slides titled Executive Dashboards For Talent Management Pictures PDF. The topics addressed in these templates are Employee Turnover Rate, Employee Absenteeism Rate, Internal Promotion Rate. All the content presented in this PPT design is completely editable. Download it and make adjustments in color, background, font etc. as per your unique business setting.


This slide represents the dashboard showing the key performance indicators of the marketing performance of an organization. It includes key performance indicators such as no. of users, leads, MQL, SQL, customers, cost per lead etc. Pitch your topic with ease and precision using this Executive Dashboards For Marketing Performance Management Slides PDF. This layout presents information on Cost Per Lead, Cost Per Customer. It is also available for immediate download and adjustment. So, changes can be made in the color, design, graphics or any other component to create a unique layout.


This slide represents the dashboard for the CEO to track the global financial performance of the organization. It includes key performance indicators such as revenue, quick ratio, short term assets etc. Showcasing this set of slides titled Chief Executive Dashboards With Financial Topics PDF. The topics addressed in these templates are Short Term Assets, Global Financial Performance, Debt Equity. All the content presented in this PPT design is completely editable. Download it and make adjustments in color, background, font etc. as per your unique business setting.


This slide illustrates the KPI dashboard for workforce diversity providing details regarding headcount by seniority, gender and gender. It also provides information regarding monthly median age by gender and women at senior level forecast. Presenting this PowerPoint presentation, titled Executing Diversity KPI Dashboard To Monitor Workforce Executing Diversity Structure PDF, with topics curated by our researchers after extensive research. This editable presentation is available for immediate download and provides attractive features when used. Download now and captivate your audience. Presenting this Executing Diversity KPI Dashboard To Monitor Workforce Executing Diversity Structure PDF. Our researchers have carefully researched and created these slides with all aspects taken into consideration. This is a completely customizable Executing Diversity KPI Dashboard To Monitor Workforce Executing Diversity Structure PDF that is available for immediate downloading. Download now and make an impact on your audience. Highlight the attractive features available with our PPTs.


This slide represents the diversity dashboard providing information regarding work force distribution on gender and ethnicity. It also includes details of year wise involuntary and voluntary turnover rates. The Executing Diversity Workforce Diversity Dashboard Based On Gender And Ethnicity Distribution Rules PDF is a compilation of the most recent design trends as a series of slides. It is suitable for any subject or industry presentation, containing attractive visuals and photo spots for businesses to clearly express their messages. This template contains a variety of slides for the user to input data, such as structures to contrast two elements, bullet points, and slides for written information. Slidegeeks is prepared to create an impression.


This slide depicts the performance measuring dashboard for diversity and inclusion program providing information regarding the employee engagement, workforce by disability type, unconscious biases complaints etc. Crafting an eye-catching presentation has never been more straightforward. Let your presentation shine with this tasteful yet straightforward Executing Diversity Performance Measuring Dashboard For Executing Diversity And Inclusion Brochure PDF template. It offers a minimalistic and classy look that is great for making a statement. The colors have been employed intelligently to add a bit of playfulness while still remaining professional. Construct the ideal Executing Diversity Performance Measuring Dashboard For Executing Diversity And Inclusion Brochure PDF that effortlessly grabs the attention of your audience Begin now and be certain to wow your customers.


This slide covers information regarding the key traits of inclusive leadership such as commitment, courage, cognize bias, curiosity etc. It also provides details about thinking to develop and behavior to adopt for becoming an effective inclusive leader. If your project calls for a presentation, then Slidegeeks is your go-to partner because we have professionally designed, easy-to-edit templates that are perfect for any presentation. After downloading, you can easily edit Executing Diversity KPI Dashboard To Monitor Workforce Executing Diversity Background PDF and make the changes accordingly. You can rearrange slides or fill them with different images. Check out all the handy templates.


This slide shows the dashboard representing data related to the performance of warehouse for its management. It shows query- provisioning and overload time along with its execution. Pitch your topic with ease and precision using this Warehouse Efficiency Management Dashboard Showing Query Execution Rules PDF. This layout presents information on Warehouse Performance, Warehouse Size, Database. It is also available for immediate download and adjustment. So, changes can be made in the color, design, graphics or any other component to create a unique layout.


This slide illustrates the KPI dashboard for tracking automation program data. It also include metrics such as idea velocity, forecasted savings, benefits deployed, benefits in pipeline, etc. Showcasing this set of slides titled Robotic Process Automation Metrics Accelerator Executive KPI Dashboard Formats PDF. The topics addressed in these templates are Opportunities, Benefit In Development, Value. All the content presented in this PPT design is completely editable. Download it and make adjustments in color, background, font etc. as per your unique business setting.
This slide covers RPA metrics for analyzing test execution on automated platforms. It also includes test execution metrics such as total test executed, test status, tests executed daily for different operation systems, etc. Pitch your topic with ease and precision using this Robotic Process Automation Dashboard With Monthly Test Execution KPI Icons PDF. This layout presents information on Robotic Process Automation Dashboard, Monthly Test Execution Kpi. It is also available for immediate download and adjustment. So, changes can be made in the color, design, graphics or any other component to create a unique layout.


The following slide showcases IT executive dashboard to provide key personnel an insight of companys problems and resolved issues. It includes mean time to solve by priority, open and resolved incidents and overdue requests. Pitch your topic with ease and precision using this IT Executive Incident Management Dashboard Microsoft PDF. This layout presents information on IT Executive Incident, Management Dashboard. It is also available for immediate download and adjustment. So, changes can be made in the color, design, graphics or any other component to create a unique layout.


The following slide outlines a comprehensive KPI dashboard which can be used to analyze the performance of Facebook video campaign. It provides information about page video views, page video views organic etc. Coming up with a presentation necessitates that the majority of the effort goes into the content and the message you intend to convey. The visuals of a PowerPoint presentation can only be effective if it supplements and supports the story that is being told. Keeping this in mind our experts created Executing Video Promotional KPI Metrics Dashboard To Evaluate Facebook Video Campaign Summary PDF to reduce the time that goes into designing the presentation. This way, you can concentrate on the message while our designers take care of providing you with the right template for the situation.


The following slide outlines key performance indicator KPI dashboard which will assist the marketer to track YouTube marketing campaign performance. The key metrics covered in the slide are subscribers gained and lost, likes, dislikes, comments, shares etc. Formulating a presentation can take up a lot of effort and time, so the content and message should always be the primary focus. The visuals of the PowerPoint can enhance the presenters message, so our Executing Video Promotional KPI Dashboard To Measure Effectiveness Of Youtube Marketing Professional PDF was created to help save time. Instead of worrying about the design, the presenter can concentrate on the message while our designers work on creating the ideal templates for whatever situation is needed. Slidegeeks has experts for everything from amazing designs to valuable content, we have put everything into Executing Video Promotional KPI Dashboard To Measure Effectiveness Of Youtube Marketing Professional PDF
This slide covers the dashboard for monitoring various audience segments. It includes metrics such as ad mentions, engagement, top occupation of the audience, top interest of the audience, age, language, etc. The Dashboard For Tracking Brand Communication Campaign Results Executing Brand Communication Strategy Clipart PDF is a compilation of the most recent design trends as a series of slides. It is suitable for any subject or industry presentation, containing attractive visuals and photo spots for businesses to clearly express their messages. This template contains a variety of slides for the user to input data, such as structures to contrast two elements, bullet points, and slides for written information. Slidegeeks is prepared to create an impression.


This slide covers the dashboard for tracking brand reputation. It also includes metrics such as new customer lifetime value, customer acquisition cost, target met, above sales target, average weekly sales revenue, etc. The best PPT templates are a great way to save time, energy, and resources. Slidegeeks have 100parcent editable powerpoint slides making them incredibly versatile. With these quality presentation templates, you can create a captivating and memorable presentation by combining visually appealing slides and effectively communicating your message. Download Dashboard For Analyzing Brand Perception Executing Brand Communication Strategy Summary PDF from Slidegeeks and deliver a wonderful presentation.


This slide covers the project management dashboard which includes status of project phases such as planning, designing, development and testing that also focuses on launch date of project, overdue tasks with date, deadline, etc. and workload on employees. Coming up with a presentation necessitates that the majority of the effort goes into the content and the message you intend to convey. The visuals of a PowerPoint presentation can only be effective if it supplements and supports the story that is being told. Keeping this in mind our experts created Project Time Management Execution Strategies Project Management Dashboard To Evaluate Performance Template PDF to reduce the time that goes into designing the presentation. This way, you can concentrate on the message while our designers take care of providing you with the right template for the situation.


This slide focuses on dashboard to monitor project status and performance which includes estimated budget, actual cost, time taken by project team to complete phases, completion percentage of project, etc. If you are looking for a format to display your unique thoughts, then the professionally designed Project Time Management Execution Strategies Dashboard To Monitor Project Status And Performance Summary PDF is the one for you. You can use it as a Google Slides template or a PowerPoint template. Incorporate impressive visuals, symbols, images, and other charts. Modify or reorganize the text boxes as you desire. Experiment with shade schemes and font pairings. Alter, share or cooperate with other people on your work. Download Project Time Management Execution Strategies Dashboard To Monitor Project Status And Performance Summary PDF and find out how to give a successful presentation. Present a perfect display to your team and make your presentation unforgettable.


The following slide highlights the employee payroll dashboard for executive, management and workers illustrating key headings which includes country, pay period, pay groups, payroll summary, payroll results, payroll details, payroll preparation, payroll processing and worker data. Showcasing this set of slides titled Personnel Salary Dashboard For Executive Management And Workers Rules PDF. The topics addressed in these templates are Management, Executive, Employees Fund. All the content presented in this PPT design is completely editable. Download it and make adjustments in color, background, font etc. as per your unique business setting.


This graph or chart is linked to excel, and changes automatically based on data. Just left click on it and select Edit Data. Whether you have daily or monthly meetings, a brilliant presentation is necessary. Personal Branding Plan For Executives Customer Satisfaction KPI Dashboard Graphics PDF can be your best option for delivering a presentation. Represent everything in detail using Personal Branding Plan For Executives Customer Satisfaction KPI Dashboard Graphics PDF and make yourself stand out in meetings. The template is versatile and follows a structure that will cater to your requirements. All the templates prepared by Slidegeeks are easy to download and edit. Our research experts have taken care of the corporate themes as well. So, give it a try and see the results.


The following slide exhibits a key performance indicator KPI dashboard which can be used to evaluate the risks involved in real estate business. The kpis covered in the slide are corporate risk, control performance, open issues etc. This modern and well-arranged Executing Risk Mitigation Risk Management KPI Dashboard Of Real Estate Company Portrait PDF provides lots of creative possibilities. It is very simple to customize and edit with the Powerpoint Software. Just drag and drop your pictures into the shapes. All facets of this template can be edited with Powerpoint, no extra software is necessary. Add your own material, put your images in the places assigned for them, adjust the colors, and then you can show your slides to the world, with an animated slide included.


This slide cover organizational executive dashboard to track pi planning which includes top clients, managerial performance, order margin and forecasted value with net profit. Pitch your topic with ease and precision using this Organizational Executive Dashboard To Track Pi Project Planning Ppt Professional Background PDF. This layout presents information on Weighted Forecast Value, Top 10, Client YTD. It is also available for immediate download and adjustment. So, changes can be made in the color, design, graphics or any other component to create a unique layout.


This slide represents the dashboard for data warehouse implementation in the organization, including transactions per hour and value, total value by the day, and location.Deliver and pitch your topic in the best possible manner with this Executive Information Database System Dashboard For Data Warehouse Implementation Ideas PDF. Use them to share invaluable insights on Transactions Time, Value Location, Journeys Value and impress your audience. This template can be altered and modified as per your expectations. So, grab it now.
This slide provides information regarding sales management activities tracking dashboard to measure closed business, sales pipeline, sales activity by sales rep, month over month growth, forecast by month, etc. Deliver and pitch your topic in the best possible manner with this Instructions Playbook For B2B Sales Executive Sales Management Activities Tracking Dashboard Pictures PDF. Use them to share invaluable insights on Closed Business, Sales Pipeline, Sales Activity and impress your audience. This template can be altered and modified as per your expectations. So, grab it now.


This slide covers executive sales and operations dashboard for inventory management. It involves total number of accounts, monthly recuring revenue, conversion rate and monthly recurring revenue retention rate. Showcasing this set of slides titled Executive Marketing And Operations Dashboard For Inventory Management Template PDF. The topics addressed in these templates are Product, Marketing, Sales. All the content presented in this PPT design is completely editable. Download it and make adjustments in color, background, font etc. as per your unique business setting.
This slide shows the issues tracking the dashboard for the business transition project. It provides details of multiple issues faced by users to keep records for effective management of the project. Deliver and pitch your topic in the best possible manner with this Change Execution Plan Dashboard For Issues Tracking Ppt PowerPoint Presentation Gallery Background Images PDF. Use them to share invaluable insights on Employee Wise Issues, Overall Issues Status, High Churn Issue and impress your audience. This template can be altered and modified as per your expectations. So, grab it now.


This slide illustrates facts and figures relating to software program implementation plan. It includes requests, pending milestones, completed milestones, issues and risks etc.Showcasing this set of slides titled IT Program Execution Strategy Dashboard Topics PDF The topics addressed in these templates are IT Program Execution Strategy Dashboard All the content presented in this PPT design is completely editable. Download it and make adjustments in color, background, font etc. as per your unique business setting.
SHOW
- 60
- 120
- 180
DISPLAYING: 60 of 116 Item(s)
Page