 AI PPT Maker
 Templates
 PPT Bundles
 Design Services
 Business PPTs
 Business Plan
 Management
 Strategy
 Introduction PPT
 Roadmap
 Self Introduction
 Timelines
 Process
 Marketing
 Agenda
 Technology
 Medical
 Startup Business Plan
 Cyber Security
 Dashboards
 SWOT
SWOT Proposals
 Education
 Pitch Deck
 Digital Marketing
 KPIs
KPIs Project Management
 Product Management
 Artificial Intelligence
 Target Market
 Communication
 Supply Chain
 Google Slides
 Research Services
 One Pagers
 All Categories
Digital graphics PowerPoint Presentation Templates and Google Slides
SHOW
- 60
- 120
- 180
DISPLAYING: 60 of 387 Item(s)
Page


Presenting this set of slides with name lead scoring digital marketing ppt powerpoint presentation outline graphics template cpb. This is an editable Powerpoint one stages graphic that deals with topics like lead scoring digital marketing to help convey your message better graphically. This product is a premium product available for immediate download and is 100 percent editable in Powerpoint. Download this now and use it in your presentations to impress your audience.


Presenting this set of slides with name digital table top weighing scale ppt powerpoint presentation professional graphics download. The topics discussed in these slides are weighing scale, measure, weighing machine. This is a completely editable PowerPoint presentation and is available for immediate download. Download now and impress your audience.


Digital Marketing Summary Dashboard Ppt PowerPoint Presentation Infographic Template Graphics Design
Presenting this set of slides with name digital marketing summary dashboard ppt powerpoint presentation infographic template graphics design. The topics discussed in these slides are finance, marketing, management, investment, analysis. This is a completely editable PowerPoint presentation and is available for immediate download. Download now and impress your audience.


Presenting this set of slides with name digital reputation tracking ppt powerpoint presentation infographic template graphics pictures cpb. This is an editable Powerpoint three stages graphic that deals with topics like digital reputation tracking to help convey your message better graphically. This product is a premium product available for immediate download and is 100 percent editable in Powerpoint. Download this now and use it in your presentations to impress your audience.
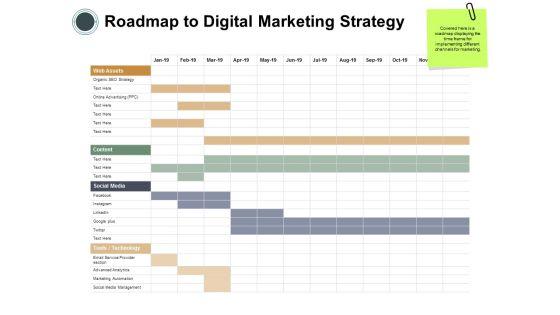


Presenting this set of slides with name roadmap to digital marketing strategy ppt powerpoint presentation styles graphics download. The topics discussed in these slides are business, management, planning, strategy, marketing. This is a completely editable PowerPoint presentation and is available for immediate download. Download now and impress your audience.


Presenting this set of slides with name digital marketing key statistics ppt powerpoint presentation styles graphics example. This is a five stage process. The stages in this process are business, management, planning, strategy, marketing. This is a completely editable PowerPoint presentation and is available for immediate download. Download now and impress your audience.


Presenting this set of slides with name content digital marketing ppt powerpoint presentation styles graphics download. This is a nine stage process. The stages in this process are digital marketing, content, business, management, planning. This is a completely editable PowerPoint presentation and is available for immediate download. Download now and impress your audience.
Presenting this set of slides with name digital marketing mix ppt powerpoint presentation icon graphics pictures cpb. This is an editable Powerpoint five stages graphic that deals with topics like digital marketing mix to help convey your message better graphically. This product is a premium product available for immediate download and is 100 percent editable in Powerpoint. Download this now and use it in your presentations to impress your audience.


This is a Table Of Contents Product Development Using Agile Digital Transformation IT Graphics PDF template with various stages. Focus and dispense information on five stages using this creative set, that comes with editable features. It contains large content boxes to add your information on topics like Current Scenario Assessment, Agile Transformation, Transformation Is Crucial You can also showcase facts, figures, and other relevant content using this PPT layout. Grab it now.
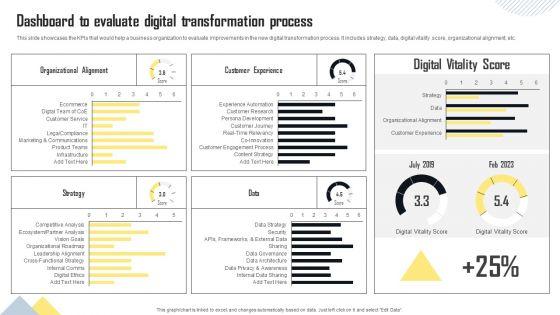
This slide showcases the KPIs that would help a business organization to evaluate improvements in the new digital transformation process. It includes strategy, data, digital vitality score, organizational alignment, etc. Here you can discover an assortment of the finest PowerPoint and Google Slides templates. With these templates, you can create presentations for a variety of purposes while simultaneously providing your audience with an eye catching visual experience. Download Dashboard To Evaluate Digital Transformation Process Graphics PDF to deliver an impeccable presentation. These templates will make your job of preparing presentations much quicker, yet still, maintain a high level of quality. Slidegeeks has experienced researchers who prepare these templates and write high quality content for you. Later on, you can personalize the content by editing the Dashboard To Evaluate Digital Transformation Process Graphics PDF.


This slide covers details about the requirement of Chief Digital Officer which will be considered as important in digital advancement of firm as he plays vital role in increasing firms digital capabilities. Whether you have daily or monthly meetings, a brilliant presentation is necessary. Framework For Digital Transformation And Modernization Need Of Appointing Chief Digital Officer Graphics PDF can be your best option for delivering a presentation. Represent everything in detail using Framework For Digital Transformation And Modernization Need Of Appointing Chief Digital Officer Graphics PDF and make yourself stand out in meetings. The template is versatile and follows a structure that will cater to your requirements. All the templates prepared by Slidegeeks are easy to download and edit. Our research experts have taken care of the corporate themes as well. So, give it a try and see the results.


This slide provides information regarding the areas in which firm can initiate digital enablement such as operation and processes, resources and organization and workflow. Firm can choose any or all the dimensions as per requirement at a time. From laying roadmaps to briefing everything in detail, our templates are perfect for you. You can set the stage with your presentation slides. All you have to do is download these easy to edit and customizable templates. Framework For Digital Transformation And Modernization Identified Dimensions For Digital Enablement Graphics PDF will help you deliver an outstanding performance that everyone would remember and praise you for. Do download this presentation today.


This slide presents the findings of the social media audit in context of competitor analysis. It includes information regarding the social media followers count, monthly content posting activity along with the details of content sharing on digital channels such as Facebook, Instagram, and Twitter. Here you can discover an assortment of the finest PowerPoint and Google Slides templates. With these templates, you can create presentations for a variety of purposes while simultaneously providing your audience with an eye catching visual experience. Download Definitive Guide To Conduct Digital Marketing Inspection Competitive Landscape With Social Media Audit Findings Graphics PDF to deliver an impeccable presentation. These templates will make your job of preparing presentations much quicker, yet still, maintain a high level of quality. Slidegeeks has experienced researchers who prepare these templates and write high quality content for you. Later on, you can personalize the content by editing the Definitive Guide To Conduct Digital Marketing Inspection Competitive Landscape With Social Media Audit Findings Graphics PDF.


This slides shows cyber attack trends on different countries post Russia-Ukraine War. It include countries such as Russia, Ukraine, United States etc. Pitch your topic with ease and precision using this Digital Terrorism Attack Trends Post Russia Ukraine War Graphics PDF. This layout presents information on Organization, Digital Terrorism Attack Trends. It is also available for immediate download and adjustment. So, changes can be made in the color, design, graphics or any other component to create a unique layout.


This slide highlights the loan disbursal rate from 2018 to 2022 which showcases drop in approval. It also focus on the loan portfolio breakup form the 2022 year. Do you know about Slidesgeeks Improving Digital Banking Operations And Services Framework Decline In Loans Disbursal Rate Graphics PDF These are perfect for delivering any kind od presentation. Using it, create PowerPoint presentations that communicate your ideas and engage audiences. Save time and effort by using our pre designed presentation templates that are perfect for a wide range of topic. Our vast selection of designs covers a range of styles, from creative to business, and are all highly customizable and easy to edit. Download as a PowerPoint template or use them as Google Slides themes.


Mentioned slide illustrates KPI dashboard that can be used by managers to assess financial health of supply chain business. KPIs covered are supply chain costs versus sales, cash to order cycle, warehouse operating cost distribution etc.Coming up with a presentation necessitates that the majority of the effort goes into the content and the message you intend to convey. The visuals of a PowerPoint presentation can only be effective if it supplements and supports the story that is being told. Keeping this in mind our experts created Supply Chain Kpi Dashboard For Effective Financial Analysis Stand Out Digital Supply Chain Tactics Enhancing Graphics PDF to reduce the time that goes into designing the presentation. This way, you can concentrate on the message while our designers take care of providing you with the right template for the situation.


Following slide demonstrates supply chain success measurement dashboard. It includes details about cash to cash cycle along with statistics like days of inventory, days of receivable and days of payables. If your project calls for a presentation, then Slidegeeks is your go-to partner because we have professionally designed, easy-to-edit templates that are perfect for any presentation. After downloading, you can easily edit Digital Transformation Of Supply Supply Chain Success Metrics Dashboard Graphics PDF and make the changes accordingly. You can rearrange slides or fill them with different images. Check out all the handy templates.


The slide highlights the company ownership structure and FII holdings for financial year 2022. It showcases shareholding of promoters, public, mutual funds, foreign institutional investors and other institutions. Do you have an important presentation coming up Are you looking for something that will make your presentation stand out from the rest Look no further than Digital Products Company Outline Shareholding Pattern Graphics PDF. With our professional designs, you can trust that your presentation will pop and make delivering it a smooth process. And with Slidegeeks, you can trust that your presentation will be unique and memorable. So why wait Grab Digital Products Company Outline Shareholding Pattern Graphics PDF today and make your presentation stand out from the rest.


The slide shows annual revenue growth of the company with the CAGR for last five financial years from 2018 to 2022. It also highlights year on year growth along with key insights. Presenting this PowerPoint presentation, titled Digital Products Company Outline Company Historic Revenue Graphics PDF, with topics curated by our researchers after extensive research. This editable presentation is available for immediate download and provides attractive features when used. Download now and captivate your audience. Presenting this Digital Products Company Outline Company Historic Revenue Graphics PDF. Our researchers have carefully researched and created these slides with all aspects taken into consideration. This is a completely customizable Digital Products Company Outline Company Historic Revenue Graphics PDF that is available for immediate downloading. Download now and make an impact on your audience. Highlight the attractive features available with our PPTs.


This slide represents the dashboard to track and measure the performance and efficiency of digital marketing software. It includes details related to KPIs such as social media followers, Facebook demographics etc. If you are looking for a format to display your unique thoughts, then the professionally designed System Deployment Project Digital Marketing Software Key Metrics Dashboard Graphics PDF is the one for you. You can use it as a Google Slides template or a PowerPoint template. Incorporate impressive visuals, symbols, images, and other charts. Modify or reorganize the text boxes as you desire. Experiment with shade schemes and font pairings. Alter, share or cooperate with other people on your work. Download System Deployment Project Digital Marketing Software Key Metrics Dashboard Graphics PDF and find out how to give a successful presentation. Present a perfect display to your team and make your presentation unforgettable.


This slide illustrates service desk dashboard for monitoring information technology IT infrastructure. It provides information about issues, safety inspection, problem servers, workstations, operating system, Windows, Mac, Linux, etc. Do you have to make sure that everyone on your team knows about any specific topic I yes, then you should give Service Desk Dashboard For Monitoring It Infrastructure Digitalization Of Service Desk Administration Ppt Summary Graphics Example PDF a try. Our experts have put a lot of knowledge and effort into creating this impeccable Service Desk Dashboard For Monitoring It Infrastructure Digitalization Of Service Desk Administration Ppt Summary Graphics Example PDF. You can use this template for your upcoming presentations, as the slides are perfect to represent even the tiniest detail. You can download these templates from the Slidegeeks website and these are easy to edit. So grab these today.


This slide represents the global market size of the digital biomarkers from the year 2022 to 2028. It also depicts the estimated rate for the year 2021 and the anticipated compound annual growth rate of the digital biomarkers market. Presenting this PowerPoint presentation, titled Digital Resilience Biomarker Technologies IT Global Market Size Of Digital Biomarkers Graphics PDF, with topics curated by our researchers after extensive research. This editable presentation is available for immediate download and provides attractive features when used. Download now and captivate your audience. Presenting this Digital Resilience Biomarker Technologies IT Global Market Size Of Digital Biomarkers Graphics PDF. Our researchers have carefully researched and created these slides with all aspects taken into consideration. This is a completely customizable Digital Resilience Biomarker Technologies IT Global Market Size Of Digital Biomarkers Graphics PDF that is available for immediate downloading. Download now and make an impact on your audience. Highlight the attractive features available with our PPTs.


This slide focuses on the effectiveness of online media channels which covers email marketing, social PPC, content marketing, direct mail, etc.Get a simple yet stunning designed Effectiveness Of Online Media Channels Digital Marketing Strategy Deployment Graphics PDF. It is the best one to establish the tone in your meetings. It is an excellent way to make your presentations highly effective. So, download this PPT today from Slidegeeks and see the positive impacts. Our easy-to-edit Effectiveness Of Online Media Channels Digital Marketing Strategy Deployment Graphics PDF can be your go-to option for all upcoming conferences and meetings. So, what are you waiting for Grab this template today.


The slide compares top competitor comparison of software company to assess companies based on employee count, geographical presence, active software, revenue and global market share. Present like a pro with Digital Application Software Development Business Profile Competitor Comparison Graphics PDF Create beautiful presentations together with your team, using our easy-to-use presentation slides. Share your ideas in real-time and make changes on the fly by downloading our templates. So whether youre in the office, on the go, or in a remote location, you can stay in sync with your team and present your ideas with confidence. With Slidegeeks presentation got a whole lot easier. Grab these presentations today.


This slide provides details regarding contribution of 5G to global economy with key enablers to digital economy such as infrastructure digital security and safety, regional specific content and services, etc. Boost your pitch with our creative 5G Technology Development For Digital Transformation Assessing Contribution Of 5G To Global Economy Graphics PDF. Deliver an awe inspiring pitch that will mesmerize everyone. Using these presentation templates you will surely catch everyones attention. You can browse the ppts collection on our website. We have researchers who are experts at creating the right content for the templates. So you do not have to invest time in any additional work. Just grab the template now and use them.


The following slide highlights the KPIs of digital marketing to assess ROI. It includes monthly active user rate, customer retention rate at the end of the year, current vs previous active users, quarterly growth rate etc.Pitch your topic with ease and precision using this Key Insights Of Digital Marketing Administration Ppt PowerPoint Presentation Styles Graphics Template PDF. This layout presents information on Possible Reasons, Content Marketing, Growth Rate. It is also available for immediate download and adjustment. So, changes can be made in the color, design, graphics or any other component to create a unique layout.


This slide focuses on firm focusing on optimizing digital customer experience that shows rate of overall customer experience and engagement quality with company today and in next three years.Deliver an awe inspiring pitch with this creative Firm Focusing On Optimizing Digital Customer Experience Graphics PDF Background PDF bundle. Topics like Experience Engagement, Company Product, Results Improving can be discussed with this completely editable template. It is available for immediate download depending on the needs and requirements of the user.
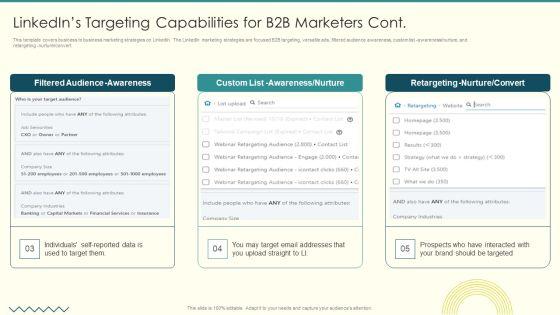
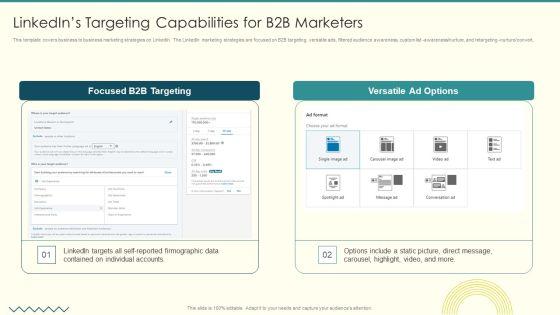
This template covers business to business marketing strategies on LinkedIn. The LinkedIn marketing strategies are focused B2B targeting, versatile ads, filtered audience awareness, custom list awareness nurture, and retargeting nurture convert.Deliver an awe inspiring pitch with this creative Security And Performance Digital Marketing Linkedins Targeting Capabilities For B2B Marketers Cont Graphics PDF bundle. Topics like Filtered Audience, Awareness Nurture, Retargeting Nurture can be discussed with this completely editable template. It is available for immediate download depending on the needs and requirements of the user.


This slide focuses on digital marketing metrics to monitor sales effectiveness which covers total visits and impressions, cost per click, engagement rate, website demographics, quarterly product sales, etc. Deliver an awe inspiring pitch with this creative Digital Marketing Metrics To Monitor Sales Effectiveness Graphics PDF bundle. Topics like Website Demographics, Quarterly Product Sales, Revenue By Channel can be discussed with this completely editable template. It is available for immediate download depending on the needs and requirements of the user.


This is a Table Of Contents Improved Digital Expenditure For Magnified Resilience Graphics PDF template with various stages. Focus and dispense information on six stages using this creative set, that comes with editable features. It contains large content boxes to add your information on topics like Scenario Assessment, Towards Strategic, Optimization Process. You can also showcase facts, figures, and other relevant content using this PPT layout. Grab it now.


This slide focuses on digital marketing metrics to monitor sales effectiveness which covers total visits and impressions, cost per click, engagement rate, website demographics, quarterly product sales, etc.Deliver and pitch your topic in the best possible manner with this Sales Process Automation For Revenue Growth Digital Marketing Metrics To Monitor Sales Effectiveness Graphics PDF. Use them to share invaluable insights on Automation Potential, Role Of Automation, Included Activities and impress your audience. This template can be altered and modified as per your expectations. So, grab it now.


Deliver an awe inspiring pitch with this creative Table Of Content For Digital Asset Management In Visual World Graphics PDF bundle. Topics like Asset Management, Digital Experience, Manage Complexity can be discussed with this completely editable template. It is available for immediate download depending on the needs and requirements of the user.

This slide covers the complexity of assets to be managed by brands such as making banners and thumbnails, making videos responsive on different devices, choosing resolutions to optimize performance without losing visible quality.Deliver an awe inspiring pitch with this creative Digital Asset Management In Visual World Added Scale Comes Added Complexity Graphics PDF bundle. Topics like Banners Or Thumbnails, Selecting Resolutions, Display Enhancement can be discussed with this completely editable template. It is available for immediate download depending on the needs and requirements of the user.


This graph depicts the financial performance of the company wherein revenues, expenses and profit are evaluated.Deliver and pitch your topic in the best possible manner with this Integration Of Digital Technology In Organization Company Financial Performance Graphics PDF Use them to share invaluable insights on Decrease In Revenues, Increase Expenses, Decrease In Profit and impress your audience. This template can be altered and modified as per your expectations. So, grab it now.
SHOW
- 60
- 120
- 180
DISPLAYING: 60 of 387 Item(s)
Page