 AI PPT Maker
 Templates
 PPT Bundles
 Design Services
 Business PPTs
 Business Plan
 Management
 Strategy
 Introduction PPT
 Roadmap
 Self Introduction
 Timelines
 Process
 Marketing
 Agenda
 Technology
 Medical
 Startup Business Plan
 Cyber Security
 Dashboards
 SWOT
SWOT Proposals
 Education
 Pitch Deck
 Digital Marketing
 KPIs
KPIs Project Management
 Product Management
 Artificial Intelligence
 Target Market
 Communication
 Supply Chain
 Google Slides
 Research Services
 One Pagers
 All Categories
Development dashboard PowerPoint Presentation Templates and Google Slides
SHOW
- 60
- 120
- 180
DISPLAYING: 60 of 355 Item(s)
Page


Induce strategic thinking by presenting this complete deck. Enthrall your audience by deploying this thought provoking PPT deck. It can be downloaded in both standard and widescreen aspect ratios, thus making it a complete package to use and deploy. Convey your thoughts and actions using the twenty two slides presented in this complete deck. Additionally, feel free to alter its components like color, graphics, design, etc, to create a great first impression. Grab it now by clicking on the download button below.


If designing a presentation takes a lot of your time and resources and you are looking for a better alternative, then this Development And Operations KPI Dashboard Ppt PowerPoint Presentation Complete Deck With Slides is the right fit for you. This is a prefabricated set that can help you deliver a great presentation on the topic. All the twelve slides included in this sample template can be used to present a birds-eye view of the topic. These slides are also fully editable, giving you enough freedom to add specific details to make this layout more suited to your business setting. Apart from the content, all other elements like color, design, theme are also replaceable and editable. This helps in designing a variety of presentations with a single layout. Not only this, you can use this PPT design in formats like PDF, PNG, and JPG once downloaded. Therefore, without any further ado, download and utilize this sample presentation as per your liking.


Experiential Retail Store Network Development Retail Store Performance Analysis Dashboard Themes PDF
This slide provides information regarding the dashboard to track retail store performance analysis in terms of units per transaction, net profit, revenues, sales square foot per location, etc. Crafting an eye-catching presentation has never been more straightforward. Let your presentation shine with this tasteful yet straightforward Experiential Retail Store Network Development Retail Store Performance Analysis Dashboard Themes PDF template. It offers a minimalistic and classy look that is great for making a statement. The colors have been employed intelligently to add a bit of playfulness while still remaining professional. Construct the ideal Experiential Retail Store Network Development Retail Store Performance Analysis Dashboard Themes PDF that effortlessly grabs the attention of your audience Begin now and be certain to wow your customers
This slide provides information regarding the dashboard which will help team in managing different activities associated to agile projects and keep track on the time, task summary, etc. Are you in need of a template that can accommodate all of your creative concepts This one is crafted professionally and can be altered to fit any style. Use it with Google Slides or PowerPoint. Include striking photographs, symbols, depictions, and other visuals. Fill, move around, or remove text boxes as desired. Test out color palettes and font mixtures. Edit and save your work, or work with colleagues. Download Agile Product Development Agile Project Management Activities Tracking Dashboard Icons PDF and observe how to make your presentation outstanding. Give an impeccable presentation to your group and make your presentation unforgettable.
This slide provides information regarding different brands performance tracking dashboard in terms of brand metric, brand commitment, advertising metrics, and purchase metrics. Make sure to capture your audiences attention in your business displays with our gratis customizable Developing Brand Awareness To Gain Customer Attention Different Brands Performance Tracking Dashboard Introduction PDF. These are great for business strategies, office conferences, capital raising or task suggestions. If you desire to acquire more customers for your tech business and ensure they stay satisfied, create your own sales presentation with these plain slides.


The following slide showcases a dashboard to develop sustainable business and manage energy usage. It provides information about sustainability pledges, energy usage by month, energy usage by year and energy usage by building type. Presenting this PowerPoint presentation, titled Business Sustainability Development And Management Dashboard Guidelines PDF, with topics curated by our researchers after extensive research. This editable presentation is available for immediate download and provides attractive features when used. Download now and captivate your audience. Presenting this Business Sustainability Development And Management Dashboard Guidelines PDF. Our researchers have carefully researched and created these slides with all aspects taken into consideration. This is a completely customizable Business Sustainability Development And Management Dashboard Guidelines PDF that is available for immediate downloading. Download now and make an impact on your audience. Highlight the attractive features available with our PPTs.
This slide represents metric dashboard to track sales performance on e-commerce website. It cover performance indicators such as sales breakdown, order breakdown, recurring sales etc. Make sure to capture your audiences attention in your business displays with our gratis customizable Strategies For Successful Customer Base Development In B2b M Commerce B2b Sales Performance Tracking Dashboard Demonstration PDF. These are great for business strategies, office conferences, capital raising or task suggestions. If you desire to acquire more customers for your tech business and ensure they stay satisfied, create your own sales presentation with these plain slides.


This slide represents metric dashboard to track and analyze b2b ecommerce website performance. It covers total user visits, sales, average return per user etc. If you are looking for a format to display your unique thoughts, then the professionally designed Strategies For Successful Customer Base Development In B2b M Commerce B2b Ecommerce Dashboard To Track Website Sample PDF is the one for you. You can use it as a Google Slides template or a PowerPoint template. Incorporate impressive visuals, symbols, images, and other charts. Modify or reorganize the text boxes as you desire. Experiment with shade schemes and font pairings. Alter, share or cooperate with other people on your work. Download Strategies For Successful Customer Base Development In B2b M Commerce B2b Ecommerce Dashboard To Track Website Sample PDF and find out how to give a successful presentation. Present a perfect display to your team and make your presentation unforgettable.


Crafting an eye catching presentation has never been more straightforward. Let your presentation shine with this tasteful yet straightforward Smartphone Game Development And Advertising Technique Dashboard For Measuring Unique Visitors Brochure PDF template. It offers a minimalistic and classy look that is great for making a statement. The colors have been employed intelligently to add a bit of playfulness while still remaining professional. Construct the ideal Smartphone Game Development And Advertising Technique Dashboard For Measuring Unique Visitors Brochure PDF that effortlessly grabs the attention of your audience. Begin now and be certain to wow your customers.
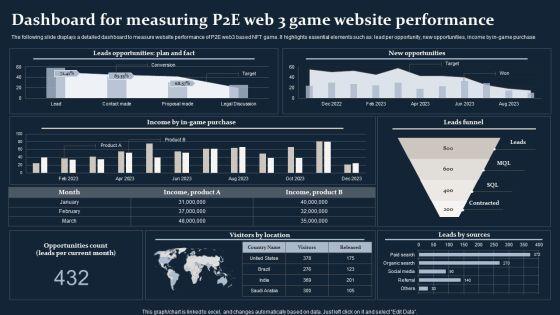

Are you in need of a template that can accommodate all of your creative concepts This one is crafted professionally and can be altered to fit any style. Use it with Google Slides or PowerPoint. Include striking photographs, symbols, depictions, and other visuals. Fill, move around, or remove text boxes as desired. Test out color palettes and font mixtures. Edit and save your work, or work with colleagues. Download Smartphone Game Development And Advertising Technique Dashboard For Measuring P2E Web 3 Game Website Information PDF and observe how to make your presentation outstanding. Give an impeccable presentation to your group and make your presentation unforgettable.


Following slide demonstrates dashboard for tracking law firm development plan progress to determine key practice areas. It includes elements such as number of won ,lost and decline cases, opportunity sources, proposal type and proportion of practice areas. Showcasing this set of slides titled KPI Dashboard To Track Progress Of Law Firm Development Strategic Plan Infographics PDF. The topics addressed in these templates are Opportunities, Cases, Practice Areas. All the content presented in this PPT design is completely editable. Download it and make adjustments in color, background, font etc. as per your unique business setting.


This slide shows the dashboard that depicts website data insights which covers channels such as display, social and email with total sessions, pages, average session duration, bounce rate, goal completion. Are you in need of a template that can accommodate all of your creative concepts This one is crafted professionally and can be altered to fit any style. Use it with Google Slides or PowerPoint. Include striking photographs, symbols, depictions, and other visuals. Fill, move around, or remove text boxes as desired. Test out color palettes and font mixtures. Edit and save your work, or work with colleagues. Download Brand Development Techniques To Increase Revenues Dashboard Depicting Website Data Diagrams PDF and observe how to make your presentation outstanding. Give an impeccable presentation to your group and make your presentation unforgettable.


Mentioned slide showcases KPI dashboard that can be used to check the financial performance of a brand. Metrics covered in the dashboard are return on assets, working capital ratio, return on equity etc. Coming up with a presentation necessitates that the majority of the effort goes into the content and the message you intend to convey. The visuals of a PowerPoint presentation can only be effective if it supplements and supports the story that is being told. Keeping this in mind our experts created Developing Market Leading Businesses KPI Dashboard To Track Brand Performance Summary PDF to reduce the time that goes into designing the presentation. This way, you can concentrate on the message while our designers take care of providing you with the right template for the situation.


Following slide illustrates KPI dashboard that can be used to track the awareness level of a specific brand. KPIs covered in the slide are traffic, attention, authority, inbound channel performance etc. Are you in need of a template that can accommodate all of your creative concepts This one is crafted professionally and can be altered to fit any style. Use it with Google Slides or PowerPoint. Include striking photographs, symbols, depictions, and other visuals. Fill, move around, or remove text boxes as desired. Test out color palettes and font mixtures. Edit and save your work, or work with colleagues. Download Developing Market Leading Businesses Brand Awareness Measuring KPI Dashboard Themes PDF and observe how to make your presentation outstanding. Give an impeccable presentation to your group and make your presentation unforgettable.


This slide dashboard that can help organization to track employee turnover rate after implementing succession plan. Other KPIs are absenteeism rate, employees hired and left, employment status etc. This modern and well-arranged Strategic Talent Development HR KPI Dashboard To Track Employee Turnover Rate Summary PDF provides lots of creative possibilities. It is very simple to customize and edit with the Powerpoint Software. Just drag and drop your pictures into the shapes. All facets of this template can be edited with Powerpoint, no extra software is necessary. Add your own material, put your images in the places assigned for them, adjust the colors, and then you can show your slides to the world, with an animated slide included.


This slide highlights dashboard that can help organization to track the training progress of candidates. Its key elements are number of participants, training cost, participants by training type etc. Find highly impressive Strategic Talent Development Dashboard To Track Training And Coaching Progress Information PDF on Slidegeeks to deliver a meaningful presentation. You can save an ample amount of time using these presentation templates. No need to worry to prepare everything from scratch because Slidegeeks experts have already done a huge research and work for you. You need to download Strategic Talent Development Dashboard To Track Training And Coaching Progress Information PDF for your upcoming presentation. All the presentation templates are 100 percent editable and you can change the color and personalize the content accordingly. Download now.


This slide showcases dashboard that can help organization to track the major information security risks and resolve them in timely manner. Its key components are risk rating breakdown, heat map, action plan and top 5 vulnerabilities. Welcome to our selection of the Developing IT Security Strategy Risk Management Dashboard For Information Security Mockup PDF. These are designed to help you showcase your creativity and bring your sphere to life. Planning and Innovation are essential for any business that is just starting out. This collection contains the designs that you need for your everyday presentations. All of our PowerPoints are 100 percent editable, so you can customize them to suit your needs. This multi-purpose template can be used in various situations. Grab these presentation templates today.

This slide showcases dashboard that can help organization in managing the data security risks. Its key elements are enterprise risk, risk by objectives, data protection finding and overdue actions by status. Slidegeeks has constructed Developing IT Security Strategy Dashboard For Data Security Risk Management Pictures PDF after conducting extensive research and examination. These presentation templates are constantly being generated and modified based on user preferences and critiques from editors. Here, you will find the most attractive templates for a range of purposes while taking into account ratings and remarks from users regarding the content. This is an excellent jumping-off point to explore our content and will give new users an insight into our top-notch PowerPoint Templates.


This slide shows the dashboard to measure content effectiveness which includes blog subscribers, opportunities to enhance rankings, click-through rate, pageviews, ad impressions, etc. Get a simple yet stunning designed Developing Content Marketing Dashboard To Measure Content Effectiveness Brochure PDF. It is the best one to establish the tone in your meetings. It is an excellent way to make your presentations highly effective. So, download this PPT today from Slidegeeks and see the positive impacts. Our easy-to-edit Developing Content Marketing Dashboard To Measure Content Effectiveness Brochure PDF can be your go-to option for all upcoming conferences and meetings. So, what are you waiting for Grab this template today.


This slide shows the KPI dashboard of training and development workshop. It includes KPIs such as number of participants, train9ng duration, training type, etc. Showcasing this set of slides titled KPI Dashboard Of Strategic Training And Development Workshop Rules PDF. The topics addressed in these templates are Actual Cost, Training Type, Training Budget, Cost Per Participant. All the content presented in this PPT design is completely editable. Download it and make adjustments in color, background, font etc. as per your unique business setting.


This slide showcases dashboard that can help organization to track on job training program. Its key components are absenteeism rate, overtime hours, training duration and cost and overall labor effectiveness rate. From laying roadmaps to briefing everything in detail, our templates are perfect for you. You can set the stage with your presentation slides. All you have to do is download these easy-to-edit and customizable templates. Business Development Program Dashboard To Track Employee Performance Portrait PDF will help you deliver an outstanding performance that everyone would remember and praise you for. Do download this presentation today.


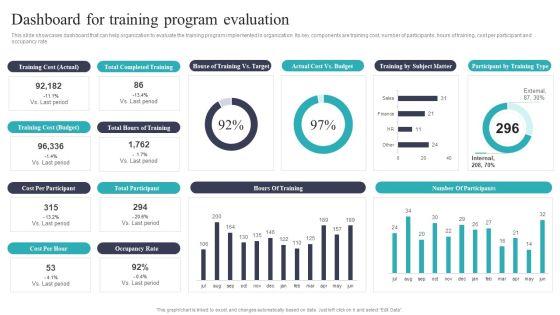
This slide showcases dashboard that can help organization to evaluate the training program implemented in organization. Its key components are training cost, number of participants, hours of training, cost per participant and occupancy rate. Get a simple yet stunning designed Business Development Program Dashboard For Training Program Evaluation Infographics PDF. It is the best one to establish the tone in your meetings. It is an excellent way to make your presentations highly effective. So, download this PPT today from Slidegeeks and see the positive impacts. Our easy-to-edit Business Development Program Dashboard For Training Program Evaluation Infographics PDF can be your go-to option for all upcoming conferences and meetings. So, what are you waiting for Grab this template today.
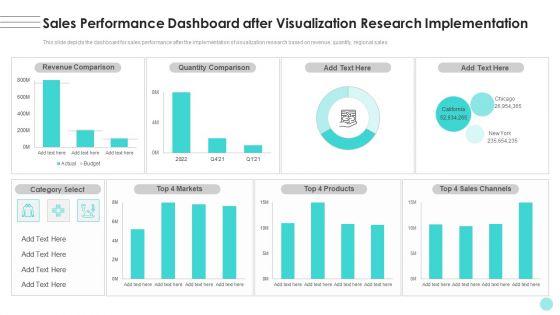

This slide depicts the dashboard for sales performance after the implementation of visualization research based on revenue, quantity, regional sales. Crafting an eye-catching presentation has never been more straightforward. Let your presentation shine with this tasteful yet straightforward Branches For Visualization Research And Development Sales Performance Dashboard After Infographics PDF template. It offers a minimalistic and classy look that is great for making a statement. The colors have been employed intelligently to add a bit of playfulness while still remaining professional. Construct the ideal Branches For Visualization Research And Development Sales Performance Dashboard After Infographics PDF that effortlessly grabs the attention of your audience Begin now and be certain to wow your customers.


This slide represents dashboard for innovative product management. It includes ideas raised, project funding, challenges against ideas etc. Pitch your topic with ease and precision using this Innovative Product Concept Development And Management Dashboard Introduction PDF This layout presents information on Scoring Ideas, Budget Allocated, Challenges. It is also available for immediate download and adjustment. So, changes can be made in the color, design, graphics or any other component to create a unique layout.
Mentioned slide outlines key performance indicator KPI dashboard which can be used by organization to monitor training and development strategies. The major metrics covered in the template are cost per participant, per hour, number of trainees , etc. Showcasing this set of slides titled Employee Training And Development Plan Performance Tracking Dashboard Portrait PDF. The topics addressed in these templates are Employee Training, Development Plan Performance, Tracking Dashboard. All the content presented in this PPT design is completely editable. Download it and make adjustments in color, background, font etc. as per your unique business setting.


This slide displays construction analytics for a specific project to track capital project outcomes, reduce risks, and uncover critical insights. It includes information such as contract and client name, schedule performance index and construction price index. Showcasing this set of slides titled Construction Expenses Dashboard With Progress Report And Budget Development Background PDF. The topics addressed in these templates are Budget Development, Execution Status, Commercial Store. All the content presented in this PPT design is completely editable. Download it and make adjustments in color, background, font etc. as per your unique business setting.


This slide depicts the dashboard for dApp development based on the portfolio performance, recent activities, assets, deposits, and so on. Do you have an important presentation coming up Are you looking for something that will make your presentation stand out from the rest Look no further than Decentralized Applications Dashboard For Dapp Development Demonstration PDF. With our professional designs, you can trust that your presentation will pop and make delivering it a smooth process. And with Slidegeeks, you can trust that your presentation will be unique and memorable. So why wait Grab Decentralized Applications Dashboard For Dapp Development Demonstration PDF today and make your presentation stand out from the rest.


The purpose of this slide is to exhibit a key performance indicator KPI dashboard through which managers can analyze the monthly employee retention rate. The metrics covered in the slide are active employees, new candidates hired, internal, exit, employee turnover rate, etc.Do you have to make sure that everyone on your team knows about any specific topic I yes, then you should give KPI Metrics Dashboard Highlighting Employee Retention Rate Developing Employee Retention Techniques Sample PDF a try. Our experts have put a lot of knowledge and effort into creating this impeccable KPI Metrics Dashboard Highlighting Employee Retention Rate Developing Employee Retention Techniques Sample PDF. You can use this template for your upcoming presentations, as the slides are perfect to represent even the tiniest detail. You can download these templates from the Slidegeeks website and these are easy to edit. So grab these today.


The purpose of this slide is to delineate a staff retention dashboard through which the human resource HR department can measure the effectiveness of retention strategies. The KPIs are hiring source, location, department, job type, job category etc.Retrieve professionally designed Employee Retention Dashboard For Hr Department Developing Employee Retention Techniques Topics PDF to effectively convey your message and captivate your listeners. Save time by selecting pre-made slideshows that are appropriate for various topics, from business to educational purposes. These themes come in many different styles, from creative to corporate, and all of them are easily adjustable and can be edited quickly. Access them as PowerPoint templates or as Google Slides themes. You do not have to go on a hunt for the perfect presentation because Slidegeeks got you covered from everywhere.


This slide showcases dashboard that can help organization to track on job training program. Its key components are training number, training status, budget, duration, training type and number of trainees. Slidegeeks is one of the best resources for PowerPoint templates. You can download easily and regulate Developing And Executing On Job Coaching Program In Company Dashboard To Track Employee Training Microsoft PDF for your personal presentations from our wonderful collection. A few clicks is all it takes to discover and get the most relevant and appropriate templates. Use our Templates to add a unique zing and appeal to your presentation and meetings. All the slides are easy to edit and you can use them even for advertisement purposes.

This slide showcases dashboard that can help organization to evaluate the training program implemented in organization. Its key components are training cost, number of participants, hours of training, cost per participant and occupancy rate. Create an editable Developing And Executing On Job Coaching Program In Company Dashboard For Training Program Elements PDF that communicates your idea and engages your audience. Whether youre presenting a business or an educational presentation, pre-designed presentation templates help save time. Developing And Executing On Job Coaching Program In Company Dashboard For Training Program Elements PDF is highly customizable and very easy to edit, covering many different styles from creative to business presentations. Slidegeeks has creative team members who have crafted amazing templates. So, go and get them without any delay.


Make sure to capture your audiences attention in your business displays with our gratis customizable Developing Personal Brand On Social Media Channels Customer Satisfaction Kpi Dashboard Designs PDF. These are great for business strategies, office conferences, capital raising or task suggestions. If you desire to acquire more customers for your tech business and ensure they stay satisfied, create your own sales presentation with these plain slides.


This slide covers project evaluation dashboard including planning, design , development and testing for evaluating the project while proceeding to closure. Crafting an eye-catching presentation has never been more straightforward. Let your presentation shine with this tasteful yet straightforward Software Development Life Cycle Planning Project Management Dashboard Topics PDF template. It offers a minimalistic and classy look that is great for making a statement. The colors have been employed intelligently to add a bit of playfulness while still remaining professional. Construct the ideal Software Development Life Cycle Planning Project Management Dashboard Topics PDF that effortlessly grabs the attention of your audience Begin now and be certain to wow your customers.


This slide showcases dashboard for website analytics that can help organization to gather data about visitors and formulate targeted marketing campaigns. It can also help to make individual and group buyer personas. Are you in need of a template that can accommodate all of your creative concepts This one is crafted professionally and can be altered to fit any style. Use it with Google Slides or PowerPoint. Include striking photographs, symbols, depictions, and other visuals. Fill, move around, or remove text boxes as desired. Test out color palettes and font mixtures. Edit and save your work, or work with colleagues. Download Developing Promotional Strategic Plan For Online Marketing Website Analytics Dashboard For Consumer Summary PDF and observe how to make your presentation outstanding. Give an impeccable presentation to your group and make your presentation unforgettable.


Are you in need of a template that can accommodate all of your creative concepts. This one is crafted professionally and can be altered to fit any style. Use it with Google Slides or PowerPoint. Include striking photographs, symbols, depictions, and other visuals. Fill, move around, or remove text boxes as desired. Test out color palettes and font mixtures. Edit and save your work, or work with colleagues. Download Developing Promotional Strategic Plan For Online Marketing Dashboard For Personalized Microsoft PDF and observe how to make your presentation outstanding. Give an impeccable presentation to your group and make your presentation unforgettable.


This slide showcases KPI dashboard to keep check on major project constraints for avoiding unforeseen company losses. It further includes elements such as budget risks and cost. Pitch your topic with ease and precision using this Dashboard To Track Project Limitations By Development Stages Ideas PDF. This layout presents information on Budget By Project Tasks, Risks. It is also available for immediate download and adjustment. So, changes can be made in the color, design, graphics or any other component to create a unique layout.


This slide shows the dashboard that depicts website data insights which covers channels such as display, social and email with total sessions, pages, average session duration, bounce rate, goal completion. Get a simple yet stunning designed Implementing Brand Development Dashboard Depicting Website Data Insights Guidelines PDF. It is the best one to establish the tone in your meetings. It is an excellent way to make your presentations highly effective. So, download this PPT today from Slidegeeks and see the positive impacts. Our easy-to-edit Implementing Brand Development Dashboard Depicting Website Data Insights Guidelines PDF can be your go-to option for all upcoming conferences and meetings. So, what are you waiting for Grab this template today.


This slide covers application performance in market KPIs and metrics such as impressions, clicks, searches for app, conversion rate etc. This Selling App Development Launch And Marketing Application Performance Dashboard Inspiration PDF from Slidegeeks makes it easy to present information on your topic with precision. It provides customization options, so you can make changes to the colors, design, graphics, or any other component to create a unique layout. It is also available for immediate download, so you can begin using it right away. Slidegeeks has done good research to ensure that you have everything you need to make your presentation stand out. Make a name out there for a brilliant performance.


Explore a selection of the finest Marketing Performance Dashboard With Advertisement Stages To Develop Demand Generation Tactics Themes PDF here. With a plethora of professionally designed and pre-made slide templates, you can quickly and easily find the right one for your upcoming presentation. You can use our Marketing Performance Dashboard With Advertisement Stages To Develop Demand Generation Tactics Themes PDF to effectively convey your message to a wider audience. Slidegeeks has done a lot of research before preparing these presentation templates. The content can be personalized and the slides are highly editable. Grab templates today from Slidegeeks.


The slide caters project development for an application. The purpose of the dashboard is to portray data driven metrics, and insights that are specific to a project in order to benefit the projects performance. It includes project launch date, activities to be completed, upcoming deadlines, workload distribution etc. Showcasing this set of slides titled Product Development Dashboard For High Level Project Strategy Microsoft PDF. The topics addressed in these templates are Upcoming Deadlines, Project Launch, Upcoming Deadlines. All the content presented in this PPT design is completely editable. Download it and make adjustments in color, background, font etc. as per your unique business setting.


This slide depicts the dashboard for DApp development based on the portfolio performance, recent activities, assets, deposits, and so on. Take your projects to the next level with our ultimate collection of Decentralization App Development Dashboard For Dapp Development Slides PDF. Slidegeeks has designed a range of layouts that are perfect for representing task or activity duration, keeping track of all your deadlines at a glance. Tailor these designs to your exact needs and give them a truly corporate look with your own brand colors they will make your projects stand out from the rest.


This slide represents the team management dashboard in agile by covering the details of total resources, overall task completion rate, features closed, and bugs closed.Welcome to our selection of the Team Management Dashboard In Agile Software Development Approaches Themes PDF. These are designed to help you showcase your creativity and bring your sphere to life. Planning and Innovation are essential for any business that is just starting out. This collection contains the designs that you need for your everyday presentations. All of our PowerPoints are 100 precent editable, so you can customize them to suit your needs. This multi-purpose template can be used in various situations. Grab these presentation templates today.
This slide represents metric dashboard to track sales performance on e-commerce website. It cover performance indicators such as sales breakdown, order breakdown, recurring sales etc.Do you have to make sure that everyone on your team knows about any specific topic I yes, then you should give B2b Sales Performance Tracking Dashboard Comprehensive Guide For Developing Topics PDF a try. Our experts have put a lot of knowledge and effort into creating this impeccable B2b Sales Performance Tracking Dashboard Comprehensive Guide For Developing Topics PDF. You can use this template for your upcoming presentations, as the slides are perfect to represent even the tiniest detail. You can download these templates from the Slidegeeks website and these are easy to edit. So grab these today.

This slide represents metric dashboard to track and analyze b2b ecommerce website performance. It covers total user visits, sales, average return per user etc.Find a pre-designed and impeccable B2b Ecommerce Dashboard To Track Website Performance Comprehensive Guide For Developing Sample PDF. The templates can ace your presentation without additional effort. You can download these easy-to-edit presentation templates to make your presentation stand out from others. So, what are you waiting for Download the template from Slidegeeks today and give a unique touch to your presentation.


This slide showcases dashboard that can help organization to identify open positions in organization after conducting recruitment and offer acceptance ratio of candidates. It also showcases various other components which are shorlisted candidates, hired candidates, time to hire, cost to hire, applications details. From laying roadmaps to briefing everything in detail, our templates are perfect for you. You can set the stage with your presentation slides. All you have to do is download these easy-to-edit and customizable templates. Developing Recruitment Dashboard To Identify Open Positions And Offer Acceptance Ratio Designs PDF will help you deliver an outstanding performance that everyone would remember and praise you for. Do download this presentation today.


This slide showcases dashboard that can help organization to evaluate average days taken to hire a candidate and major sources of application. It also showcases various other components which are open positions, candidates place, avg commission rate, reasons for candidate and client decline. Get a simple yet stunning designed Developing Recruitment Dashboard To Analyze Application Sources And Days To Hire Clipart PDF. It is the best one to establish the tone in your meetings. It is an excellent way to make your presentations highly effective. So, download this PPT today from Slidegeeks and see the positive impacts. Our easy-to-edit Developing Recruitment Dashboard To Analyze Application Sources And Days To Hire Clipart PDF can be your go-to option for all upcoming conferences and meetings. So, what are you waiting for Grab this template today.


This slide represents the dashboard of product development roadmap. It include product launches, financials and key resources. Showcasing this set of slides titled Product Development Plan Dashboard With Key Resources Summary PDF. The topics addressed in these templates are Product Launches, 2023 Financials, Key Resources. All the content presented in this PPT design is completely editable. Download it and make adjustments in color, background, font etc. as per your unique business setting.


This graph or chart is linked to excel, and changes automatically based on data. Just left click on it and select Edit Data. Do you have an important presentation coming up Are you looking for something that will make your presentation stand out from the rest Look no further than Developing Appealing Persona Customer Satisfaction Kpi Dashboard Microsoft PDF. With our professional designs, you can trust that your presentation will pop and make delivering it a smooth process. And with Slidegeeks, you can trust that your presentation will be unique and memorable. So why wait Grab Developing Appealing Persona Customer Satisfaction Kpi Dashboard Microsoft PDF today and make your presentation stand out from the rest


This slide represents the dashboard showing software development project issues faced by the clients for the purpose of its monitoring and controlling by the IT department. It shows downtime issues, count and percentage of unsolved tickets etc. related to the project.Showcasing this set of slides titled Software Development Project Issues Performance Monitoring Dashboard Structure PDF. The topics addressed in these templates are Downtime Issues, Count Percentage, Unsolved Percentage. All the content presented in this PPT design is completely editable. Download it and make adjustments in color, background, font etc. as per your unique business setting.


This slide represents the dashboard showing the operational analysis of the software development project undertaken by the IT team. It shows details related to overall progress, planning, design, development, testing, risks, budget, overdue tasks etc. related to the project.Pitch your topic with ease and precision using this IT Software Development Project Operations Analysis Dashboard Pictures PDF. This layout presents information on Interactive Dashboard, Currently Over Target, Overdue Task. It is also available for immediate download and adjustment. So, changes can be made in the color, design, graphics or any other component to create a unique layout.

This slide covers product engineering and development KPI dashboard to improve effectiveness. It involves data such as product development team, average result area scores and key result areas. Showcasing this set of slides titled Product Engineering Performance And Development Metrics Dashboard Topics PDF. The topics addressed in these templates are Product Development Team, Average, Cost. All the content presented in this PPT design is completely editable. Download it and make adjustments in color, background, font etc. as per your unique business setting.


This slide shows learning and development dashboard to plan and track and training program. It includes metrics such as absent employees, partial attendance, invites sent, trained departments etc. Showcasing this set of slides titled Learning And Development Program Planning Analysis Dashboard Information PDF. The topics addressed in these templates are Partial Attendance, Trained YTD, Unique Trained YTD. All the content presented in this PPT design is completely editable. Download it and make adjustments in color, background, font etc. as per your unique business setting.


This slide shows dashboard of employees trained in different locations for learning and development activity. It includes elements such as total invited, total trained, unique trained, total active employees, total programs etc. Pitch your topic with ease and precision using this Learning And Development Metrics Overview Analysis Dashboard Graphics PDF. This layout presents information on Unique Trained YTD, Training Man Days, Total Programs. It is also available for immediate download and adjustment. So, changes can be made in the color, design, graphics or any other component to create a unique layout.
This slide represents product development and management dashboard. It covers project hours, hours spent on project tasks, to do list etc. Slidegeeks has constructed Strategies For Effective Product Product Development And Management Dashboard Icons PDF after conducting extensive research and examination. These presentation templates are constantly being generated and modified based on user preferences and critiques from editors. Here, you will find the most attractive templates for a range of purposes while taking into account ratings and remarks from users regarding the content. This is an excellent jumping-off point to explore our content and will give new users an insight into our top-notch PowerPoint Templates.
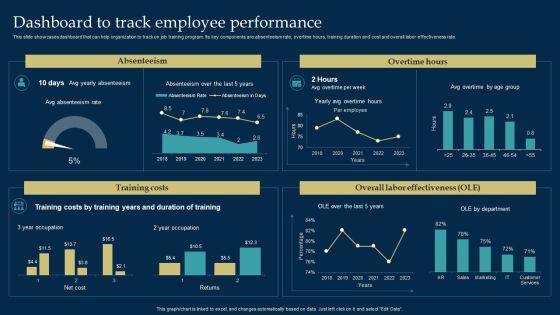

This slide showcases dashboard that can help organization to track on job training program. Its key components are absenteeism rate, overtime hours, training duration and cost and overall labor effectiveness rate. Take your projects to the next level with our ultimate collection of Employee Training And Development Strategy Dashboard To Track Employee Performance Slides PDF. Slidegeeks has designed a range of layouts that are perfect for representing task or activity duration, keeping track of all your deadlines at a glance. Tailor these designs to your exact needs and give them a truly corporate look with your own brand colors they will make your projects stand out from the rest.


This slide showcases dashboard that can help organization to evaluate the training program implemented in organization. Its key components are training cost, number of participants, hours of training, cost per participant and occupancy rate. This Employee Training And Development Strategy Dashboard For Training Program Evaluation Mockup PDF from Slidegeeks makes it easy to present information on your topic with precision. It provides customization options, so you can make changes to the colors, design, graphics, or any other component to create a unique layout. It is also available for immediate download, so you can begin using it right away. Slidegeeks has done good research to ensure that you have everything you need to make your presentation stand out. Make a name out there for a brilliant performance.


This slide shows the dashboard to measure business financial performance which focuses on revenues, debt to equity, net profit margin, gross profit margin and return on equity. Coming up with a presentation necessitates that the majority of the effort goes into the content and the message you intend to convey. The visuals of a PowerPoint presentation can only be effective if it supplements and supports the story that is being told. Keeping this in mind our experts created BPR To Develop Operational Effectiveness Dashboard To Measure Business Financial Performance Elements PDF to reduce the time that goes into designing the presentation. This way, you can concentrate on the message while our designers take care of providing you with the right template for the situation.


This slide focuses on dashboard to determine sales profits and conversions that also includes revenues, profits, number of orders placed, total customers, procured items that will help company to measure the overall business performance. Formulating a presentation can take up a lot of effort and time, so the content and message should always be the primary focus. The visuals of the PowerPoint can enhance the presenters message, so our BPR To Develop Operational Effectiveness Dashboard To Determine Sales Profit And Conversions Slides PDF was created to help save time. Instead of worrying about the design, the presenter can concentrate on the message while our designers work on creating the ideal templates for whatever situation is needed. Slidegeeks has experts for everything from amazing designs to valuable content, we have put everything into BPR To Develop Operational Effectiveness Dashboard To Determine Sales Profit And Conversions Slides PDF.
SHOW
- 60
- 120
- 180
DISPLAYING: 60 of 355 Item(s)
Page