 AI PPT Maker
 Templates
 PPT Bundles
 Design Services
 Business PPTs
 Business Plan
 Management
 Strategy
 Introduction PPT
 Roadmap
 Self Introduction
 Timelines
 Process
 Marketing
 Agenda
 Technology
 Medical
 Startup Business Plan
 Cyber Security
 Dashboards
 SWOT
SWOT Proposals
 Education
 Pitch Deck
 Digital Marketing
 KPIs
KPIs Project Management
 Product Management
 Artificial Intelligence
 Target Market
 Communication
 Supply Chain
 Google Slides
 Research Services
 One Pagers
 All Categories
Determine average PowerPoint Presentation Templates and Google Slides
11 Item(s)


Following slide displays informational stats about employee headcount and average tenure. It also includes a graph that shows stats about hiring and turnover rate. Slidegeeks is here to make your presentations a breeze with Talent Administration And Succession Determining Employee Headcount Average Tenure Inspiration PDF With our easy-to-use and customizable templates, you can focus on delivering your ideas rather than worrying about formatting. With a variety of designs to choose from, youre sure to find one that suits your needs. And with animations and unique photos, illustrations, and fonts, you can make your presentation pop. So whether youre giving a sales pitch or presenting to the board, make sure to check out Slidegeeks first.


Slidegeeks is one of the best resources for PowerPoint templates. You can download easily and regulate Determining Employee Headcount Average Tenure And Turnover Rate Graphics PDF for your personal presentations from our wonderful collection. A few clicks is all it takes to discover and get the most relevant and appropriate templates. Use our Templates to add a unique zing and appeal to your presentation and meetings. All the slides are easy to edit and you can use them even for advertisement purposes.
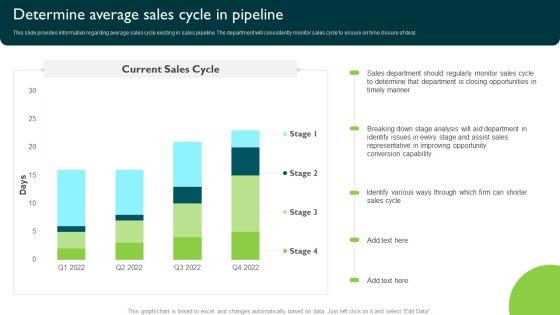

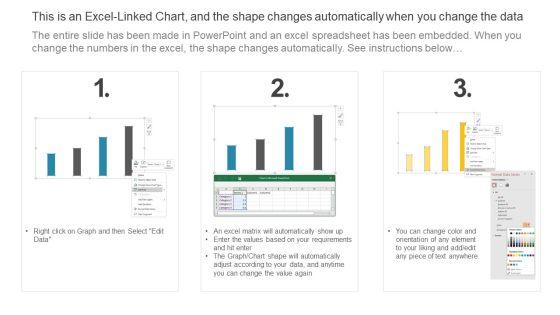
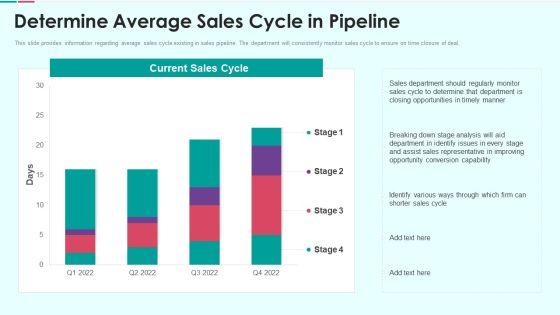
This slide provides information regarding average sales cycle existing in sales pipeline. The department will consistently monitor sales cycle to ensure on time closure of deal. Do you know about Slidesgeeks Determine Average Sales Cycle In Pipeline Managing Sales Pipeline Health Microsoft PDF These are perfect for delivering any kind od presentation. Using it, create PowerPoint presentations that communicate your ideas and engage audiences. Save time and effort by using our pre-designed presentation templates that are perfect for a wide range of topic. Our vast selection of designs covers a range of styles, from creative to business, and are all highly customizable and easy to edit. Download as a PowerPoint template or use them as Google Slides themes.


Following slide displays informational stats about employee headcount and average tenure. It also includes a graph that shows stats about hiring and turnover rate. Present like a pro with Internal Employee Succession Determining Employee Headcount Average Tenure Inspiration PDF Create beautiful presentations together with your team, using our easy-to-use presentation slides. Share your ideas in real-time and make changes on the fly by downloading our templates. So whether youre in the office, on the go, or in a remote location, you can stay in sync with your team and present your ideas with confidence. With Slidegeeks presentation got a whole lot easier. Grab these presentations today.

Following slide displays informational stats about employee headcount and average tenure. It also includes a graph that shows stats about hiring and turnover rate. Present like a pro with Implementing Succession Planning Determining Employee Headcount Average Tenure Template PDF Create beautiful presentations together with your team, using our easy-to-use presentation slides. Share your ideas in real-time and make changes on the fly by downloading our templates. So whether youre in the office, on the go, or in a remote location, you can stay in sync with your team and present your ideas with confidence. With Slidegeeks presentation got a whole lot easier. Grab these presentations today.


This slide provides information regarding average sales cycle existing in sales pipeline. The department will consistently monitor sales cycle to ensure on time closure of deal. Present like a pro with CRM Pipeline Administration Determine Average Sales Cycle In Pipeline Ppt Slides Skills PDF Create beautiful presentations together with your team, using our easy-to-use presentation slides. Share your ideas in real-time and make changes on the fly by downloading our templates. So whether youre in the office, on the go, or in a remote location, you can stay in sync with your team and present your ideas with confidence. With Slidegeeks presentation got a whole lot easier. Grab these presentations today.


Following slide displays informational stats about employee headcount and average tenure. It also includes a graph that shows stats about hiring and turnover rate.Get a simple yet stunning designed Staff Succession Planning And Development Determining Employee Headcount Average Elements PDF. It is the best one to establish the tone in your meetings. It is an excellent way to make your presentations highly effective. So, download this PPT today from Slidegeeks and see the positive impacts. Our easy-to-edit Staff Succession Planning And Development Determining Employee Headcount Average Elements PDF can be your go-to option for all upcoming conferences and meetings. So, what are you waiting for Grab this template today.

This slide provides information regarding average sales cycle existing in sales pipeline. The department will consistently monitor sales cycle to ensure on time closure of deal.Deliver an awe inspiring pitch with this creative Determine Average Sales Cycle In Pipeline Improving Distribution Channel Microsoft PDF bundle. Topics like Conversion Capability, Representative Improving, Closing Opportunities can be discussed with this completely editable template. It is available for immediate download depending on the needs and requirements of the user.
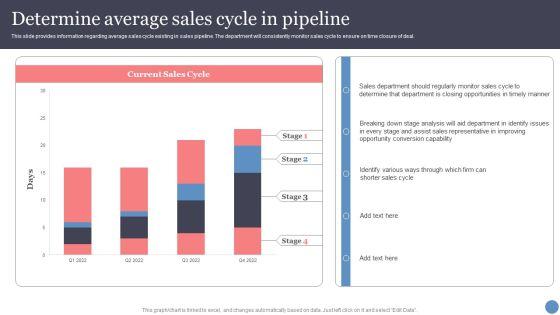
This slide provides information regarding average sales cycle existing in sales pipeline. The department will consistently monitor sales cycle to ensure on time closure of deal. Deliver and pitch your topic in the best possible manner with this Determine Average Sales Cycle In Pipeline Information PDF. Use them to share invaluable insights on Opportunity Conversion Capability, Sales Department, Sales Cycle and impress your audience. This template can be altered and modified as per your expectations. So, grab it now.


This slide provides information regarding workforce training program effectiveness evaluated by assessing training program expectation, etc. Deliver and pitch your topic in the best possible manner with this sales training playbook determine workforce training program effectiveness average diagrams pdf. Use them to share invaluable insights on determine, program, required, material and impress your audience. This template can be altered and modified as per your expectations. So, grab it now.
This slide provides information regarding average sales cycle existing in sales pipeline. The department will consistently monitor sales cycle to ensure on time closure of deal.Deliver an awe inspiring pitch with this creative sales funnel management for revenue generation determine average sales cycle in pipeline slides pdf bundle. Topics like opportunity conversion capability, representative in improving, department in identify can be discussed with this completely editable template. It is available for immediate download depending on the needs and requirements of the user.
11 Item(s)