- Sign up
- Sign In
 AI PPT Maker
 Templates
 PPT Bundles
 Design Services
 Business PPTs
 Business Plan
 Management
 Strategy
 Introduction PPT
 Roadmap
 Self Introduction
 Timelines
 Process
 Marketing
 Agenda
 Technology
 Medical
 Startup Business Plan
 Cyber Security
 Dashboards
 SWOT
SWOT Proposals
 Education
 Pitch Deck
 Digital Marketing
 KPIs
KPIs Project Management
 Product Management
 Artificial Intelligence
 Target Market
 Communication
 Supply Chain
 Google Slides
 Research Services
 One Pagers
 All Categories
Declining graph PowerPoint Presentation Templates and Google Slides
22 Item(s)


Improve your presentation delivery using this Declining Graph Ppt PowerPoint Presentation Complete Deck With Slides. Support your business vision and objectives using this well-structured PPT deck. This template offers a great starting point for delivering beautifully designed presentations on the topic of your choice. Comprising Weight twelve this professionally designed template is all you need to host discussion and meetings with collaborators. Each slide is self-explanatory and equipped with high-quality graphics that can be adjusted to your needs. Therefore, you will face no difficulty in portraying your desired content using this PPT slideshow. This PowerPoint slideshow contains every important element that you need for a great pitch. It is not only editable but also available for immediate download and utilization. The color, font size, background, shapes everything can be modified to create your unique presentation layout. Therefore, download it now.


We present our Illustration Of Declining Business Graph PowerPoint Templates PPT Backgrounds For Slides 0413.Download our Business PowerPoint Templates because Our PowerPoint Templates and Slides will weave a web of your great ideas. They are gauranteed to attract even the most critical of your colleagues. Download and present our Marketing PowerPoint Templates because Our PowerPoint Templates and Slides are like the strings of a tennis racquet. Well strung to help you serve aces. Download our Success PowerPoint Templates because Our PowerPoint Templates and Slides are conceived by a dedicated team. Use them and give form to your wondrous ideas. Present our Arrows PowerPoint Templates because Our PowerPoint Templates and Slides will Embellish your thoughts. They will help you illustrate the brilliance of your ideas. Present our Process and Flows PowerPoint Templates because Our PowerPoint Templates and Slides are designed to help you succeed. They have all the ingredients you need.Use these PowerPoint slides for presentations relating to Business chart graph showing the decline, business, marketing, success, arrows, process and flows. The prominent colors used in the PowerPoint template are Red, Black, Yellow. Guard against boring presentations with our Illustration Of Declining Business Graph PowerPoint Templates Ppt Backgrounds For Slides 0413. Try us out and see what a difference our templates make.


We present our Dollar Growth And Decline Bar Graph PowerPoint Templates PPT Backgrounds For Slides 0413.Download our Arrows PowerPoint Templates because You are working at that stage with an air of royalty. Let our PowerPoint Templates and Slides be the jewels in your crown. Use our Business PowerPoint Templates because It can Leverage your style with our PowerPoint Templates and Slides. Charm your audience with your ability. Present our Success PowerPoint Templates because You should Kick up a storm with our PowerPoint Templates and Slides. The heads of your listeners will swirl with your ideas. Present our Shapes PowerPoint Templates because Our PowerPoint Templates and Slides will Embellish your thoughts. They will help you illustrate the brilliance of your ideas. Download our Marketing PowerPoint Templates because It can be used to Set your controls for the heart of the sun. Our PowerPoint Templates and Slides will be the propellant to get you there.Use these PowerPoint slides for presentations relating to Bar graph arrow growth, arrows, business, success, shapes, marketing. The prominent colors used in the PowerPoint template are Pink, Green, Yellow. Display your class with our Dollar Growth And Decline Bar Graph PowerPoint Templates Ppt Backgrounds For Slides 0413. Demonstrate your expertise to your audience.


This slide represents challenges faced by credit card companies i.e., decline in customer acquisition rate. It covers reasons such as increase in market competition, customer dissatisfaction etc. Are you in need of a template that can accommodate all of your creative concepts This one is crafted professionally and can be altered to fit any style. Use it with Google Slides or PowerPoint. Include striking photographs, symbols, depictions, and other visuals. Fill, move around, or remove text boxes as desired. Test out color palettes and font mixtures. Edit and save your work, or work with colleagues. Download Implementation Of An Efficient Credit Card Promotion Plan Graph Showcasing Decline In Customer Themes PDF and observe how to make your presentation outstanding. Give an impeccable presentation to your group and make your presentation unforgettable.


This slide showcases customer journey map to understand their needs. The stages covered are awareness, consideration, decision, delivery, and loyalty. Retrieve professionally designed Service Improvement Techniques For Client Retention Issue 3 Declining Customer Retention Rate Graphics PDF to effectively convey your message and captivate your listeners. Save time by selecting pre made slideshows that are appropriate for various topics, from business to educational purposes. These themes come in many different styles, from creative to corporate, and all of them are easily adjustable and can be edited quickly. Access them as PowerPoint templates or as Google Slides themes. You don not have to go on a hunt for the perfect presentation because Slidegeeks got you covered from everywhere.


This slide shows the multiple companies capital that is invested by them in the market for making profits and advancing the technologies. It shows the decline of their capital amount in the following month. Pitch your topic with ease and precision using this Technology Companies Market Cap Declining Graph Ppt PowerPoint Presentation File Smartart PDF. This layout presents information on Overall Decline, Companies Low, Incurred Mor. It is also available for immediate download and adjustment. So, changes can be made in the color, design, graphics or any other component to create a unique layout.


This chart shows how the production of the manufacturing plan is declining in every quarter because of some critical reasons and how it is effecting the companys growth and goodwill. Showcasing this set of slides titled Quarterly Declining Graph Of A Manufacturing Plant Ppt PowerPoint Presentation File Example Topics PDF. The topics addressed in these templates are Production Declined, Lack Of Technology, Unskilled Laborers. All the content presented in this PPT design is completely editable. Download it and make adjustments in color, background, font etc. as per your unique business setting.


This slide covers the information related to the share price and organic page reach of an organization to check the position of its working and to have records of them.Pitch your topic with ease and precision using this Organic Page Reach Declining Graph With Stock Prices Ppt PowerPoint Presentation Ideas Styles PDF. This layout presents information on Increasing High, Reach Declining, Supply Market. It is also available for immediate download and adjustment. So, changes can be made in the color, design, graphics or any other component to create a unique layout.


This slide covers the data of corona virus patients around the world to know the status of patients and the recovery rate. It also shows the monthly cases of COVID 19 that are declining day by day form the past few months.Showcasing this set of slides titled Monthly COVID Cases Declining Graph Ppt PowerPoint Presentation Ideas Slide Portrait PDF. The topics addressed in these templates are Monthly Covid Cases, Declining Graph. All the content presented in this PPT design is completely editable. Download it and make adjustments in color, background, font etc. as per your unique business setting.
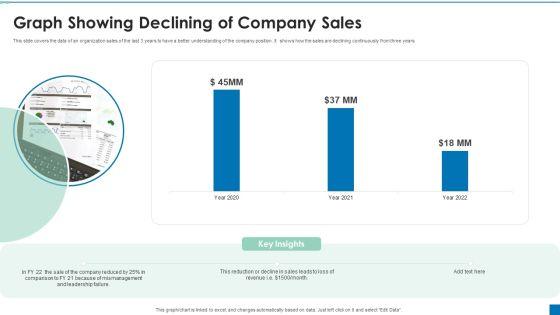

This slide covers the data of an organization sales of the last 3 years to have a better understanding of the company position. It shows how the sales are declining continuously from three years.Pitch your topic with ease and precision using this Graph Showing Declining Of Company Sales Ppt PowerPoint Presentation Portfolio Graphics Example PDF. This layout presents information on Reduction Decline, Comparison, Mismanagement. It is also available for immediate download and adjustment. So, changes can be made in the color, design, graphics or any other component to create a unique layout.


This slide elaborates about the real GDP growth rate that is declining form a certain period of time till date. It also includes the reasons of this decline to take some measures for overcoming from this situation. Showcasing this set of slides titled GDP Growth Rate Declining Trend Graph Ppt PowerPoint Presentation Slides Professional PDF. The topics addressed in these templates are Declining Continuously, Poorly Designed, Reasons Demonetization. All the content presented in this PPT design is completely editable. Download it and make adjustments in color, background, font etc. as per your unique business setting.


This slide contains the information related to the number of numbers that are shifting form in-store purchasing to online shopping because of some factors. Pitch your topic with ease and precision using this Customers Declining Graph In Offline Store Ppt PowerPoint Presentation Professional Clipart PDF. This layout presents information on Customers Choosing, Store Purchase, Time Saving. It is also available for immediate download and adjustment. So, changes can be made in the color, design, graphics or any other component to create a unique layout.


This slide shows the revenues of the company over the last years to have a clear idea of organization growth and financial status . It includes the 6 year 2017 to 2022 revenue earned by the company.Showcasing this set of slides titled 6 Year Revenue Declining Graph Ppt PowerPoint Presentation Outline Sample PDF. The topics addressed in these templates are Revenue Company, Highest Comparison, Conditions Restrictions. All the content presented in this PPT design is completely editable. Download it and make adjustments in color, background, font etc. as per your unique business setting.


The slide shows the key strong points of the company which provides it an edge of the peers. Major Strengths includes strong global presence, strong market share, more focus on innovation etc. Presenting declining of a motor vehicle company swot analysis weaknesses graphics pdf to provide visual cues and insights. Share and navigate important information on three stages that need your due attention. This template can be used to pitch topics like vehicle recalls, decline in cash and cash equivalent. In addtion, this PPT design contains high resolution images, graphics, etc, that are easily editable and available for immediate download.


Deliver an awe-inspiring pitch with this creative case study declining customer retention rate in online industry table of contents graphics pdf bundle. Topics like customer retention rate, strategy implementation, dashboard, analysis, implementation costs can be discussed with this completely editable template. It is available for immediate download depending on the needs and requirements of the user.


Showcasing this set of slides titled downturn graph indicating business share value decline ppt powerpoint presentation professional elements pdf. The topics addressed in these templates are per share value, 2016 to 2020. All the content presented in this PPT design is completely editable. Download it and make adjustments in color, background, font etc. as per your unique business setting.


Presenting Industry Decline And Recession Graph Icon Ideas PDF to dispense important information. This template comprises three stages. It also presents valuable insights into the topics including Industry Decline, Recession Graph Icon. This is a completely customizable PowerPoint theme that can be put to use immediately. So, download it and address the topic impactfully.


This slide covers analysis of the companys diminishing supply chain and logistics performance. It include KPIs such as on-time shipping, on-time delivery, average cycle time, freight bill accuracy, etc. If your project calls for a presentation, then Slidegeeks is your go-to partner because we have professionally designed, easy-to-edit templates that are perfect for any presentation. After downloading, you can easily edit Integrating AI To Enhance Declining Performance Of Companys Supply Chain And Logistics Graphics PDF and make the changes accordingly. You can rearrange slides or fill them with different images. Check out all the handy templates.


Pitch your topic with ease and precision using this Enterprise Declining Graph Icon With Arrow Ppt PowerPoint Presentation File Good PDF. This layout presents information on Enterprise Declining, Graph Icon Arrow. It is also available for immediate download and adjustment. So, changes can be made in the color, design, graphics or any other component to create a unique layout.


Showcasing this set of slides titled Enterprise Declining Graph Icon With Arrow Slide Ppt PowerPoint Presentation Portfolio Designs Download PDF. The topics addressed in these templates are Enterprise Declining, Graph Icon Arrow. All the content presented in this PPT design is completely editable. Download it and make adjustments in color, background, font etc. as per your unique business setting.


The following slide outlines tabular representation of email marketing campaign results. Total emails sent, open rate, click-through rate CTR, conversion rate, and bounce rate are the major key performance indicators KPIs which are mentioned in the slide. Create an editable Declining Performance Of Email Marketing Campaign Ppt Summary Graphic Images PDF that communicates your idea and engages your audience. Whether you are presenting a business or an educational presentation, pre designed presentation templates help save time. Declining Performance Of Email Marketing Campaign Ppt Summary Graphic Images PDF is highly customizable and very easy to edit, covering many different styles from creative to business presentations. Slidegeeks has creative team members who have crafted amazing templates. So, go and get them without any delay.
22 Item(s)