 AI PPT Maker
 Templates
 PPT Bundles
 Design Services
 Business PPTs
 Business Plan
 Management
 Strategy
 Introduction PPT
 Roadmap
 Self Introduction
 Timelines
 Process
 Marketing
 Agenda
 Technology
 Medical
 Startup Business Plan
 Cyber Security
 Dashboards
 SWOT
SWOT Proposals
 Education
 Pitch Deck
 Digital Marketing
 KPIs
KPIs Project Management
 Product Management
 Artificial Intelligence
 Target Market
 Communication
 Supply Chain
 Google Slides
 Research Services
 One Pagers
 All Categories
Data representation PowerPoint Presentation Templates and Google Slides
SHOW
- 60
- 120
- 180
DISPLAYING: 60 of 126 Item(s)
Page


Create winning presentations effortlessly with our Data Representation Playbook Template. Designed to impress, each template is 100 percent editable, visually-stunning, and easy-to-use. Our team of researchers has meticulously crafted the right content for each template, so you do not have to worry about anything. Just select the perfect template for your project, personalize it, and deliver a memorable presentation that leaves a lasting impact.
Presenting this set of slides with name data representation vector icon ppt powerpoint presentation infographic template samples. This is a one stage process. The stages in this process are data visualization icon, research analysis, business focus. This is a completely editable PowerPoint presentation and is available for immediate download. Download now and impress your audience.


Presenting this set of slides with name structured and unstructured data representation ppt powerpoint presentation styles gridlines. This is a four stage process. The stages in this process are data sources, database management, marketing. This is a completely editable PowerPoint presentation and is available for immediate download. Download now and impress your audience.
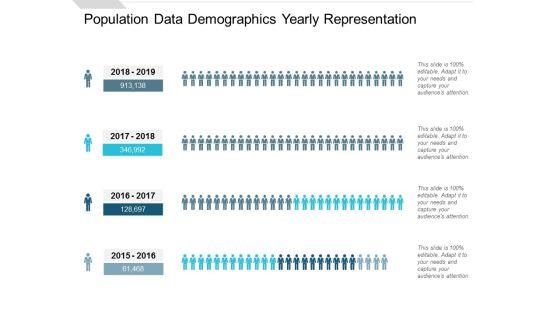


Presenting this set of slides with name population data demographics yearly representation ppt powerpoint presentation ideas layout. This is a four stage process. The stages in this process are people graph, sales performance, population data demographics. This is a completely editable PowerPoint presentation and is available for immediate download. Download now and impress your audience.
Presenting this set of slides with name visual representation of data ppt powerpoint presentation icon sample. This is a one stage process. The stages in this process are data visualization icon, research analysis, business focus. This is a completely editable PowerPoint presentation and is available for immediate download. Download now and impress your audience.


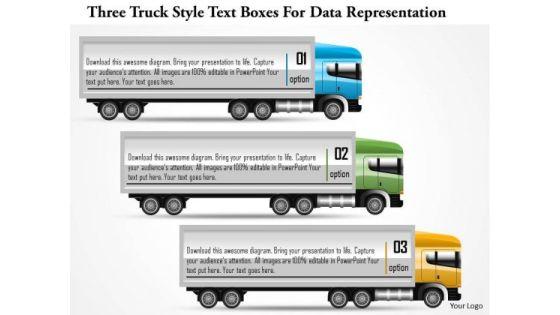


This business slide displays four banner style text boxes It contains graphic of text boxes with four steps. Use this diagram, in your presentations to express views on process, steps, stages, progress, targets, goals, success and achievements. Give professional appearance to your presentations using this business slide.


SHOW
- 60
- 120
- 180
DISPLAYING: 60 of 126 Item(s)
Page