AI PPT Maker
Templates
PPT Bundles
Design Services
Business PPTs
Business Plan
Management
Strategy
Introduction PPT
Roadmap
Self Introduction
Timelines
Process
Marketing
Agenda
Technology
Medical
Startup Business Plan
Cyber Security
Dashboards
SWOT
Proposals
Education
Pitch Deck
Digital Marketing
KPIs
Project Management
Product Management
Artificial Intelligence
Target Market
Communication
Supply Chain
Google Slides
Research Services
One Pagers
All Categories
Data For Analysis PowerPoint Presentation Templates and Google Slides
SHOW
- 60
- 120
- 180
DISPLAYING: 60 of 388 Item(s)
Page


Slide 1 of 36
Here is a predesigned Proposal For Data Analysis In Research Project Example Document Report Doc Pdf Ppt for you. Built on extensive research and analysis, this one-complete deck has all the center pieces of your specific requirements. This temple exudes brilliance and professionalism. Being completely editable, you can make changes to suit your purpose. Get this Proposal For Data Analysis In Research Project Example Document Report Doc Pdf Ppt A4 One-pager now.


Slide 1 of 24
Heres a predesigned Proposal For Data Analysis Project Example Document Report Doc Pdf Ppt for you. Built on extensive research and analysis, this one-complete deck has all the center pieces of your specific requirements. This temple exudes brilliance and professionalism. Being completely editable, you can make changes to suit your purpose. Get this Proposal For Data Analysis Project Example Document Report Doc Pdf Ppt A4 One-pager now.


Slide 1 of 7
This is a qualitative data for analysis diagram ppt example file. This is a four stage process. The stages in this process are coding your data, summarizing your data, finding themes, patterns, and relationships, developing your codes.


Slide 1 of 7
This is a pure data for analysis powerpoint slide clipart. This is a four stage process. The stages in this process are pure data for analysis, data repositories, production available, packing list.


Slide 1 of 7
This is a speed analysis for big data ppt powerpoint themes. This is a four stage process. The stages in this process are volume, velocity, variety, value.


Slide 1 of 7
This is a sources for healthcare data analysis ppt slides. This is a eight stage process. The stages in this process are social media, drug research, patient records, home monitoring, gene sequencing, mobile apps, claims, test results.


Slide 1 of 7
This is a big data insight for time spent analysis over internet diagram slides. This is a one stage process. The stages in this process are social networking, online shopping, multimedia sites, searches, reading content, emails communication.


Slide 1 of 7
This is a information sources for big data analysis diagram ppt slides. This is a three stage process. The stages in this process are big data, value, volume, velocity, variety, information sources.


Slide 1 of 7
This is a big data insight for time spent analysis over internet diagram ppt slides. This is a ten stage process. The stages in this process are learning, public services, banking and finance, energy, mobility, health, retail, communication and media, web services, self measurement.


Slide 1 of 7
This is a top analytics bi tools for data analysis ppt slides. This is a eight stage process. The stages in this process are digital dashboards, olap, reporting and querying, spreadsheets, decision engineering, process mining, business performance management, local information systems.


Slide 1 of 7
This is a big data cycle for analysis diagram slides. This is a five stage process. The stages in this process are massive data, new management needs, new final result, new hard and software, new analysis possibilities.


Slide 1 of 6
This is a data analysis for customer relationship management consulting ppt powerpoint presentation ideas templates. This is a one stage process. The stages in this process are employee performance review, job evaluation, customer 360.


Slide 1 of 6
This is a quantitative bar chart for data analysis ppt powerpoint presentation model graphic tips. This is a two stage process. The stages in this process are financial analysis, quantitative, statistical modelling.


Slide 1 of 6
This is a data chart for individual income analysis ppt powerpoint presentation layouts visual aids. This is a five stage process. The stages in this process are financial analysis, quantitative, statistical modelling.


Slide 1 of 6
This is a data analysis chart for funds management ppt powerpoint presentation infographic template files. This is a five stage process. The stages in this process are financial analysis, quantitative, statistical modelling.


Slide 1 of 6
This is a data research and analysis for mobile users ppt powerpoint presentation icon inspiration. This is a four stage process. The stages in this process are mobile analytics, mobile tracking, mobile web analytics.


Slide 1 of 6
This is a eight sections pie chart for percentage data analysis ppt powerpoint presentation styles icons. This is a eight stage process. The stages in this process are 6 piece pie chart, 6 segment pie chart, 6 parts pie chart.


Slide 1 of 5
Presenting this set of slides with name project context for financial services data analysis ppt powerpoint presentation professional guidelines. This is a two stage process. The stages in this process are agenda, target audiences, preferred by many, values client, strategy. This is a completely editable PowerPoint presentation and is available for immediate download. Download now and impress your audience.


Slide 1 of 5
Statistical Tools For Data Analysis And Interpretation Ppt PowerPoint Presentation Portfolio Visuals
Presenting this set of slides with name Statistical Tools For Data Analysis And Interpretation Ppt PowerPoint Presentation Portfolio Visuals. This is a six process. The stages in this process are marketing, management, measuring results. This is a completely editable PowerPoint presentation and is available for immediate download. Download now and impress your audience.


Slide 1 of 5
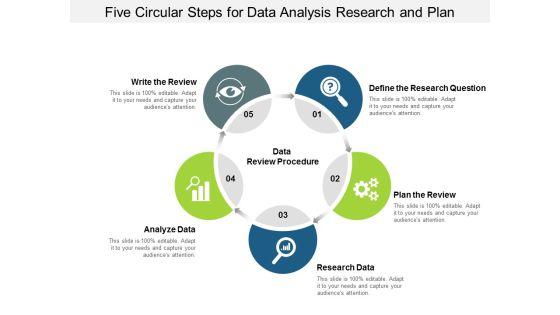
Presenting this set of slides with name five circular steps for data analysis research and plan ppt powerpoint presentation ideas slide portrait. This is a five stage process. The stages in this process are Data analysis, Data Review, Data Evaluation. This is a completely editable PowerPoint presentation and is available for immediate download. Download now and impress your audience.


Slide 1 of 5
This is a bar graph icon for data analysis ppt powerpoint presentation pictures ideas. This is a four stage process. The stages in this process are financial analysis, quantitative, statistical modelling.


Slide 1 of 5
This is a five circular steps for data analysis research and plan ppt powerpoint presentation outline show. This is a five stage process. The stages in this process are data analysis, data review, data evaluation.


Slide 1 of 5
This is a computer screen with pie chart for data analysis ppt powerpoint presentation show picture. This is a six stage process. The stages in this process are computer icon, desktop icon, laptop screen icon.


Slide 1 of 5
This is a mis for data analysis ppt powerpoint presentation pictures graphics download. This is a three stage process. The stages in this process are management information system, mis, decision making system.


Slide 1 of 5
This PowerPoint template has been designed with bar graph. This PowerPoint diagram is useful for data distribution and analysis This diagram slide can be used to make impressive presentations.


Slide 1 of 4
This PowerPoint template contains bar graph made of Lego blocks. You may use this slide to display growth process. This diagram provides an effective way of displaying information you can edit text, color, shade and style as per you need.


Slide 1 of 4
This PowerPoint contains four circles with percentage values. Download this diagram slide to display financial data analysis. This template is editable, You can edit text, color, shade and style of this diagram as per you need.


Slide 1 of 4
Our above slide contains graphics of five steps chart. This PowerPoint template is useful for data compare and analysis. Use this diagram to impart more clarity to subject and to create more sound impact on viewers.


Slide 1 of 4
This PowerPoint template has been designed sequential steps chart with icons. This PPT slide can be used to display corporate level financial strategy. You can download finance PowerPoint template to prepare awesome presentations.


Slide 1 of 4
Our above PPT slide contains graphics of ABC steps chart. This business diagram helps to depict business information for strategic management. Use this diagram to impart more clarity to data and to create more sound impact on viewers.


Slide 1 of 4
This PowerPoint slide contains diagram of arrows infographic. This professional slide helps to exhibit financial data analysis for business growth. Use this PowerPoint template to make impressive presentations.


Slide 1 of 3
Presenting you an exemplary Proposal For Data Analysis In Research Project Team Structure Of Data Analysis Company One Pager Sample Example Document. Our one-pager comprises all the must-have essentials of an inclusive document. You can edit it with ease, as its layout is completely editable. With such freedom, you can tweak its design and other elements to your requirements. Download this Proposal For Data Analysis In Research Project Team Structure Of Data Analysis Company One Pager Sample Example Document brilliant piece now.


Slide 1 of 3
Client Testimonials Proposal For Data Analysis In Research Project One Pager Sample Example Document
Presenting you an exemplary Client Testimonials Proposal For Data Analysis In Research Project One Pager Sample Example Document. Our one-pager comprises all the must-have essentials of an inclusive document. You can edit it with ease, as its layout is completely editable. With such freedom, you can tweak its design and other elements to your requirements. Download this Client Testimonials Proposal For Data Analysis In Research Project One Pager Sample Example Document brilliant piece now.


Slide 1 of 3
Presenting you an exemplary Our Team For Data Analysis Project Proposal One Pager Sample Example Document. Our one-pager comprises all the must-have essentials of an inclusive document. You can edit it with ease, as its layout is completely editable. With such freedom, you can tweak its design and other elements to your requirements. Download this Our Team For Data Analysis Project Proposal One Pager Sample Example Document brilliant piece now.


Slide 1 of 3
Infographic tags have been displayed in this business slide. This PowerPoint template helps to exhibit big data analysis. Use this diagram to build an exclusive presentation.


Slide 1 of 3
You can download this PowerPoint template to display statistical data and analysis. This PPT slide contains data driven comparison charts. Draw an innovative business idea using this professional diagram.


Slide 1 of 3
This is one of the most downloaded PowerPoint template. This slide can be used for various purposes and to explain a number of processes. This can be included in your presentation to explain each step of a process and even include its relevance and importance in a single diagram. Using the uneven circular structure of the pie chart, the presenter can also explain random steps or highlight particular steps of process or parts of an organization or business that need special attention of any kind to the audience. Additionally, you can use this slide to show a transformation process or highlight key features of a product.


Slide 1 of 3
This business slide has backdrop of chess game with six zigzag steps. You may download this slide for data analysis and strategy planning related topics. Illustrate your plans to your listeners with using this slide.


Slide 1 of 3
This PowerPoint slide has been designed with process infographic. This PPT diagram may be used to display evaluation of business process. This diagram slide can be used to make impressive presentations.


Slide 1 of 3
This PowerPoint slide has a theme for financial data analysis. This image has been designed to display concept of financial planning and analysis. Deliver amazing presentations to mesmerize your audience using this image


Slide 1 of 3
Our professionally designed business diagram is as an effective tool to display data analysis. It contains graphics of three arrow tags. This template is specifically created to highlight you points.


Slide 1 of 3
You can download this PowerPoint template for analysis of business data. It contains graphics of bulb with pencil. Draw an innovative business idea using t his diagram.


Slide 1 of 3
This business diagram displays three flasks. You may use this slide for data analysis. Make your mark with this unique slide. Create an impression that will endure.


Slide 1 of 3
This business diagram has been designed with graphics of slider. You may download this professional slide to display data trends. Transmit your thoughts via this slide.


Slide 1 of 3
Graphic of test tube with lock and headphone icons have been used to design this Power Point template. You may use this diagram for data analysis and research. Present your views using our innovative slide and be assured of leaving a lasting impression.


Slide 1 of 3
This slide has been designed with graphic of circular source diagram. This diagram contains the concept of data source sensors and feeds of database files. Download this editable slide to build an exclusive presentation for your viewers.


Slide 1 of 3
This diagram displays human face graphic with colored graph. This diagram can be used to represent strategy, planning, thinking of business plan. Display business options in your presentations by using this creative diagram.


Slide 1 of 3
This business diagram displays graphic of pie charts in shape of flasks. This business slide is suitable to present and compare business data. Use this diagram to build professional presentations for your viewers.


Slide 1 of 3
This business diagram displays graphic of pie charts in shape of magnifying glasses This business slide is suitable to present and compare business data. Use this diagram to build professional presentations for your viewers.


Slide 1 of 3
This business diagram displays graphic of pie charts. This business slide is suitable to present and compare business data. Use this diagram to build professional presentations for your viewers.


Slide 1 of 3
This PowerPoint template displays technology gadgets with various business charts. Use this diagram slide, in your presentations to make business reports for statistical analysis. You may use this diagram to impart professional appearance to your presentations.


Slide 1 of 3
This business slide displays pie chart. This diagram is a data visualization tool that gives you a simple way to present statistical information. This slide helps your audience examine and interpret the data you present.


Slide 1 of 3
This Power Point template has been designed with graphic of colored bar graph. Use this slide to represent five steps of any business process. Use this diagram for your business presentations and get exclusive comments on your efforts.


Slide 1 of 3
This business slide displays pie charts with percentage ratios. This diagram is a data visualization tool that gives you a simple way to present statistical information. This slide helps your audience examines and interprets the data you present.


Slide 1 of 3
This image slide has been designed with business graph with globe in background. This image slide represents topics like global business, economic growth. This image will enhance the quality of your presentations.


Slide 1 of 3
Our PPT Slide circular process for data analysis marketing plan Powerpoint Templates Deliver At Your Doorstep. Let Them In For A Wonderful Experience. Dig Out The Dope With Our Business Plan Powerpoint Templates. Your Thoughts Will Expose The Truth.


Slide 1 of 3
Reduce The Drag With Our quantitative data analysis bar chart for Powerpoint Templates . Give More Lift To Your Thoughts.


Slide 1 of 3
Draft It Out On Our quantitative data analysis bar chart for financial markets Powerpoint Templates . Give The Final Touches With Your Ideas.


Slide 1 of 3
Make Some Dough With Our quantitative data analysis bar chart for different categories Powerpoint Templates . Your Assets Will Rise Significantly.


Slide 1 of 3
Our quantitative data analysis 3d pie chart for business statistics Powerpoint Templates Allow You To Do It With Ease. Just Like Picking The Low Hanging Fruit.
SHOW
- 60
- 120
- 180
DISPLAYING: 60 of 388 Item(s)
Page