 AI PPT Maker
 Templates
 PPT Bundles
 Design Services
 Business PPTs
 Business Plan
 Management
 Strategy
 Introduction PPT
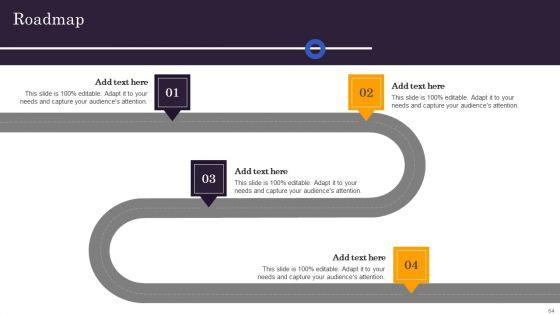
 Roadmap
 Self Introduction
 Timelines
 Process
 Marketing
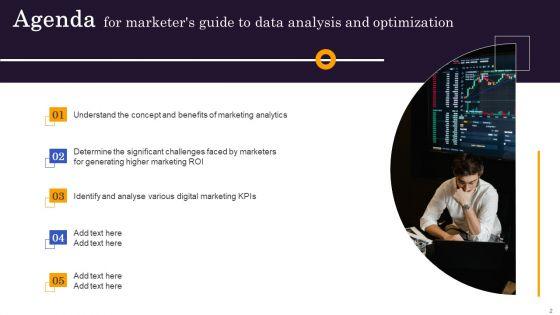
 Agenda
 Technology
 Medical
 Startup Business Plan
 Cyber Security
 Dashboards
 SWOT
SWOT Proposals
 Education
 Pitch Deck
 Digital Marketing
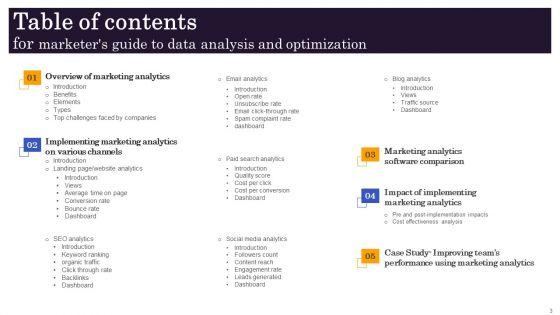
 KPIs
KPIs Project Management
 Product Management
 Artificial Intelligence
 Target Market
 Communication
 Supply Chain
 Google Slides
 Research Services
 One Pagers
 All Categories
Data analysis marketing PowerPoint Presentation Templates and Google Slides
SHOW
- 60
- 120
- 180
DISPLAYING: 60 of 152 Item(s)
Page


With well-researched insights and carefully constructed design, this Marketers Guide To Data Analysis And Optimization Ppt PowerPoint Presentation Complete Deck With Slides is all that you need for your next business meeting with clients and win them over. Add your data to graphs, charts, and tables that are already ready to display it with stunning visuals and help your audience recall your work. With this PPT Complete Deck, you will be able to display your knowledge of the subject as well as your skills as a communicator. Share your ideas and make an impact on the audience with this PowerPoint Layout and ensure that you are known as a presentation professional. Download this PPT Template Bundle to create the most interesting presentation anyone has ever seen.


Share a great deal of information on the topic by deploying this data analysis deployment marketing ppt powerpoint presentation complete deck. Support your ideas and thought process with this prefabricated set. It includes a set of twelve slides, all fully modifiable and editable. Each slide can be restructured and induced with the information and content of your choice. You can add or remove large content boxes as well, to make this PPT slideshow more personalized. Its high-quality graphics and visuals help in presenting a well-coordinated pitch. This PPT template is also a resourceful tool to take visual cues from and implement the best ideas to help your business grow and expand. The main attraction of this well-formulated deck is that everything is editable, giving you the freedom to adjust it to your liking and choice. Changes can be made in the background and theme as well to deliver an outstanding pitch. Therefore, click on the download button now to gain full access to this multifunctional set.


Share a great deal of information on the topic by deploying this data identification solutions analysis market ppt powerpoint presentation complete deck. Support your ideas and thought process with this prefabricated set. It includes a set of twelve slides, all fully modifiable and editable. Each slide can be restructured and induced with the information and content of your choice. You can add or remove large content boxes as well, to make this PPT slideshow more personalized. Its high-quality graphics and visuals help in presenting a well-coordinated pitch. This PPT template is also a resourceful tool to take visual cues from and implement the best ideas to help your business grow and expand. The main attraction of this well-formulated deck is that everything is editable, giving you the freedom to adjust it to your liking and choice. Changes can be made in the background and theme as well to deliver an outstanding pitch. Therefore, click on the download button now to gain full access to this multifunctional set.


Presenting this set of slides with name competition market share analysis edit data ppt powerpoint presentation ideas slide. The topics discussed in these slides are marketing, business, management, planning, strategy. This is a completely editable PowerPoint presentation and is available for immediate download. Download now and impress your audience.
Presenting this set of slides with name competition market share analysis edit data ppt powerpoint presentation icon graphics tutorials. The topics discussed in these slides are business, planning, strategy, marketing, management. This is a completely editable PowerPoint presentation and is available for immediate download. Download now and impress your audience.


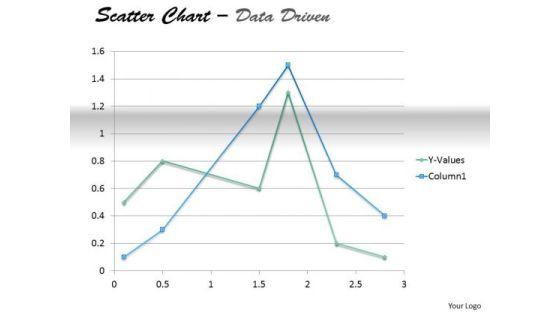


We present our Statistical Data Analysis In Marketing PowerPoint Templates PPT Backgrounds For Slides 0313.Download our Marketing PowerPoint Templates because Our PowerPoint Templates and Slides will let you Clearly mark the path for others to follow. Download our Success PowerPoint Templates because You have gained great respect for your brilliant ideas. Use our PowerPoint Templates and Slides to strengthen and enhance your reputation. Use our Finance PowerPoint Templates because Our PowerPoint Templates and Slides has conjured up a web of all you need with the help of our great team. Use them to string together your glistening ideas. Download our Business PowerPoint Templates because Our PowerPoint Templates and Slides help you pinpoint your timelines. Highlight the reasons for your deadlines with their use. Use our Shapes PowerPoint Templates because Our PowerPoint Templates and Slides ensures Effective communication. They help you put across your views with precision and clarity.Use these PowerPoint slides for presentations relating to The diagramme which shows the statistical data, marketing, success, business, shapes, finance. The prominent colors used in the PowerPoint template are Green, Red, Yellow. Your thoughts will come on fast and furious. Boost your speed of thought with our Statistical Data Analysis In Marketing PowerPoint Templates Ppt Backgrounds For Slides 0313.


We present our Statistical Data Analysis Marketing PowerPoint Templates PPT Backgrounds For Slides 0313.Download and present our Pie charts PowerPoint Templates because It will Raise the bar of your Thoughts. They are programmed to take you to the next level. Download our Signs PowerPoint Templates because You canTake a leap off the starting blocks with our PowerPoint Templates and Slides. They will put you ahead of the competition in quick time. Use our Shapes PowerPoint Templates because Our PowerPoint Templates and Slides are effectively colour coded to prioritise your plans They automatically highlight the sequence of events you desire. Download and present our Business PowerPoint Templates because You can Be the star of the show with our PowerPoint Templates and Slides. Rock the stage with your ideas. Download our Marketing PowerPoint Templates because You canTake a leap off the starting blocks with our PowerPoint Templates and Slides. They will put you ahead of the competition in quick time.Use these PowerPoint slides for presentations relating to Pie chart, Signs, Shapes, pie charts, business, marketing. The prominent colors used in the PowerPoint template are Green, Green lime , White. Excite the senses with our Statistical Data Analysis Marketing PowerPoint Templates Ppt Backgrounds For Slides 0313. Tickle the minds with your views.


We present our data interpretations market analysis templates for business plan PowerPoint.Present our Circle Charts PowerPoint Templates because Our PowerPoint Templates and Slides come in all colours, shades and hues. They help highlight every nuance of your views. Use our Business PowerPoint Templates because Our PowerPoint Templates and Slides will let you Hit the right notes. Watch your audience start singing to your tune. Download our Shapes PowerPoint Templates because Our PowerPoint Templates and Slides will fulfill your every need. Use them and effectively satisfy the desires of your audience. Present our Signs PowerPoint Templates because Our PowerPoint Templates and Slides will provide you a launch platform. Give a lift off to your ideas and send them into orbit. Use our Metaphors-Visual Concepts PowerPoint Templates because You have a driving passion to excel in your field. Our PowerPoint Templates and Slides will prove ideal vehicles for your ideas.Use these PowerPoint slides for presentations relating to business, chart, circle, circular, diagram, economy, finance, framework, graph, isolated, percentage, pie chart, results, scheme, statistics, stats, strategy, success. The prominent colors used in the PowerPoint template are Blue, Green, Blue light. Affiliate our Data Interpretations Market Analysis Templates For Business Plan PowerPoint to your thoughts. They will develop an affinity for them.


This slide represents the key metrics dashboard to track and analyze the performance of ecommerce business after implementing data driven marketing strategies. It includes details related to key metrics such as ecommerce revenue, new customers, repeat purchase rate etc. Get a simple yet stunning designed Ecommerce Data Driven Marketing Performance Analysis Dashboard Professional PDF. It is the best one to establish the tone in your meetings. It is an excellent way to make your presentations highly effective. So, download this PPT today from Slidegeeks and see the positive impacts. Our easy-to-edit Ecommerce Data Driven Marketing Performance Analysis Dashboard Professional PDF can be your go-to option for all upcoming conferences and meetings. So, what are you waiting for Grab this template today.
This slide covers a dashboard for analyzing the metrics of the website landing page. It includes KPIs such as conversions, conversion rate, sessions, bounce rate, engagement sickness, etc. Present like a pro with Marketers Guide To Data Analysis Optimization Website Landing Page KPI Tracking Dashboard Information PDF Create beautiful presentations together with your team, using our easy to use presentation slides. Share your ideas in real time and make changes on the fly by downloading our templates. So whether you are in the office, on the go, or in a remote location, you can stay in sync with your team and present your ideas with confidence. With Slidegeeks presentation got a whole lot easier. Grab these presentations today.
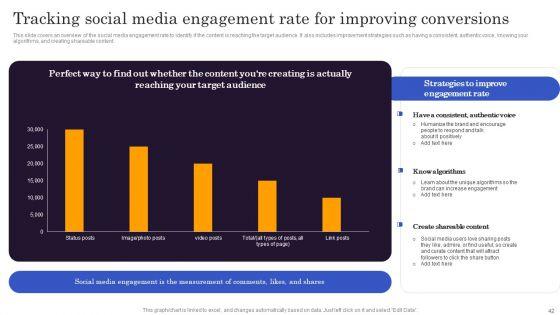
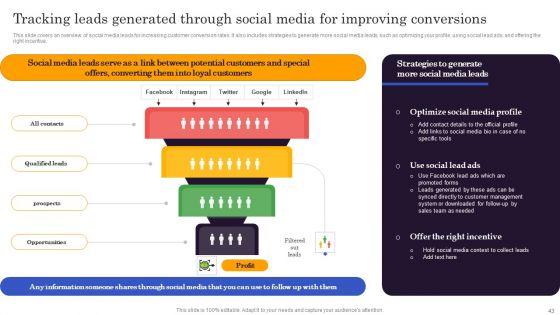
This slide covers an overview of the social media engagement rate to identify if the content is reaching the target audience. It also includes improvement strategies such as having a consistent, authentic voice, knowing your algorithms, and creating shareable content. Do you have to make sure that everyone on your team knows about any specific topic I yes, then you should give Marketers Guide To Data Analysis Optimization Tracking Social Media Engagement Rate For Improving Conversions Brochure PDF a try. Our experts have put a lot of knowledge and effort into creating this impeccable Marketers Guide To Data Analysis Optimization Tracking Social Media Engagement Rate For Improving Conversions Brochure PDF. You can use this template for your upcoming presentations, as the slides are perfect to represent even the tiniest detail. You can download these templates from the Slidegeeks website and these are easy to edit. So grab these today.
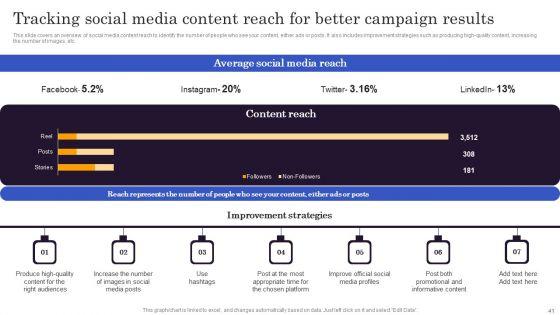
This slide covers an overview of social media content reach to identify the number of people who see your content, either ads or posts. It also includes improvement strategies such as producing high-quality content, increasing the number of images, etc. There are so many reasons you need a Marketers Guide To Data Analysis Optimization Tracking Social Media Content Reach For Better Campaign Results Themes PDF. The first reason is you cannot spend time making everything from scratch, Thus, Slidegeeks has made presentation templates for you too. You can easily download these templates from our website easily.


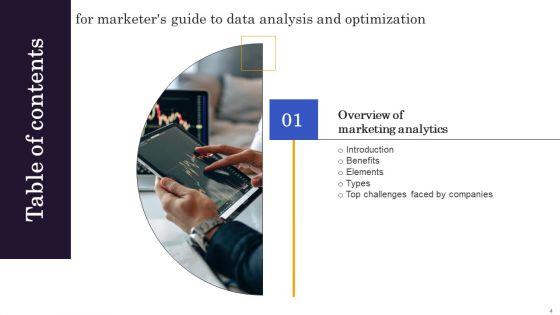
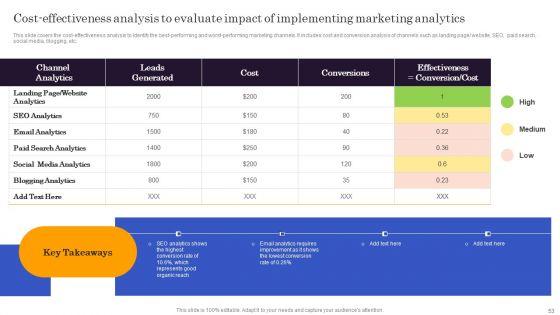
This slide covers significant issues faced by organizations while using marketing analytics. It includes problems such as collecting the correct data, determining how to use data, identifying the correct KPIs, converting leads to revenue, and identifying market trends. Boost your pitch with our creative Marketers Guide To Data Analysis Optimization Top Marketing Analytics Challenges Faced By Companies Formats PDF. Deliver an awe-inspiring pitch that will mesmerize everyone. Using these presentation templates you will surely catch everyones attention. You can browse the ppts collection on our website. We have researchers who are experts at creating the right content for the templates. So you do not have to invest time in any additional work. Just grab the template now and use them.
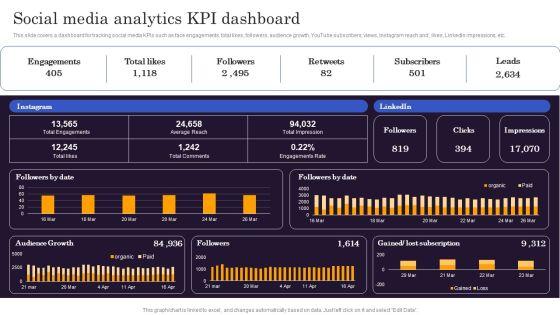

This slide covers a dashboard for tracking social media KPIs such as face engagements, total likes, followers, audience growth, YouTube subscribers, views, Instagram reach and , likes, LinkedIn impressions, etc. Find a pre designed and impeccable Marketers Guide To Data Analysis Optimization Social Media Analytics KPI Dashboard Clipart PDF. The templates can ace your presentation without additional effort. You can download these easy to edit presentation templates to make your presentation stand out from others. So, what are you waiting for Download the template from Slidegeeks today and give a unique touch to your presentation.


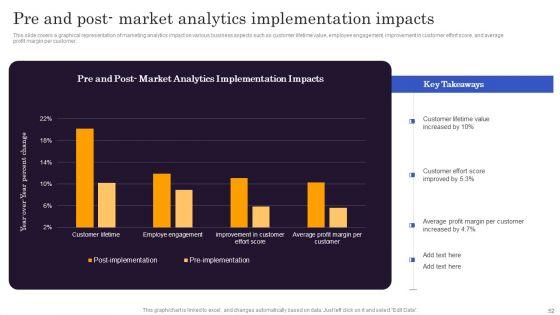
This slide covers a graphical representation of marketing analytics impact on various business aspects such as customer lifetime value, employee engagement, improvement in customer effort score, and average profit margin per customer. Do you know about Slidesgeeks Marketers Guide To Data Analysis Optimization Pre And Post Market Analytics Implementation Impacts Formats PDF. These are perfect for delivering any kind od presentation. Using it, create PowerPoint presentations that communicate your ideas and engage audiences. Save time and effort by using our pre designed presentation templates that are perfect for a wide range of topic. Our vast selection of designs covers a range of styles, from creative to business, and are all highly customizable and easy to edit. Download as a PowerPoint template or use them as Google Slides themes.
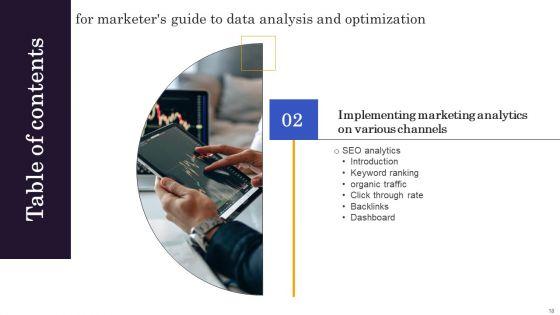
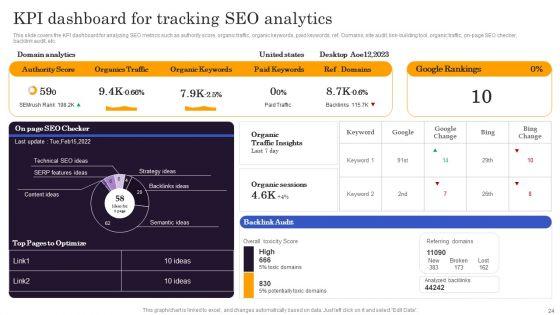
This slide covers the KPI dashboard for analyzing SEO metrics such as authority score, organic traffic, organic keywords, paid keywords, ref. Domains, site audit, link-building tool, organic traffic, on-page SEO checker, backlink audit, etc. This Marketers Guide To Data Analysis Optimization KPI Dashboard For Tracking SEO Analytics Template PDF from Slidegeeks makes it easy to present information on your topic with precision. It provides customization options, so you can make changes to the colors, design, graphics, or any other component to create a unique layout. It is also available for immediate download, so you can begin using it right away. Slidegeeks has done good research to ensure that you have everything you need to make your presentation stand out. Make a name out there for a brilliant performance.
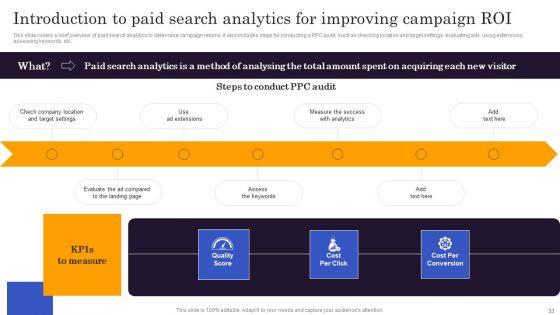
This slide covers the dashboard for analyzing paid search metrics such as ad cost, clicks, impressions, click-through rate, cost per conversion, conversion rate, cost per click, etc. Here you can discover an assortment of the finest PowerPoint and Google Slides templates. With these templates, you can create presentations for a variety of purposes while simultaneously providing your audience with an eye catching visual experience. Download Marketers Guide To Data Analysis Optimization KPI Dashboard For Tracking Paid Ad Campaign Performance Clipart PDF to deliver an impeccable presentation. These templates will make your job of preparing presentations much quicker, yet still, maintain a high level of quality. Slidegeeks has experienced researchers who prepare these templates and write high quality content for you. Later on, you can personalize the content by editing the Marketers Guide To Data Analysis Optimization KPI Dashboard For Tracking Paid Ad Campaign Performance Clipart PDF.
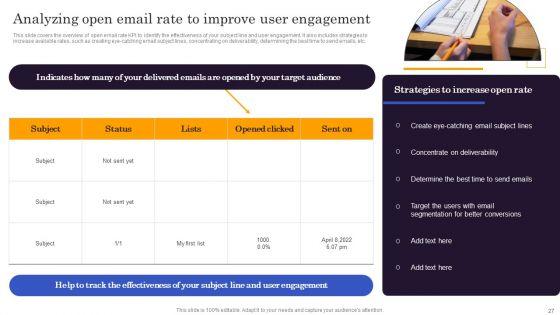
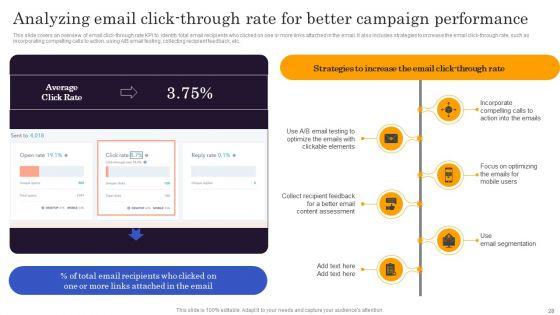
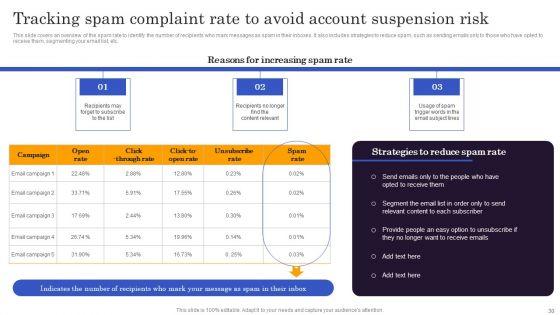
This slide covers the dashboard for analyzing email marketing metrics such as overall open rate, click-through rate, click-to-open ratio, unsubscribe rate, hard bounce rate, soft rate, monthly open rate, total monthly subscribers, etc. Presenting this PowerPoint presentation, titled Marketers Guide To Data Analysis Optimization KPI Dashboard For Tracking Email Marketing Campaign Infographics PDF, with topics curated by our researchers after extensive research. This editable presentation is available for immediate download and provides attractive features when used. Download now and captivate your audience. Presenting this Marketers Guide To Data Analysis Optimization KPI Dashboard For Tracking Email Marketing Campaign Infographics PDF. Our researchers have carefully researched and created these slides with all aspects taken into consideration. This is a completely customizable Marketers Guide To Data Analysis Optimization KPI Dashboard For Tracking Email Marketing Campaign Infographics PDF that is available for immediate downloading. Download now and make an impact on your audience. Highlight the attractive features available with our PPTs.
This slide covers the dashboard for analyzing blogging KPIs such as performance, published posts, views, new blog subscribers, top blog posts by pageviews, top blog posts by CTR, etc. Coming up with a presentation necessitates that the majority of the effort goes into the content and the message you intend to convey. The visuals of a PowerPoint presentation can only be effective if it supplements and supports the story that is being told. Keeping this in mind our experts created Marketers Guide To Data Analysis Optimization Dashboard For Tracking Business Blog Kpis Infographics PDF to reduce the time that goes into designing the presentation. This way, you can concentrate on the message while our designers take care of providing you with the right template for the situation.


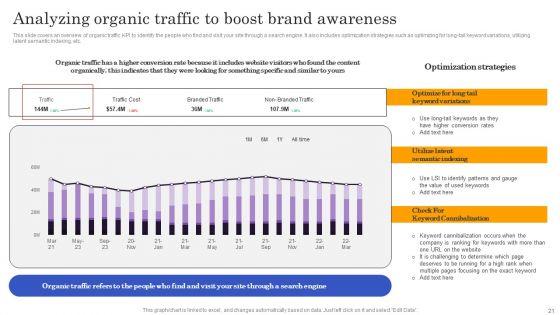
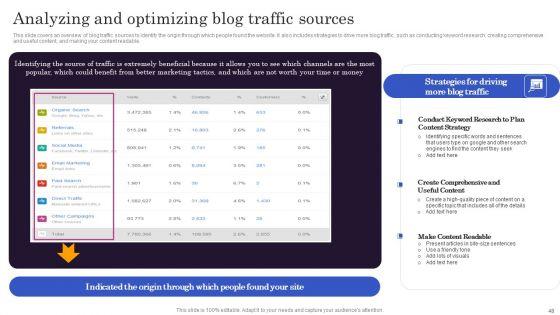
This slide covers an overview of organic traffic KPI to identify the people who find and visit your site through a search engine. It also includes optimization strategies such as optimizing for long-tail keyword variations, utilizing latent semantic indexing, etc. If your project calls for a presentation, then Slidegeeks is your go to partner because we have professionally designed, easy to edit templates that are perfect for any presentation. After downloading, you can easily edit Marketers Guide To Data Analysis Optimization Analyzing Organic Traffic To Boost Brand Awareness Download PDF and make the changes accordingly. You can rearrange slides or fill them with different images. Check out all the handy templates


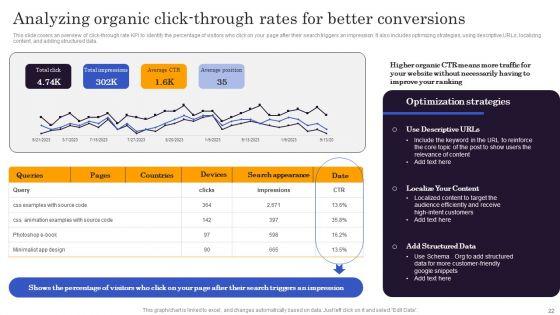
This slide covers an overview of click-through rate KPI to identify the percentage of visitors who click on your page after their search triggers an impression. It also includes optimizing strategies, using descriptive URLs, localizing content, and adding structured data. Find highly impressive Marketers Guide To Data Analysis Optimization Analyzing Organic Click Through Rates For Better Conversions Structure PDF on Slidegeeks to deliver a meaningful presentation. You can save an ample amount of time using these presentation templates. No need to worry to prepare everything from scratch because Slidegeeks experts have already done a huge research and work for you. You need to download Marketers Guide To Data Analysis Optimization Analyzing Organic Click Through Rates For Better Conversions Structure PDF for your upcoming presentation. All the presentation templates are 100 percent editable and you can change the color and personalize the content accordingly. Download now.
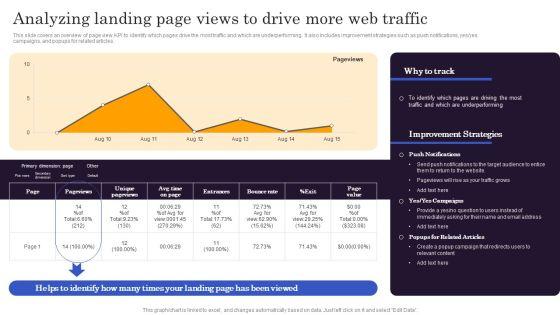

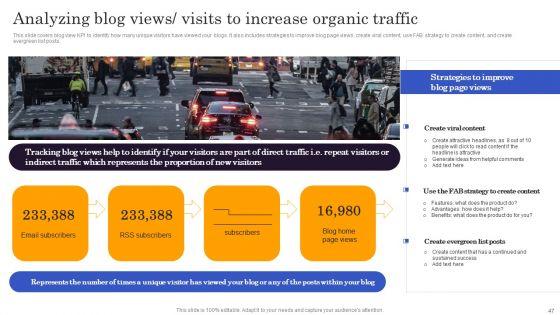
This slide covers an overview of page view KPI to identify which pages drive the most traffic and which are underperforming. It also includes improvement strategies such as push notifications, yes yes campaigns, and popups for related articles. Do you have an important presentation coming up Are you looking for something that will make your presentation stand out from the rest Look no further than Marketers Guide To Data Analysis Optimization Analyzing Landing Page Views To Drive More Web Traffic Rules PDF. With our professional designs, you can trust that your presentation will pop and make delivering it a smooth process. And with Slidegeeks, you can trust that your presentation will be unique and memorable. So why wait Grab Marketers Guide To Data Analysis Optimization Analyzing Landing Page Views To Drive More Web Traffic Rules PDF today and make your presentation stand out from the rest.


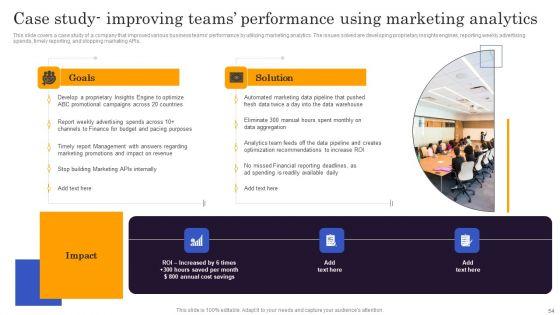
The following slide showcases sample of data assessment with conjoint analysis method to compare features and identify value. It outlines key components such as attribute, level, all responses and comments. Boost your pitch with our creative Guidebook For Executing Business Market Intelligence Data Evaluation Sample With Conjoint Analysis Ideas PDF. Deliver an awe inspiring pitch that will mesmerize everyone. Using these presentation templates you will surely catch everyones attention. You can browse the ppts collection on our website. We have researchers who are experts at creating the right content for the templates. So you do not have to invest time in any additional work. Just grab the template now and use them.
SHOW
- 60
- 120
- 180
DISPLAYING: 60 of 152 Item(s)
Page