- Sign up
- Sign In
 AI PPT Maker
 Templates
 PPT Bundles
 Design Services
 Business PPTs
 Business Plan
 Management
 Strategy
 Introduction PPT
 Roadmap
 Self Introduction
 Timelines
 Process
 Marketing
 Agenda
 Technology
 Medical
 Startup Business Plan
 Cyber Security
 Dashboards
 SWOT
SWOT Proposals
 Education
 Pitch Deck
 Digital Marketing
 KPIs
KPIs Project Management
 Product Management
 Artificial Intelligence
 Target Market
 Communication
 Supply Chain
 Google Slides
 Research Services
 One Pagers
 All Categories
Dashboards to monitor PowerPoint Presentation Templates and Google Slides
SHOW
- 60
- 120
- 180
DISPLAYING: 60 of 182 Item(s)
Page


This slide covers report to track performance of the companys business profile on LinkedIn. The purpose of this template is to provide an overview to the user to evaluate the pages performance and optimize the profile to improve outcomes. It includes tracking based on followers, CTR, engagement rate on company updates, page impressions, reach, etc. Create an editable Dashboard To Monitor Company Linkedin Page Performance Portrait PDF that communicates your idea and engages your audience. Whether you are presenting a business or an educational presentation, pre designed presentation templates help save time. Dashboard To Monitor Company Linkedin Page Performance Portrait PDF is highly customizable and very easy to edit, covering many different styles from creative to business presentations. Slidegeeks has creative team members who have crafted amazing templates. So, go and get them without any delay.


Mentioned slide demonstrates KPI showcasing email marketing performance which can be used by businesses to determine organisation future growth opportunities. It includes key performance indictors such as conversion rate, open rate, click through rate, bounce rate, and email list growth rate. Make sure to capture your audiences attention in your business displays with our gratis customizable Customer Retention With Email Advertising Campaign Plan KPI Dashboard To Monitor Email Marketing Structure PDF. These are great for business strategies, office conferences, capital raising or task suggestions. If you desire to acquire more customers for your tech business and ensure they stay satisfied, create your own sales presentation with these plain slides.


Mentioned slide shows the KPI dashboard that can be used to track win and lost sales opportunities. It includes metrics namely won opportunities, lost opportunities, pipeline by territory, total opportunities. Get a simple yet stunning designed Strategic Plan To Establish And Promote Brand Awareness Kpi Dashboard To Monitor Sales Opportunities Background PDF. It is the best one to establish the tone in your meetings. It is an excellent way to make your presentations highly effective. So, download this PPT today from Slidegeeks and see the positive impacts. Our easy to edit Strategic Plan To Establish And Promote Brand Awareness Kpi Dashboard To Monitor Sales Opportunities Background PDF can be your go to option for all upcoming conferences and meetings. So, what are you waiting for Grab this template today.


This slide highlights the workplace safety dashboard which showcase incidents per employee, worksite incident total, incidents by total and top injuries by body part. Do you know about Slidesgeeks Deploying Safe Operating Procedures In The Organization Workplace Safety Dashboard To Monitor Incidents Professional PDF. These are perfect for delivering any kind od presentation. Using it, create PowerPoint presentations that communicate your ideas and engage audiences. Save time and effort by using our pre designed presentation templates that are perfect for a wide range of topic. Our vast selection of designs covers a range of styles, from creative to business, and are all highly customizable and easy to edit. Download as a PowerPoint template or use them as Google Slides themes.


This slide showcases the dashboard to track and monitor performance of CPA marketing campaign. It incorporates metrics such as link clicks, CTR, marketing cost, overall CPA cost, website conversion rate, overall conversion rate, advertising sources, etc. The best PPT templates are a great way to save time, energy, and resources. Slidegeeks have 100 percent editable powerpoint slides making them incredibly versatile. With these quality presentation templates, you can create a captivating and memorable presentation by combining visually appealing slides and effectively communicating your message. Download Strategies For Implementing CPA Marketing Dashboard To Monitor CPA Marketing Campaign Performance Topics PDF from Slidegeeks and deliver a wonderful presentation.


This slide showcases the dashboard to track and monitor performance of CPA marketing campaign. It incorporates metrics such as link clicks, CTR, marketing cost, overall CPA cost, website conversion rate, overall conversion rate, advertising sources, etc. Presenting this PowerPoint presentation, titled Significance Of CPA To Maximize Digital Marketing ROI Dashboard To Monitor CPA Marketing Campaign Structure PDF, with topics curated by our researchers after extensive research. This editable presentation is available for immediate download and provides attractive features when used. Download now and captivate your audience. Presenting this Significance Of CPA To Maximize Digital Marketing ROI Dashboard To Monitor CPA Marketing Campaign Structure PDF. Our researchers have carefully researched and created these slides with all aspects taken into consideration. This is a completely customizable Significance Of CPA To Maximize Digital Marketing ROI Dashboard To Monitor CPA Marketing Campaign Structure PDF that is available for immediate downloading. Download now and make an impact on your audience. Highlight the attractive features available with our PPTs.


This slide illustrates the KPI dashboard for workforce diversity providing details regarding headcount by seniority, gender and gender. It also provides information regarding monthly median age by gender and women at senior level forecast. Welcome to our selection of the Inclusive Leadership Program KPI Dashboard To Monitor Workforce Diversity Designs PDF. These are designed to help you showcase your creativity and bring your sphere to life. Planning and Innovation are essential for any business that is just starting out. This collection contains the designs that you need for your everyday presentations. All of our PowerPoints are 100 percent editable, so you can customize them to suit your needs. This multi purpose template can be used in various situations. Grab these presentation templates today.


The following slide displays BI dashboard for real time tracking of key business financials. It further includes details about scorecard, sales distribution, supply and demand, etc. Pitch your topic with ease and precision using this Business Intelligence Dashboard To Monitor Performance Of Retail Business Infographics PDF. This layout presents information on Business Intelligence Dashboard, Monitor Performance, Retail Business. It is also available for immediate download and adjustment. So, changes can be made in the color, design, graphics or any other component to create a unique layout.
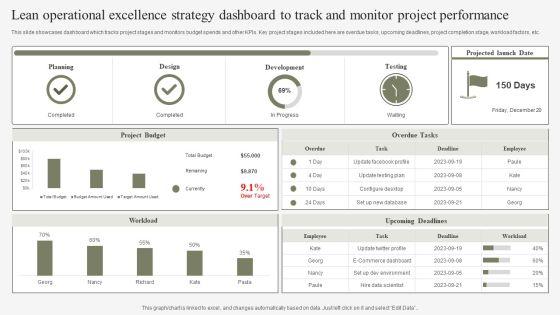
This slide showcases dashboard which tracks project stages and monitors budget spends and other KPIs. Key project stages included here are overdue tasks, upcoming deadlines, project completion stage, workload factors, etc. Pitch your topic with ease and precision using this Lean Operational Excellence Strategy Dashboard To Track And Monitor Project Performance Slides PDF. This layout presents information on Planning, Design, Development. It is also available for immediate download and adjustment. So, changes can be made in the color, design, graphics or any other component to create a unique layout.


This slide depicts a dashboard that will be used by managers to monitor the global footprint of supply chain operations. Major key performance indicators include total global emissions, time frame, allocation, electricity, etc. Showcasing this set of slides titled Dashboard To Monitor International Footprint Of Supply Chain Operations Brochure PDF. The topics addressed in these templates are Electricity, Footprint Emissions, Allocation. All the content presented in this PPT design is completely editable. Download it and make adjustments in color, background, font etc. as per your unique business setting.


This slide showcases support service dashboard to track relevant performance metrics. Major KPIs covered are customer satisfaction, average time to resolve problem, cost per support, customer retention, request volume, etc. Make sure to capture your audiences attention in your business displays with our gratis customizable Action Plan To Enhance Client Service Customer Service Dashboard To Monitor Kpis Clipart PDF. These are great for business strategies, office conferences, capital raising or task suggestions. If you desire to acquire more customers for your tech business and ensure they stay satisfied, create your own sales presentation with these plain slides.


Following slide demonstrates KPI dashboard for tracking retail store customer support service team performance for increase customer retention rate. It includes elements such as customer requests answered, total customer request, total revenue, support cost, customer satisfaction level, etc. Showcasing this set of slides titled KPI Dashboard To Monitor Performance Of Retail Store Consumer Services Summary PDF. The topics addressed in these templates are Customer Request, Customer Retention Rate, Customer Satisfaction Level. All the content presented in this PPT design is completely editable. Download it and make adjustments in color, background, font etc. as per your unique business setting.
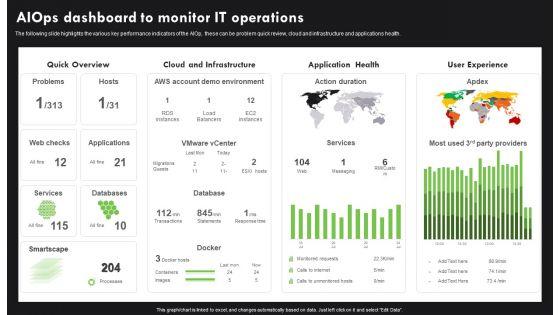

The following slide highlights the various key performance indicators of the AIOp, these can be problem quick review, cloud and infrastructure and applications health. If you are looking for a format to display your unique thoughts, then the professionally designed AI Deployment In IT Process Aiops Dashboard To Monitor IT Operations Infographics PDF is the one for you. You can use it as a Google Slides template or a PowerPoint template. Incorporate impressive visuals, symbols, images, and other charts. Modify or reorganize the text boxes as you desire. Experiment with shade schemes and font pairings. Alter, share or cooperate with other people on your work. Download AI Deployment In IT Process Aiops Dashboard To Monitor IT Operations Infographics PDF and find out how to give a successful presentation. Present a perfect display to your team and make your presentation unforgettable.


This slide highlights the workplace safety dashboard which showcase incidents per employee, worksite incident total, incidents by total and top injuries by body part. Get a simple yet stunning designed Occupational Health And Safety At Workplace Workplace Safety Dashboard To Monitor Incidents Inspiration PDF. It is the best one to establish the tone in your meetings. It is an excellent way to make your presentations highly effective. So, download this PPT today from Slidegeeks and see the positive impacts. Our easy to edit Occupational Health And Safety At Workplace Workplace Safety Dashboard To Monitor Incidents Inspiration PDF can be your go to option for all upcoming conferences and meetings. So, what are you waiting for Grab this template today.


The purpose of this slide is to outline key performance indicator KPI dashboard which will assist the marketer to analyze mobile search engine optimization SEO performance. The key metrics mentioned in the slide are total sessions, search engine rankings etc. Take your projects to the next level with our ultimate collection of Introduction To Mobile SEM KPI Metrics Dashboard To Monitor Mobile SEO Performance Diagrams PDF. Slidegeeks has designed a range of layouts that are perfect for representing task or activity duration, keeping track of all your deadlines at a glance. Tailor these designs to your exact needs and give them a truly corporate look with your own brand colors they will make your projects stand out from the rest.


This slide represents the dashboard for payroll management of employees to track their performance and take actions to improve them. This dashboard is depicting the employee performance impact in different departments and the salary is paid to employees along with their deductions. Showcasing this set of slides titled Payroll Administration Software Dashboard To Monitor Employee Performance Summary PDF. The topics addressed in these templates are Payroll Administration Software Dashboard, Monitor Employee Performance. All the content presented in this PPT design is completely editable. Download it and make adjustments in color, background, font etc. as per your unique business setting.


Following slide demonstrates KPI dashboard to monitor performance of sales executives to determine best performing employee. It includes key components such as monthly performance, targets achieved, sales by executives, lead funnel, total daily and monthly profits. Pitch your topic with ease and precision using this KPI Dashboard To Monitor Operational Sales Executive Performance Portrait PDF. This layout presents information on Revenue, Profit, Sales, Customers. It is also available for immediate download and adjustment. So, changes can be made in the color, design, graphics or any other component to create a unique layout.


This slide showcases dashboard to review bank transactions and activities. It provides information about credit, check, ATM, debit card, transaction volume, decline rate, visa, maestro, network end points, etc. Whether you have daily or monthly meetings, a brilliant presentation is necessary. Deploying AML Transaction Monitoring Dashboard To Monitor Bank Transactions And Activities Graphics PDF can be your best option for delivering a presentation. Represent everything in detail using Deploying AML Transaction Monitoring Dashboard To Monitor Bank Transactions And Activities Graphics PDF and make yourself stand out in meetings. The template is versatile and follows a structure that will cater to your requirements. All the templates prepared by Slidegeeks are easy to download and edit. Our research experts have taken care of the corporate themes as well. So, give it a try and see the results.


The following slide highlights the various key performance indicators of the AIOps, these can be problem quick review, cloud and infrastructure and applications health If you are looking for a format to display your unique thoughts, then the professionally designed Operational Strategy For ML In IT Sector Aiops Dashboard To Monitor IT Operations Diagrams PDF is the one for you. You can use it as a Google Slides template or a PowerPoint template. Incorporate impressive visuals, symbols, images, and other charts. Modify or reorganize the text boxes as you desire. Experiment with shade schemes and font pairings. Alter, share or cooperate with other people on your work. Download Operational Strategy For ML In IT Sector Aiops Dashboard To Monitor IT Operations Diagrams PDF and find out how to give a successful presentation. Present a perfect display to your team and make your presentation unforgettable.


This slide highlights the workplace safety dashboard which showcase incidents per employee, worksite incident total, incidents by total and top injuries by body part. There are so many reasons you need a Workplace Safety Dashboard To Monitor Incidents Clipart PDF. The first reason is you cannot spend time making everything from scratch, Thus, Slidegeeks has made presentation templates for you too. You can easily download these templates from our website easily.


The following slide highlights the various key performance indicators of the AIOp, these can be problem quick review, cloud and infrastructure and applications health. If you are looking for a format to display your unique thoughts, then the professionally designed Information Technology Operations Administration With ML Aiops Dashboard To Monitor Diagrams PDF is the one for you. You can use it as a Google Slides template or a PowerPoint template. Incorporate impressive visuals, symbols, images, and other charts. Modify or reorganize the text boxes as you desire. Experiment with shade schemes and font pairings. Alter, share or cooperate with other people on your work. Download Information Technology Operations Administration With ML Aiops Dashboard To Monitor Diagrams PDF and find out how to give a successful presentation. Present a perfect display to your team and make your presentation unforgettable.


This slide illustrates the KPI dashboard for workforce diversity providing details regarding headcount by seniority, gender and gender. It also provides information regarding monthly median age by gender and women at senior level forecast. Welcome to our selection of the KPI Dashboard To Monitor Workforce Diversity Portrait PDF. These are designed to help you showcase your creativity and bring your sphere to life. Planning and Innovation are essential for any business that is just starting out. This collection contains the designs that you need for your everyday presentations. All of our PowerPoints are 100 percent editable, so you can customize them to suit your needs. This multi purpose template can be used in various situations. Grab these presentation templates today.


The purpose of this slide is to highlight key performance indicator KPI dashboard which can be used to track the performance of organization cyber security. The KPI metrics covered in the slide are asset type control, control issues by standard and regulation etc. This Implementing Cybersecurity Awareness Program To Prevent Attacks KPI Dashboard To Monitor Cyber Security Introduction PDF is perfect for any presentation, be it in front of clients or colleagues. It is a versatile and stylish solution for organizing your meetings. The Implementing Cybersecurity Awareness Program To Prevent Attacks KPI Dashboard To Monitor Cyber Security Introduction PDF features a modern design for your presentation meetings. The adjustable and customizable slides provide unlimited possibilities for acing up your presentation. Slidegeeks has done all the homework before launching the product for you. So, do not wait, grab the presentation templates today


This slide depicts the dashboard to monitor performance of business process outsourcing enterprise with reference to industry standards. The key elements covered in the slide are total calls, average answer speed, abandon rate, average calls per minute and agent performanc. Showcasing this set of slides titled Dashboard To Monitor Business Process Outsourcing Performance Based On Industry Standards Infographics PDF. The topics addressed in these templates are Industry Standards, Chart By Agent, Call Abandon Rate, Total Calls. All the content presented in this PPT design is completely editable. Download it and make adjustments in color, background, font etc. as per your unique business setting.


This slide showcases support service dashboard to track relevant performance metrics. Major KPIs covered are customer satisfaction, average time to resolve problem, cost per support, customer retention, request volume, etc. Present like a pro with Techniques To Optimize UX Customer Service Dashboard To Monitor Kpis Template PDF Create beautiful presentations together with your team, using our easy-to-use presentation slides. Share your ideas in real-time and make changes on the fly by downloading our templates. So whether youre in the office, on the go, or in a remote location, you can stay in sync with your team and present your ideas with confidence. With Slidegeeks presentation got a whole lot easier. Grab these presentations today.


Mentioned slide demonstrates dashboard for tracking monthly public relations marketing practices to determine marketing department performance. It includes key components such as month press release for product, blogs and articles posts, social media channel uploads, etc. Pitch your topic with ease and precision using this KPI Dashboard To Monitor Public Promotion Marketing Practices Template PDF. This layout presents information on Paid Media, Owned Media, Total News Release, Comparison Graph. It is also available for immediate download and adjustment. So, changes can be made in the color, design, graphics or any other component to create a unique layout.


Following slide demonstrates KPI dashboard for tracking shopping website revenue with customer conversion rate to determine business growth. It includes key elements such as website revenue, new customer, repeated purchase rate, average order value, marketing channel, devices and product revenue and conversion rate. Showcasing this set of slides titled Kpi Dashboard To Monitor E Commerce Website Conversion Rate Clipart PDF. The topics addressed in these templates are Shopping Website Revenue, Conversion Rate, Website Revenue. All the content presented in this PPT design is completely editable. Download it and make adjustments in color, background, font etc. as per your unique business setting.


This slide showcases dashboard to review bank transactions and activities. It provides information about credit, check, ATM, debit card, transaction volume, decline rate, visa, maestro, network end points, etc. Do you have an important presentation coming up Are you looking for something that will make your presentation stand out from the rest Look no further than Creating Transaction Monitoring Dashboard To Monitor Bank Transactions And Activities Information PDF. With our professional designs, you can trust that your presentation will pop and make delivering it a smooth process. And with Slidegeeks, you can trust that your presentation will be unique and memorable. So why wait Grab Creating Transaction Monitoring Dashboard To Monitor Bank Transactions And Activities Information PDF today and make your presentation stand out from the rest.


The purpose of this slide is to outline key performance indicator KPI dashboard which will assist the marketer to analyze mobile search engine optimization SEO performance. The key metrics mentioned in the slide are total sessions, search engine rankings etc. Slidegeeks is one of the best resources for PowerPoint templates. You can download easily and regulate Top SEO Techniques KPI Metrics Dashboard To Monitor Mobile SEO Information PDF for your personal presentations from our wonderful collection. A few clicks is all it takes to discover and get the most relevant and appropriate templates. Use our Templates to add a unique zing and appeal to your presentation and meetings. All the slides are easy to edit and you can use them even for advertisement purposes.


The purpose of this slide is to outline key performance indicator KPI dashboard which will assist the marketer to analyze mobile search engine optimization SEO performance. The key metrics mentioned in the slide are total sessions, search engine rankings etc. This Mobile Search Engine Optimization Plan KPI Metrics Dashboard To Monitor Mobile SEO Performance Inspiration PDF from Slidegeeks makes it easy to present information on your topic with precision. It provides customization options, so you can make changes to the colors, design, graphics, or any other component to create a unique layout. It is also available for immediate download, so you can begin using it right away. Slidegeeks has done good research to ensure that you have everything you need to make your presentation stand out. Make a name out there for a brilliant performance.


This slide provides information regarding monitoring dashboard to track brand performance through monitoring of session, new users, bounce rate, etc. From laying roadmaps to briefing everything in detail, our templates are perfect for you. You can set the stage with your presentation slides. All you have to do is download these easy to edit and customizable templates. Brand Personality Improvement To Increase Profits Performance Monitoring Dashboard To Track Inspiration PDF will help you deliver an outstanding performance that everyone would remember and praise you for. Do download this presentation today.
This slide provides information brand loyalty tracking dashboard in order to monitor customer engagement, average revenues, new vs. returning visitors performance, etc. Get a simple yet stunning designed Brand Personality Improvement To Increase Profits Customer Tracking Dashboard To Monitor Brand Themes PDF. It is the best one to establish the tone in your meetings. It is an excellent way to make your presentations highly effective. So, download this PPT today from Slidegeeks and see the positive impacts. Our easy to edit Brand Personality Improvement To Increase Profits Customer Tracking Dashboard To Monitor Brand Themes PDF can be your go to option for all upcoming conferences and meetings. So, what are you waiting for Grab this template today.


This slide showcases dashboard that monitors cost associated with SEO services. Key cost elements included here are monthly spends on Google ads, Facebook ads, Instagram publicity, leads generated from each channel and cost per lead etc. Pitch your topic with ease and precision using this Dashboard To Monitor SEO Cost For Generating Website Traffic Management Slides PDF. This layout presents information on Google Ads, Conversions, Cost Per Conversion. It is also available for immediate download and adjustment. So, changes can be made in the color, design, graphics or any other component to create a unique layout.


This slide presents a dashboard which can be used by suppliers to monitor any issues taking place in the supply chain and take timely steps for improvement. The key performing indicators are activities due, issue severity, issues unassigned, issues under inspection etc. Pitch your topic with ease and precision using this KPI Dashboard To Monitor Real Time Issues In Logistics Chain Rules PDF. This layout presents information on Activities Due, Issues By Severity, Issues Rejected, Inspection Status. It is also available for immediate download and adjustment. So, changes can be made in the color, design, graphics or any other component to create a unique layout.


Following slide depicts a dashboard which can be used by supplier to get a centralized, real-time view of key metrics and data points related to the logistics performance. Key performance metrics are related to due receipts, number of products received,items in transit, items due for pickup etc. Pitch your topic with ease and precision using this Dashboard To Monitor Logistics Chains Warehouse Operations Diagrams PDF. This layout presents information on Product Status, Pickup List Status, Best Selling Products. It is also available for immediate download and adjustment. So, changes can be made in the color, design, graphics or any other component to create a unique layout.


This slide showcases support service dashboard to track relevant performance metrics. Major KPIs covered are customer satisfaction, average time to resolve problem, cost per support, customer retention, request volume, etc. Formulating a presentation can take up a lot of effort and time, so the content and message should always be the primary focus. The visuals of the PowerPoint can enhance the presentes message, so our Enhancing Client Experience Customer Service Dashboard To Monitor Kpis Summary PDF was created to help save time. Instead of worrying about the design, the presenter can concentrate on the message while our designers work on creating the ideal templates for whatever situation is needed. Slidegeeks has experts for everything from amazing designs to valuable content, we have put everything into Enhancing Client Experience Customer Service Dashboard To Monitor Kpis Summary PDF.


This slide showcases dashboard to review bank transactions and activities. It provides information about credit, check, ATM, debit card, transaction volume, decline rate, visa, maestro, network end points, etc. Slidegeeks is here to make your presentations a breeze with Actual Time Transaction Monitoring Software And Strategies Dashboard To Monitor Bank Transactions Guidelines PDF With our easy to use and customizable templates, you can focus on delivering your ideas rather than worrying about formatting. With a variety of designs to choose from, you are sure to find one that suits your needs. And with animations and unique photos, illustrations, and fonts, you can make your presentation pop. So whether you are giving a sales pitch or presenting to the board, make sure to check out Slidegeeks first.


This slide depicts the dashboard to monitor the heartbeat and working of the biochip pacemaker by showing the lower and upper rate limit, activity threshold, and so on. Crafting an eye catching presentation has never been more straightforward. Let your presentation shine with this tasteful yet straightforward Biochip Technology Dashboard To Monitor Biochip Pacemaker Working Ideas PDF template. It offers a minimalistic and classy look that is great for making a statement. The colors have been employed intelligently to add a bit of playfulness while still remaining professional. Construct the ideal Biochip Technology Dashboard To Monitor Biochip Pacemaker Working Ideas PDF that effortlessly grabs the attention of your audience Begin now and be certain to wow your customers.


The following slide showcases a dashboard to monitor customer segmentation based on similar traits and characteristics. It highlights elements such as total customer in each segments, segments description, segment characteristics and search customer by ID. Formulating a presentation can take up a lot of effort and time, so the content and message should always be the primary focus. The visuals of the PowerPoint can enhance the presenters message, so our Customer Segmentation Dashboard To Monitor Results Ppt PowerPoint Presentation File Deck PDF was created to help save time. Instead of worrying about the design, the presenter can concentrate on the message while our designers work on creating the ideal templates for whatever situation is needed. Slidegeeks has experts for everything from amazing designs to valuable content, we have put everything into Customer Segmentation Dashboard To Monitor Results Ppt PowerPoint Presentation File Deck PDF.


The following slide highlights the various key performance indicators of the AIOp, these can be problem quick review, cloud and infrastructure and applications health. If you are looking for a format to display your unique thoughts, then the professionally designed Aiops Dashboard To Monitor IT Operations Aiops Integration Summary Report Clipart PDF is the one for you. You can use it as a Google Slides template or a PowerPoint template. Incorporate impressive visuals, symbols, images, and other charts. Modify or reorganize the text boxes as you desire. Experiment with shade schemes and font pairings. Alter, share or cooperate with other people on your work. Download Aiops Dashboard To Monitor IT Operations Aiops Integration Summary Report Clipart PDF and find out how to give a successful presentation. Present a perfect display to your team and make your presentation unforgettable.


This slide showcases support service dashboard to track relevant performance metrics. Major KPIs covered are customer satisfaction, average time to resolve problem, cost per support, customer retention, request volume, etc. Slidegeeks is here to make your presentations a breeze with Enhance Customer Engagement Through After Sales Activities Customer Service Dashboard To Monitor Kpis Introduction PDF With our easy to use and customizable templates, you can focus on delivering your ideas rather than worrying about formatting. With a variety of designs to choose from, you are sure to find one that suits your needs. And with animations and unique photos, illustrations, and fonts, you can make your presentation pop. So whether you are giving a sales pitch or presenting to the board, make sure to check out Slidegeeks first.


This slide highlights the workplace safety dashboard which showcase incidents per employee, worksite incident total, incidents by total and top injuries by body part. Whether you have daily or monthly meetings, a brilliant presentation is necessary. Best Practices For Occupational Health And Safety Workplace Safety Dashboard To Monitor Themes PDF can be your best option for delivering a presentation. Represent everything in detail using Best Practices For Occupational Health And Safety Workplace Safety Dashboard To Monitor Themes PDF and make yourself stand out in meetings. The template is versatile and follows a structure that will cater to your requirements. All the templates prepared by Slidegeeks are easy to download and edit. Our research experts have taken care of the corporate themes as well. So, give it a try and see the results.


This slide showcases support service dashboard to track relevant performance metrics. Major KPIs covered are customer satisfaction, average time to resolve problem, cost per support, customer retention, request volume, etc. Do you have an important presentation coming up. Are you looking for something that will make your presentation stand out from the rest. Look no further than Service Improvement Techniques For Client Retention Customer Service Dashboard To Monitor Kpis Clipart PDF. With our professional designs, you can trust that your presentation will pop and make delivering it a smooth process. And with Slidegeeks, you can trust that your presentation will be unique and memorable. So why wait. Grab Service Improvement Techniques For Client Retention Customer Service Dashboard To Monitor Kpis Clipart PDF today and make your presentation stand out from the rest.


This slide showcases dashboard to review bank transactions and activities. It provides information about credit, check, ATM, debit card, transaction volume, decline rate, visa, maestro, network end points, etc. Do you have an important presentation coming up Are you looking for something that will make your presentation stand out from the rest Look no further than Formulating Money Laundering Dashboard To Monitor Bank Transactions And Activities Clipart PDF. With our professional designs, you can trust that your presentation will pop and make delivering it a smooth process. And with Slidegeeks, you can trust that your presentation will be unique and memorable. So why wait Grab Formulating Money Laundering Dashboard To Monitor Bank Transactions And Activities Clipart PDF today and make your presentation stand out from the rest.


This slide showcases dashboard to review bank transactions and activities. It provides information about credit, check, ATM, debit card, transaction volume, decline rate, visa, maestro, network end points, etc. Do you have an important presentation coming up Are you looking for something that will make your presentation stand out from the rest Look no further than Deploying Banking Transaction Dashboard To Monitor Bank Transactions And Activities Summary PDF. With our professional designs, you can trust that your presentation will pop and make delivering it a smooth process. And with Slidegeeks, you can trust that your presentation will be unique and memorable. So why wait Grab Deploying Banking Transaction Dashboard To Monitor Bank Transactions And Activities Summary PDF today and make your presentation stand out from the rest.


Mentioned slide shows the KPI dashboard that can be used to track win and lost sales opportunities. It includes metrics namely won opportunities, lost opportunities, pipeline by territory, total opportunities. Are you searching for a Comprehensive Guide To Enhance Kpi Dashboard To Monitor Sales Opportunities Information PDF that is uncluttered, straightforward, and original Its easy to edit, and you can change the colors to suit your personal or business branding. For a presentation that expresses how much effort youve put in, this template is ideal With all of its features, including tables, diagrams, statistics, and lists, its perfect for a business plan presentation. Make your ideas more appealing with these professional slides. Download Comprehensive Guide To Enhance Kpi Dashboard To Monitor Sales Opportunities Information PDF from Slidegeeks today.


This slide represents the dashboard to monitor production plant efficiency for the multiple shifts. The multiple KPIs covered in dashboard are availability, performance of manufacturing plant machines. It also provides information regarding the total downtime along with good parts yield. There are so many reasons you need a Leveraging Predictive Maintenance To Enhance Production Process Dashboard To Monitor Production Plant Shift Efficiency Structure PDF. The first reason is you cant spend time making everything from scratch, Thus, Slidegeeks has made presentation templates for you too. You can easily download these templates from our website easily.


This slide highlights the dashboard to monitor the department wise budget allocation and usage. It provides information regarding the total budget allocated and actual amount spent by multiple organization silos such as marketing, finance, HR. It also contains details of each departments average employee spending. Want to ace your presentation in front of a live audience Our Expenses Management Plan Dashboard To Monitor Department Wise Budget Allocation Clipart PDF can help you do that by engaging all the users towards you. Slidegeeks experts have put their efforts and expertise into creating these impeccable powerpoint presentations so that you can communicate your ideas clearly. Moreover, all the templates are customizable, and easy-to-edit and downloadable. Use these for both personal and commercial use.


This slide showcases dashboard to review bank transactions and activities. It provides information about credit, check, ATM, debit card, transaction volume, decline rate, visa, maestro, network end points, etc. This KYC Transaction Monitoring System Business Security Dashboard To Monitor Bank Transactions Mockup PDF from Slidegeeks makes it easy to present information on your topic with precision. It provides customization options, so you can make changes to the colors, design, graphics, or any other component to create a unique layout. It is also available for immediate download, so you can begin using it right away. Slidegeeks has done good research to ensure that you have everything you need to make your presentation stand out. Make a name out there for a brilliant performance.


This slide represents the dashboard to monitor production plant efficiency for the multiple shifts. The multiple KPIs covered in dashboard are availability, performance of manufacturing plant machines. It also provides information regarding the total downtime along with good parts yield. Slidegeeks is one of the best resources for PowerPoint templates. You can download easily and regulate Machine Repairing And Servicing Dashboard To Monitor Production Plant Shift Structure PDF for your personal presentations from our wonderful collection. A few clicks is all it takes to discover and get the most relevant and appropriate templates. Use our Templates to add a unique zing and appeal to your presentation and meetings. All the slides are easy to edit and you can use them even for advertisement purposes.
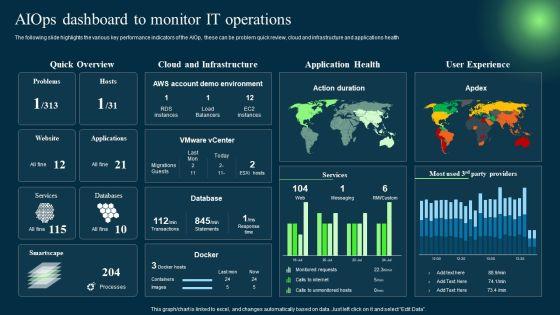
The following slide highlights the various key performance indicators of the AIOp, these can be problem quick review, cloud and infrastructure and applications health. Create an editable Introduction To Artificial Intelligence In Operation Management Industry Aiops Dashboard To Monitor IT Operations Clipart PDF that communicates your idea and engages your audience. Whether you are presenting a business or an educational presentation, pre-designed presentation templates help save time. Introduction To Artificial Intelligence In Operation Management Industry Aiops Dashboard To Monitor IT Operations Clipart PDF is highly customizable and very easy to edit, covering many different styles from creative to business presentations. Slidegeeks has creative team members who have crafted amazing templates. So, go and get them without any delay.


This slide showcases the dashboard to track and monitor performance of CPA marketing campaign. It incorporates metrics such as link clicks, CTR, marketing cost, overall CPA cost, website conversion rate, overall conversion rate, advertising sources, etc. This Integrating CPA Marketing Dashboard To Monitor CPA Marketing Campaign Guidelines PDF from Slidegeeks makes it easy to present information on your topic with precision. It provides customization options, so you can make changes to the colors, design, graphics, or any other component to create a unique layout. It is also available for immediate download, so you can begin using it right away. Slidegeeks has done good research to ensure that you have everything you need to make your presentation stand out. Make a name out there for a brilliant performance.


This slide showcases dashboard to review bank transactions and activities. It provides information about credit, check, ATM, debit card, transaction volume, decline rate, visa, maestro, network end points, etc. Find highly impressive Techniques To Monitor Transactions Dashboard To Monitor Bank Transactions And Activities Introduction PDF on Slidegeeks to deliver a meaningful presentation. You can save an ample amount of time using these presentation templates. No need to worry to prepare everything from scratch because Slidegeeks experts have already done a huge research and work for you. You need to download Techniques To Monitor Transactions Dashboard To Monitor Bank Transactions And Activities Introduction PDF for your upcoming presentation. All the presentation templates are 100 percent editable and you can change the color and personalize the content accordingly. Download now.


This slide showcases dashboard for monitoring fraudulent and money laundering transactions. It provides information about legitimacy, total transaction, unusual transactions, bank, client, investigation, in peer review, etc. Whether you have daily or monthly meetings, a brilliant presentation is necessary. Techniques To Monitor Transactions Dashboard For Monitoring Fraud And Money Laundering Demonstration PDF can be your best option for delivering a presentation. Represent everything in detail using Techniques To Monitor Transactions Dashboard For Monitoring Fraud And Money Laundering Demonstration PDF and make yourself stand out in meetings. The template is versatile and follows a structure that will cater to your requirements. All the templates prepared by Slidegeeks are easy to download and edit. Our research experts have taken care of the corporate themes as well. So, give it a try and see the results.


Following slide displays sales and orders performance monitoring dashboard. Key performance indicators covered in the slide are return reasons, perfect order rate, total orders, top seller by orders. Crafting an eye-catching presentation has never been more straightforward. Let your presentation shine with this tasteful yet straightforward Strategic Guide For Positioning Expanded Brand KPI Dashboard To Monitor Sales And Orders Performance Diagrams PDF template. It offers a minimalistic and classy look that is great for making a statement. The colors have been employed intelligently to add a bit of playfulness while still remaining professional. Construct the ideal Strategic Guide For Positioning Expanded Brand KPI Dashboard To Monitor Sales And Orders Performance Diagrams PDF that effortlessly grabs the attention of your audience Begin now and be certain to wow your customers.


This slide illustrates the KPI dashboard for workforce diversity providing details regarding headcount by seniority, gender and gender. It also provides information regarding monthly median age by gender and women at senior level forecast. Crafting an eye-catching presentation has never been more straightforward. Let your presentation shine with this tasteful yet straightforward Strategies To Deploy Diversity In Workplace KPI Dashboard To Monitor Workforce Diversity Infographics PDF template. It offers a minimalistic and classy look that is great for making a statement. The colors have been employed intelligently to add a bit of playfulness while still remaining professional. Construct the ideal Strategies To Deploy Diversity In Workplace KPI Dashboard To Monitor Workforce Diversity Infographics PDF that effortlessly grabs the attention of your audience Begin now and be certain to wow your customers.


This slide represents the dashboard to monitor production plant efficiency for the multiple shifts. The multiple kpis covered in dashboard are availability, performance of manufacturing plant machines. It also provides information regarding the total downtime along with good parts yield. Presenting this PowerPoint presentation, titled Strategies For Effective Manufacturing Dashboard To Monitor Production Plant Shift Professional PDF, with topics curated by our researchers after extensive research. This editable presentation is available for immediate download and provides attractive features when used. Download now and captivate your audience. Presenting this Strategies For Effective Manufacturing Dashboard To Monitor Production Plant Shift Professional PDF. Our researchers have carefully researched and created these slides with all aspects taken into consideration. This is a completely customizable Strategies For Effective Manufacturing Dashboard To Monitor Production Plant Shift Professional PDF that is available for immediate downloading. Download now and make an impact on your audience. Highlight the attractive features available with our PPTs.
This slide represents the dashboard to monitor production plant efficiency for the multiple shifts. The multiple kpis covered in dashboard are availability, performance of manufacturing plant machines. It also provides information regarding the total downtime along with good parts yield. Presenting this PowerPoint presentation, titled Plan To Enhance Manufacturing Dashboard To Monitor Production Plant Shift Icons PDF, with topics curated by our researchers after extensive research. This editable presentation is available for immediate download and provides attractive features when used. Download now and captivate your audience. Presenting this Plan To Enhance Manufacturing Dashboard To Monitor Production Plant Shift Icons PDF. Our researchers have carefully researched and created these slides with all aspects taken into consideration. This is a completely customizable Plan To Enhance Manufacturing Dashboard To Monitor Production Plant Shift Icons PDF that is available for immediate downloading. Download now and make an impact on your audience. Highlight the attractive features available with our PPTs.


This slide represents the dashboard to monitor production plant efficiency for the multiple shifts. The multiple KPIs covered in dashboard are availability, performance of manufacturing plant machines. It also provides information regarding the total downtime along with good parts yield. Want to ace your presentation in front of a live audience Our Maintenance Administration Dashboard To Monitor Production Plant Shift Efficiency Diagrams PDF can help you do that by engaging all the users towards you. Slidegeeks experts have put their efforts and expertise into creating these impeccable powerpoint presentations so that you can communicate your ideas clearly. Moreover, all the templates are customizable, and easy-to-edit and downloadable. Use these for both personal and commercial use.


The following slide highlights the various key performance indicators of the AIOps, these can be problem quick review, cloud and infrastructure and applications health Boost your pitch with our creative Integrating Aiops To Enhance Process Effectiveness Aiops Dashboard To Monitor Download PDF. Deliver an awe-inspiring pitch that will mesmerize everyone. Using these presentation templates you will surely catch everyones attention. You can browse the ppts collection on our website. We have researchers who are experts at creating the right content for the templates. So you dont have to invest time in any additional work. Just grab the template now and use them.
SHOW
- 60
- 120
- 180
DISPLAYING: 60 of 182 Item(s)
Page